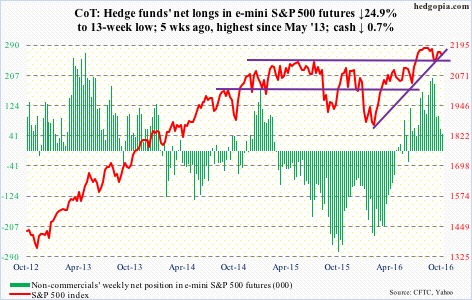
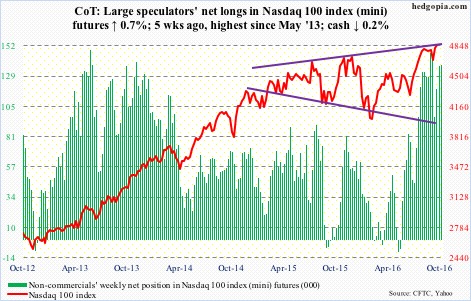
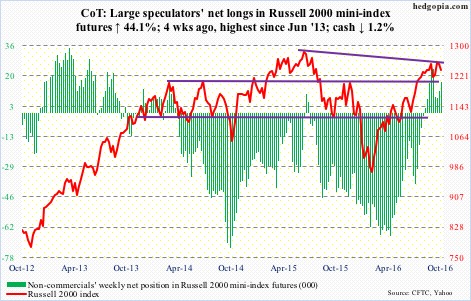
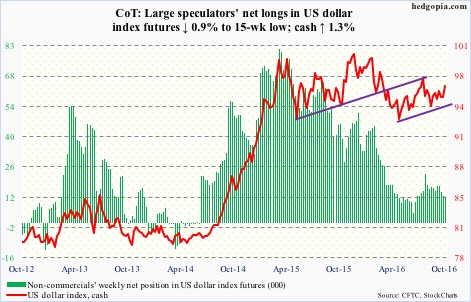
The following are futures positions of non-commercials as of October 4, 2016.
E-mini S&P 500: NYSE margin debt declined $3.3 billion m/m to $471.2 billion in August; the S&P 500 index fell 0.12 percent in the month. After peaking at $507.2 billion in April last year, margin debt bottomed at $435.8 billion in February, which is when stocks in general troughed. Historically, the two tend to correlate well with each other. But since that April peak, margin debt is down $35.9 billion, even as the S&P 500 broke out to a new high.
There is a similar divergence in play between the S&P 500 and flows into U.S.-based equity funds. Since the week ended February 10 this year, the latter has lost nearly $102 billion. In the week ended Wednesday, another $9.1 billion was redeemed (courtesy of Lipper). In the same week, SPY, the SPDR S&P 500 ETF, attracted $155 million, after inflows of $1.7 billion in the prior week (courtesy of ETF.com).
The 50-day moving average on the cash continues to drop – albeit ever so slightly – and resisted rally attempts all week. For now, the index remains range-bound – between 2175 and 2120.
Currently net long 45.1k, down 15k.
Nasdaq 100 index (mini): In the week ended Wednesday, QQQ, the PowerShares Nasdaq 100 ETF, saw $823 million in outflows, following inflows of $1.9 billion in the prior couple of weeks (courtesy of ETF.com).
The September 21st mini-break out of 4840 was defended several times this week, but increasingly there are signs bulls are struggling to save it. The weekly chart flashed a doji.
Currently net long 137.4k, up 897.
Russell 2000 mini-index: The 50-day moving average on the cash was tested three times this week, with the index closing the week right on it. The average is still rising but seems to be in the process of going flat, and then down in due course.
Since the June 27th low through last month’s high, the Russell 2000 rallied north of 16 percent. Since June 27 through this Wednesday, IWM, the iShares Russell 2000 ETF, attracted only $88 million, versus SPY’s $5.1 billion and QQQ’s $664 million. In the week ended Wednesday, IWM saw outflows of $555 million (courtesy of ETF.com).
Currently net long 16.5k, up 5.1k.
US Dollar Index: Monday’s ISM report (manufacturing up 2.1 points m/m to 51.5 in September), gave a jolt to the US dollar index. Plus, Jeffrey Lacker, the Richmond Fed president, and Loretta Mester, president of the Cleveland Fed, made hawkish comments.
Spot US dollar index rallied past its 200-day moving average, and is also past its 50-day. Both these averages are declining. It rallied 1.3 percent for the week, but was unable to take out the declining trend line from December 3 last year. Daily momentum indicators are overbought.
Currently net long 12.1k, down 105.
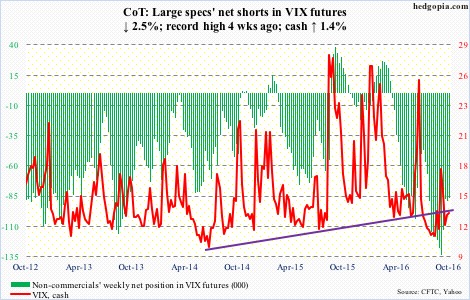
VIX: The 50-day moving average on the cash continues to inch higher, but at the same time VIX is struggling to close above that. On Friday, it achieved that feat with a long-legged doji. Since August 5 this year, the cash has been making higher highs, and the streak continued this week.
Volatility is suppressed.
For the past three weeks, the VIX-to-VXV ratio has remained suppressed in high-0.70s/low-0.80s.
 News
News  Market Data
  Discover