News
News  Market Data
  Discover
Support: 888-992-3836
Copyright © 2023 InvestorsHub Inc.


Register for free to join our community of investors and share your ideas. You will also get access to streaming quotes, interactive charts, trades, portfolio, live options flow and more tools.
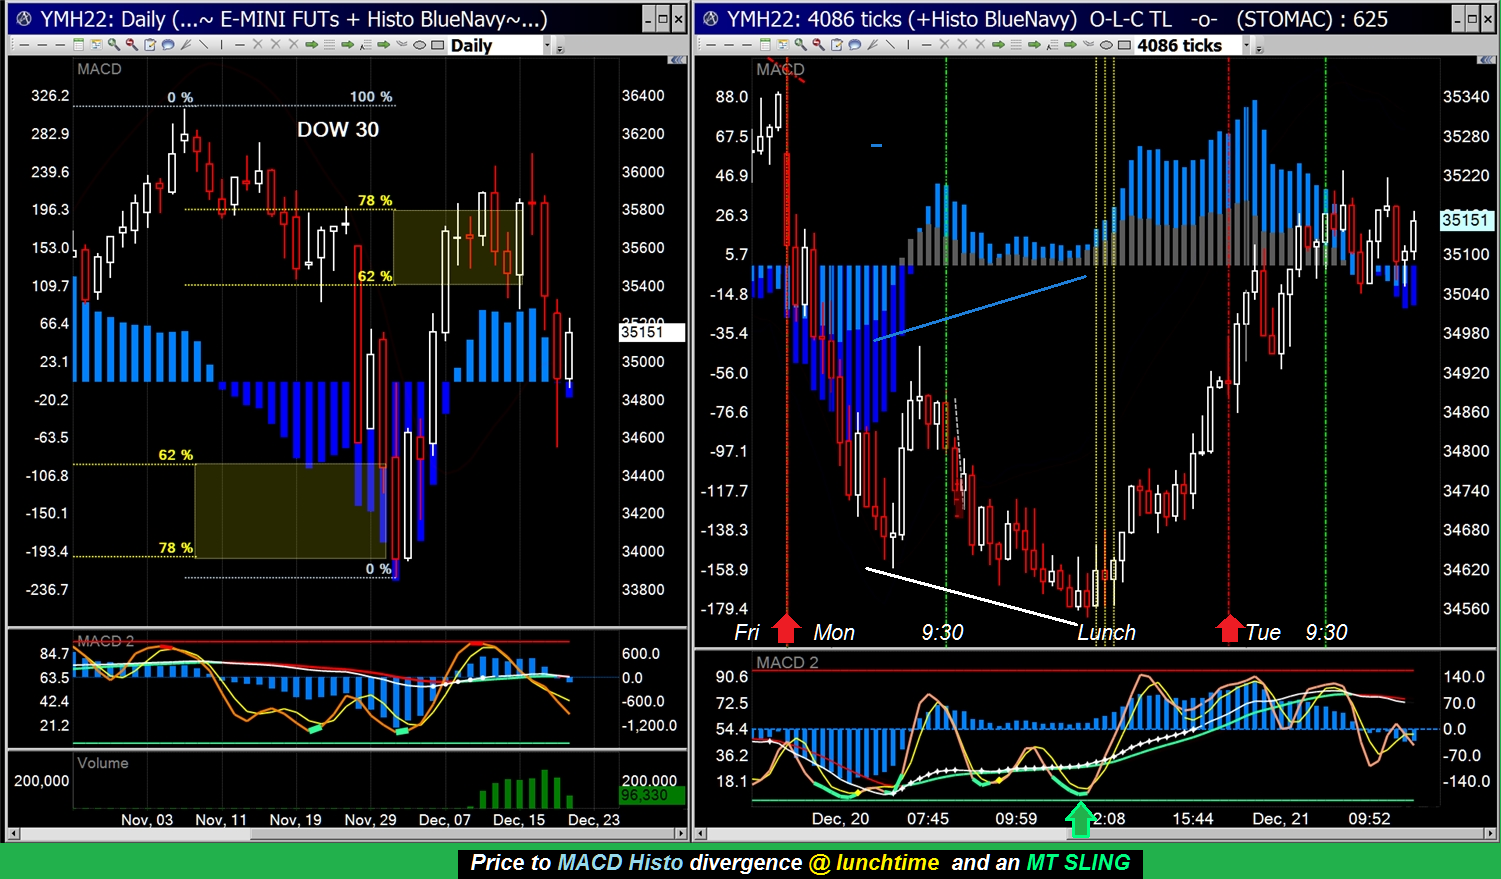
Price-to-Indicator-Divergence is a powerful tool ...
It shows on charts before many reversals...long term and short term...
Take advantage of what is presented -- Price-Action Fundamentals and Divergence and Patterns
.... ... ... ... ... ... ... ...
. . . . . . .
. . . . . . . . . . .
Bullish pattern and 1 contract = $750 ... only took a couple hours

Indicators have patterns too . . . .
...overbought-oversold, hooking up or down, slope direction, divergence...etc.
Medved Trader software is terrific - it's fast!
It uses very little computer resources and is extremely customizable.
It was created by Jerry Medved ... Remember QuoteTracker?
This combines all of QT's good stuff but is far better.
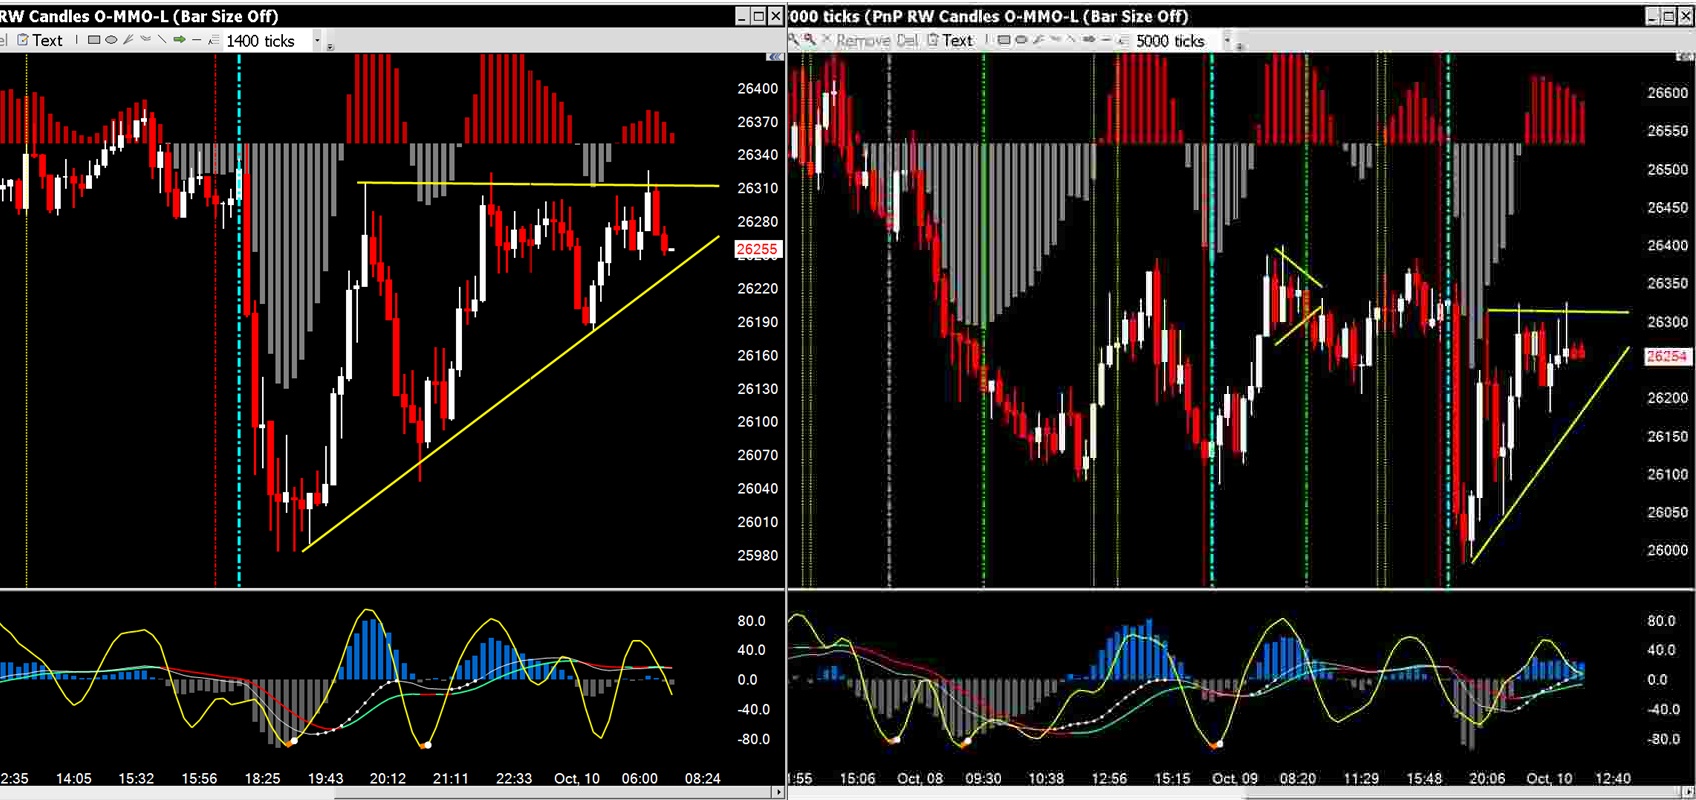
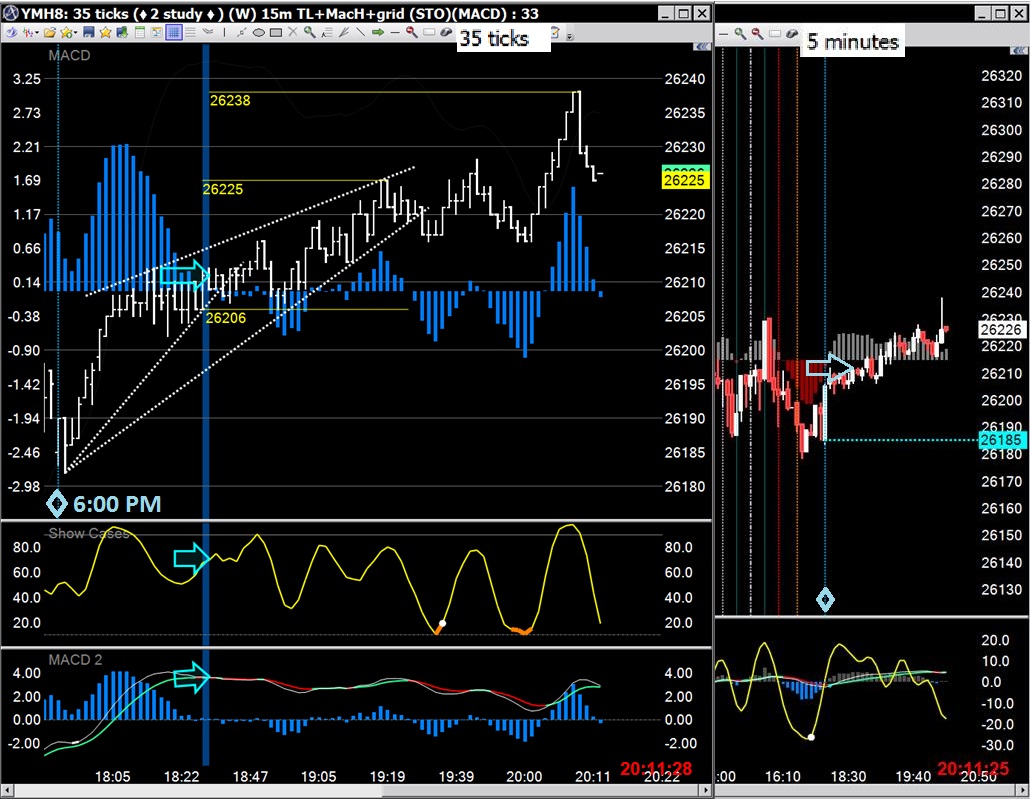
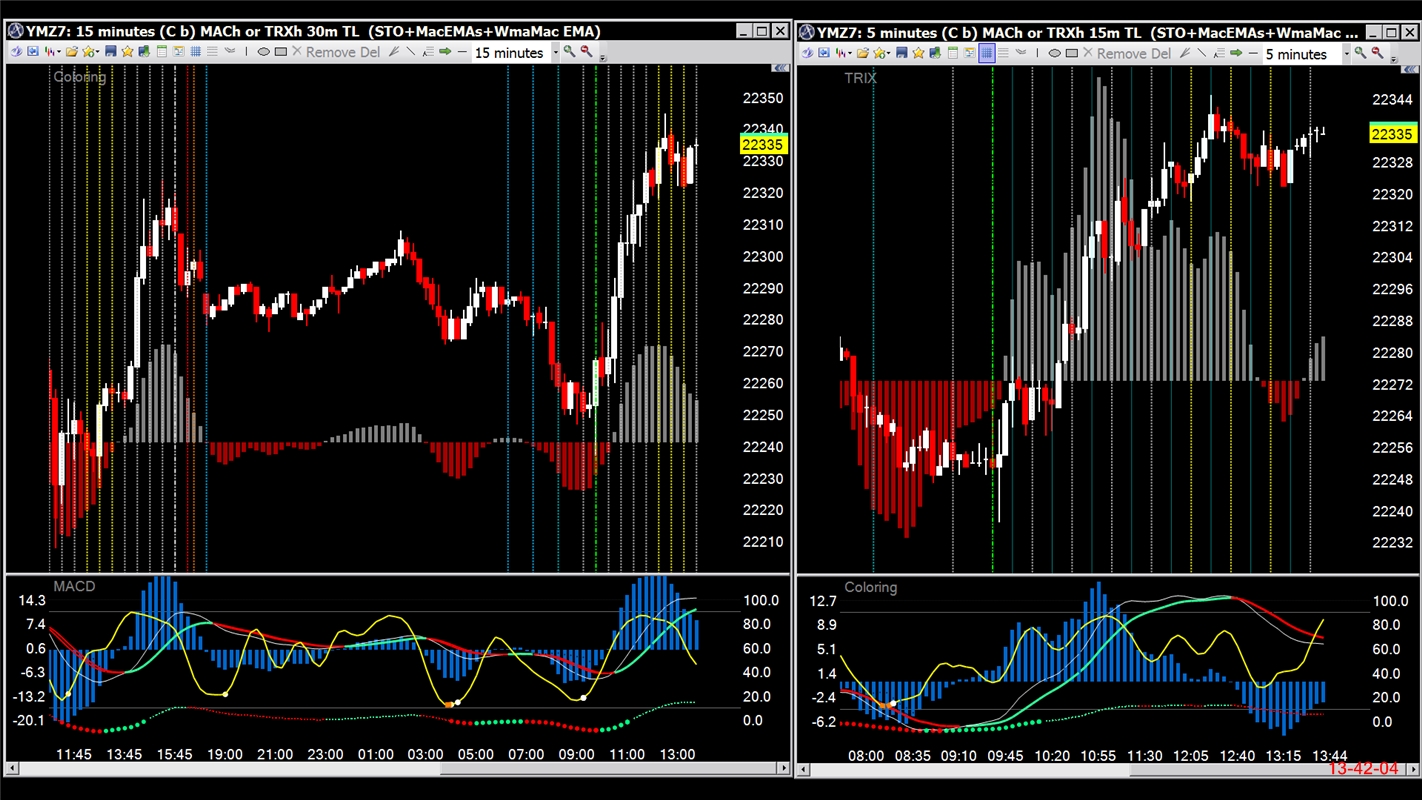
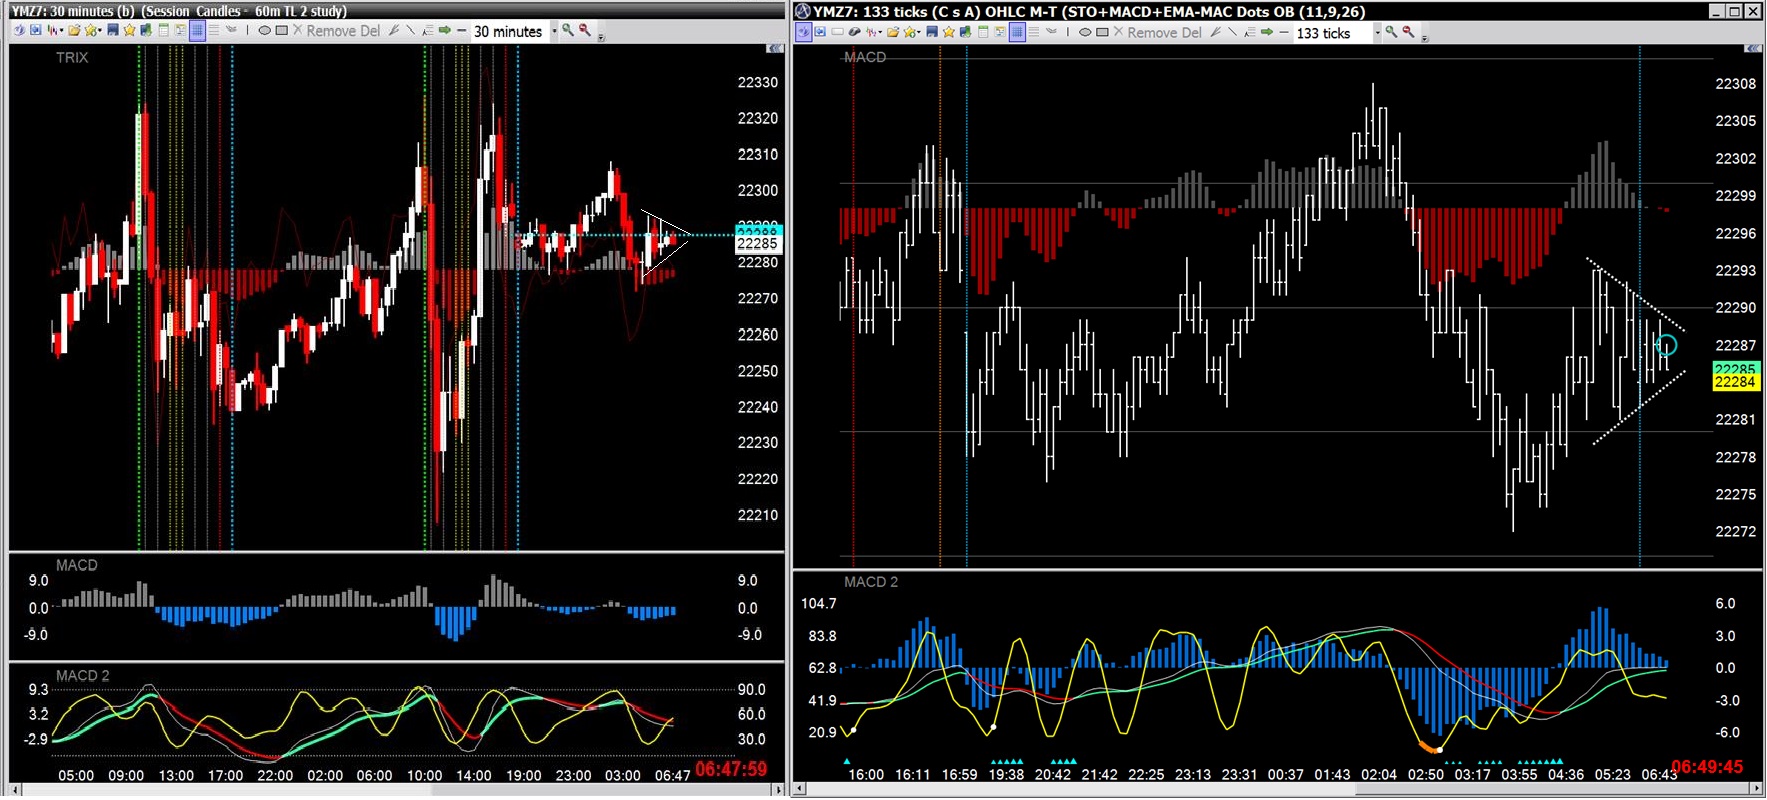
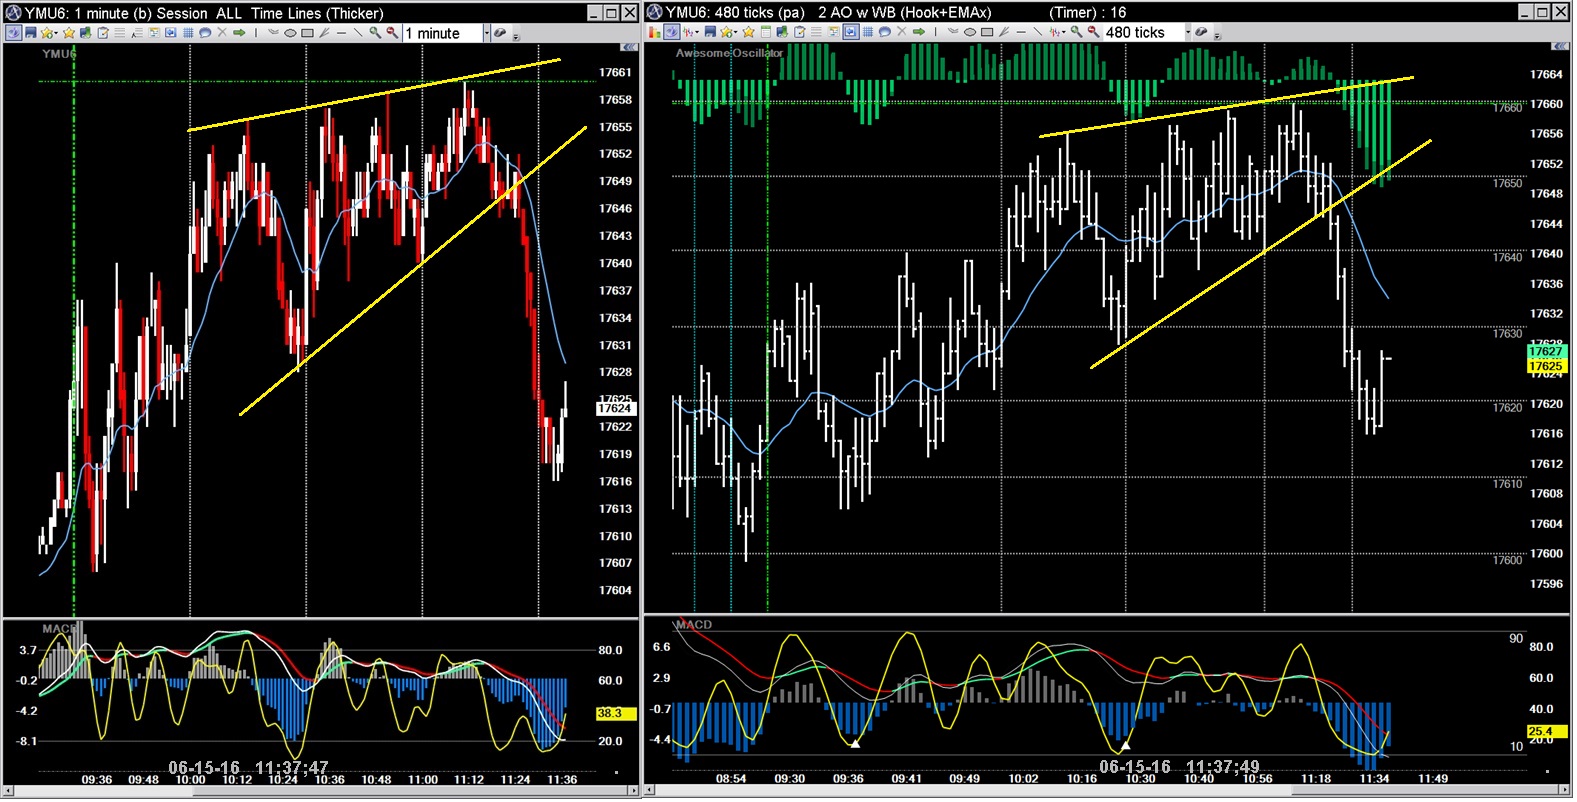
Here are some time based charts:

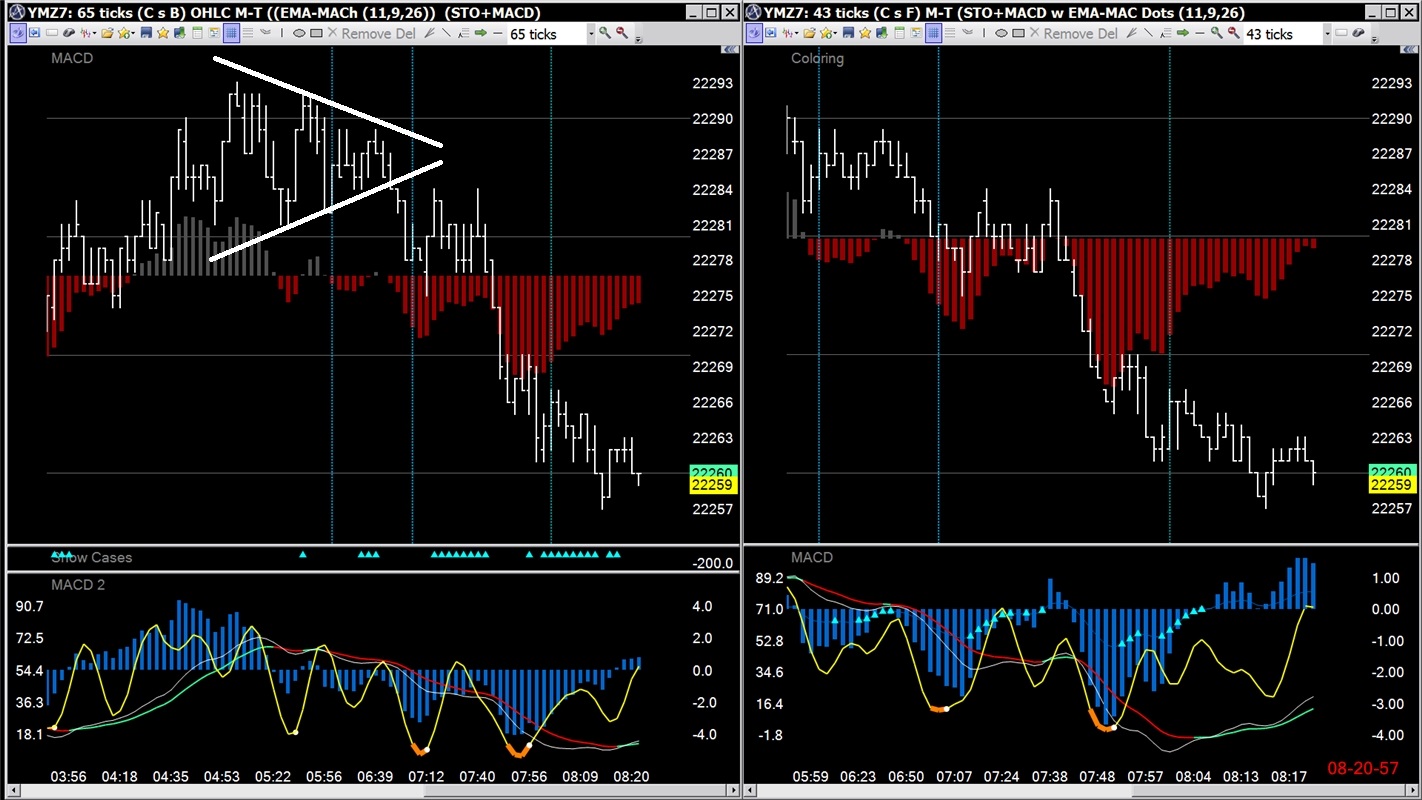
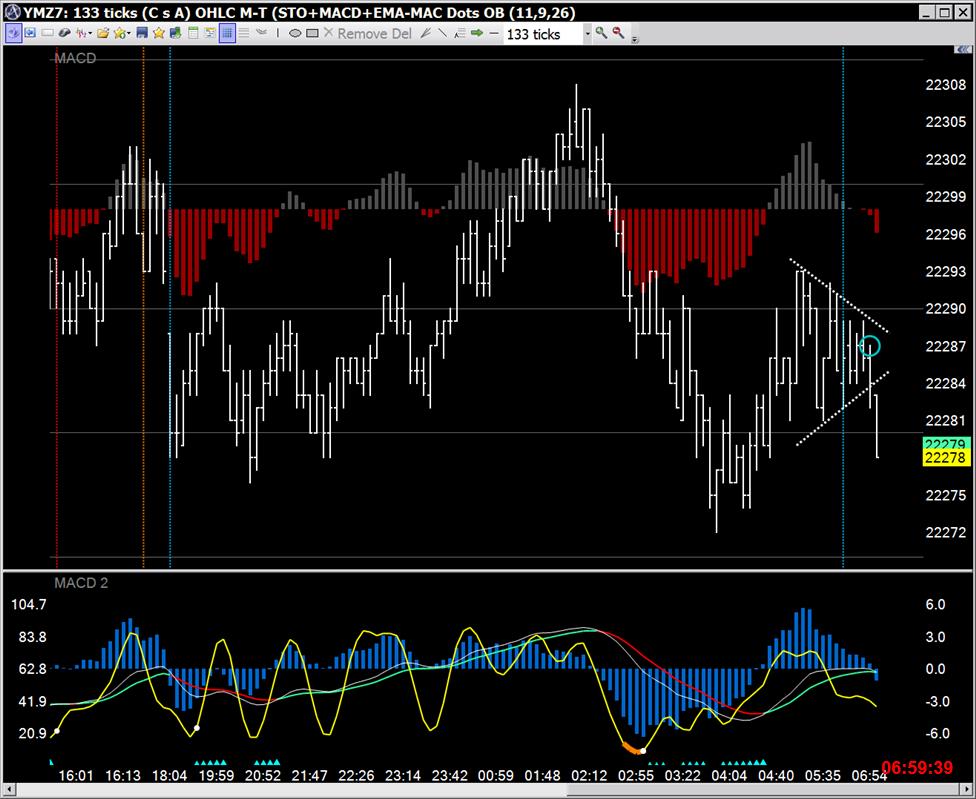
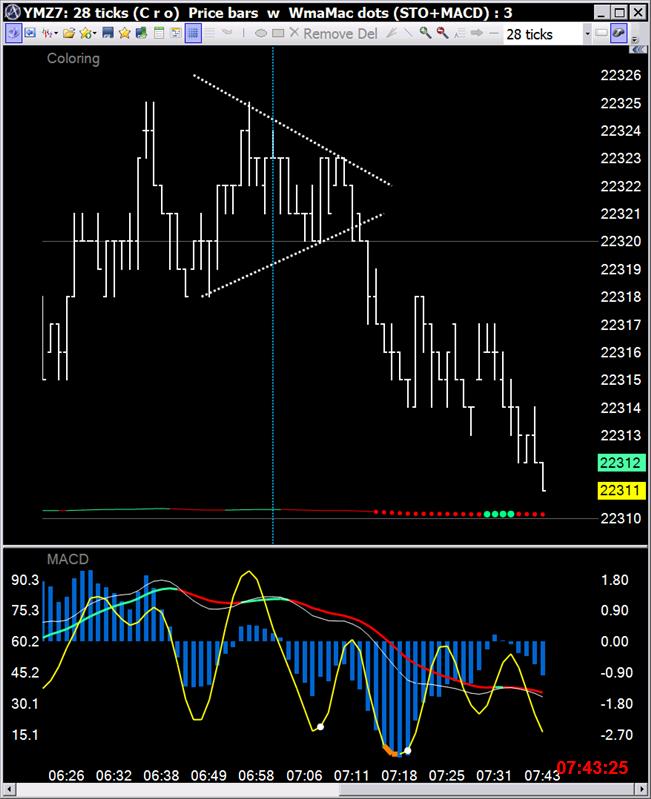
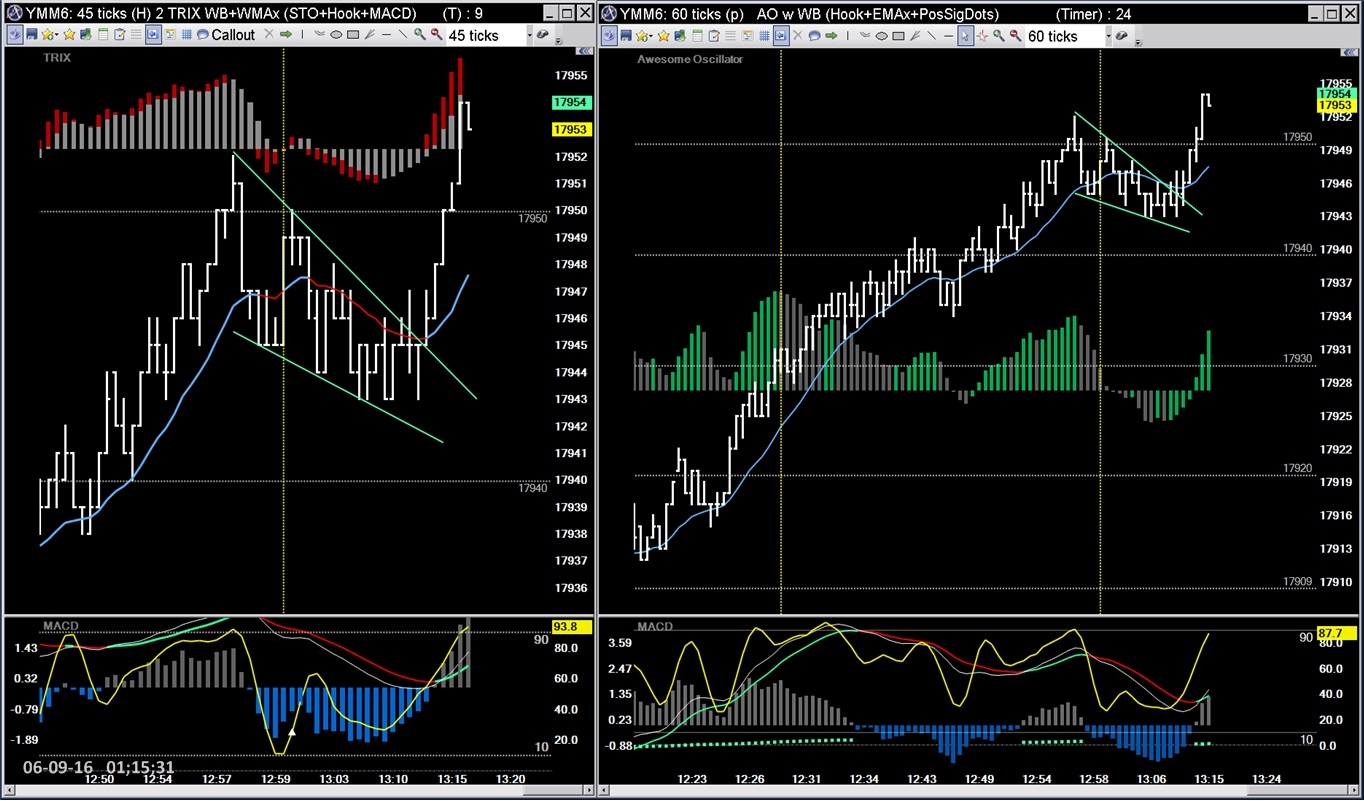
Here are some tick based: 
...and a relatively short term tick chart
$NIO Just Remember One of Teslas biggest investors took 11.4% stake in rival $Nio https://techcrunch.com/2018/10/09/one-of-teslas-biggest-investors-took-an-11-4-stake-in-rival-nio/
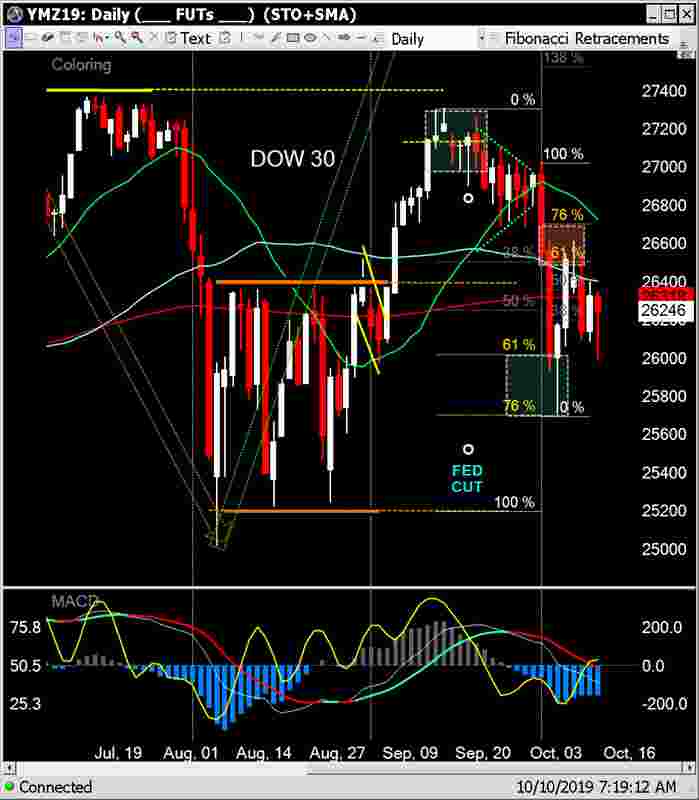
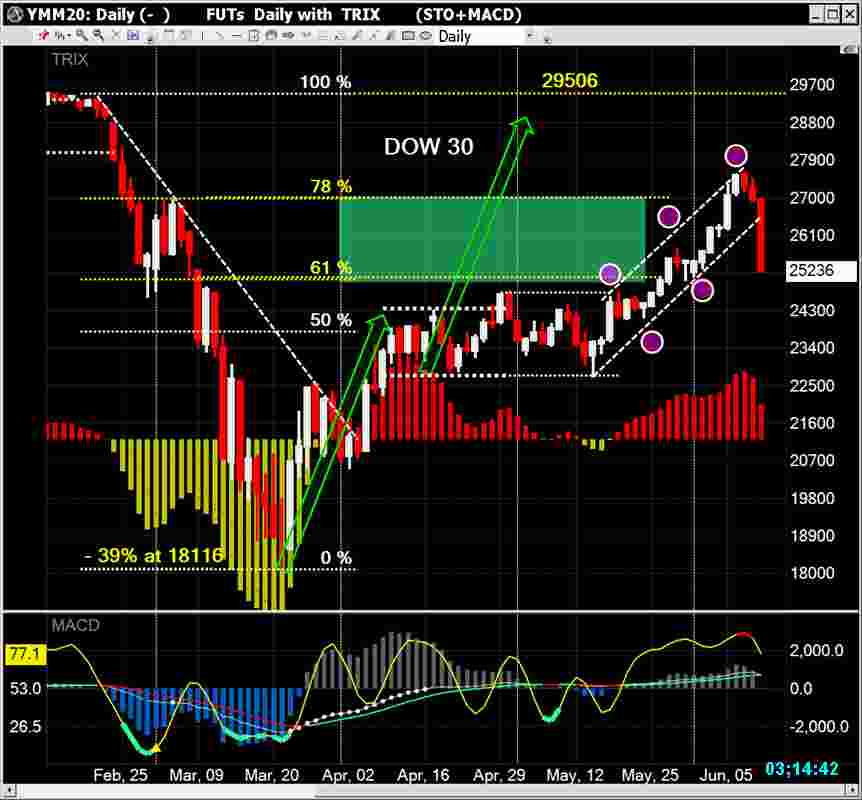
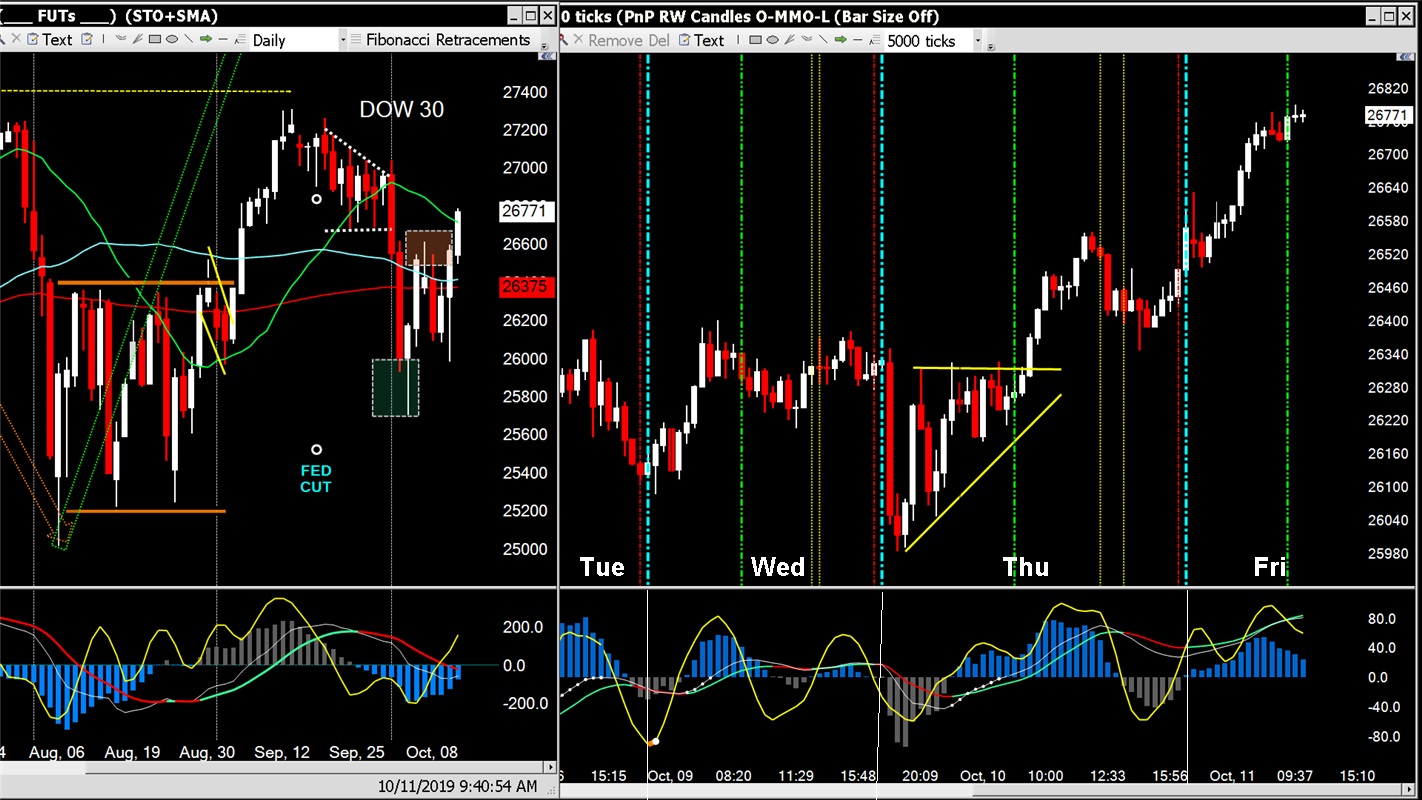
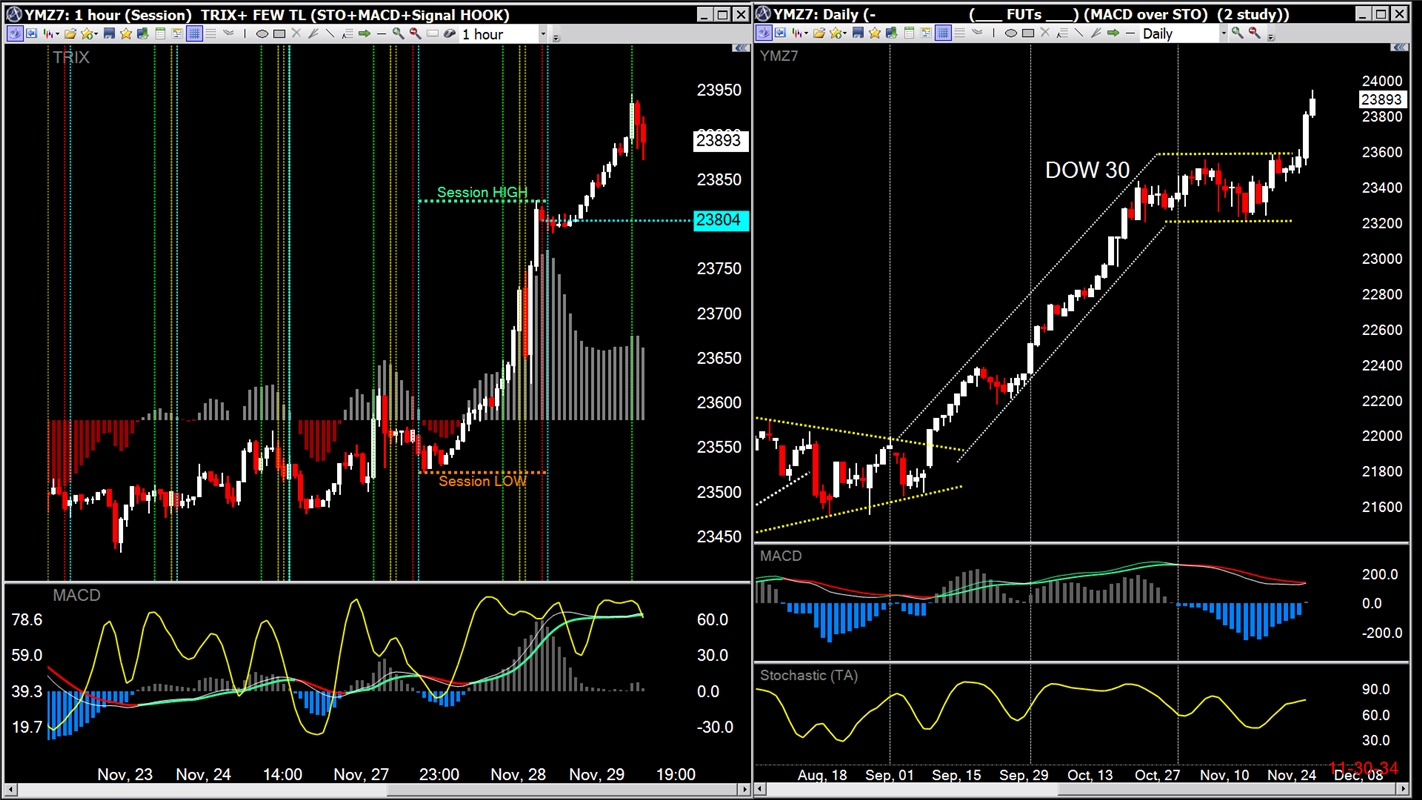
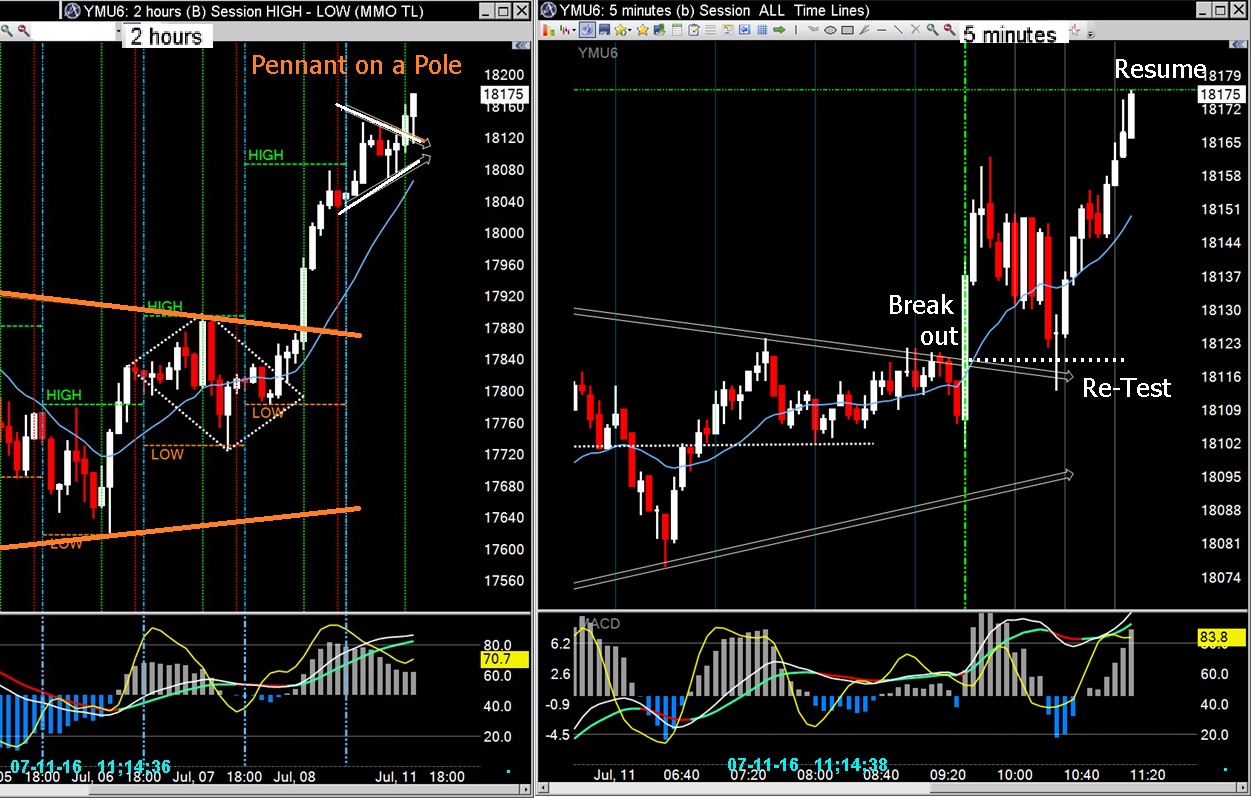
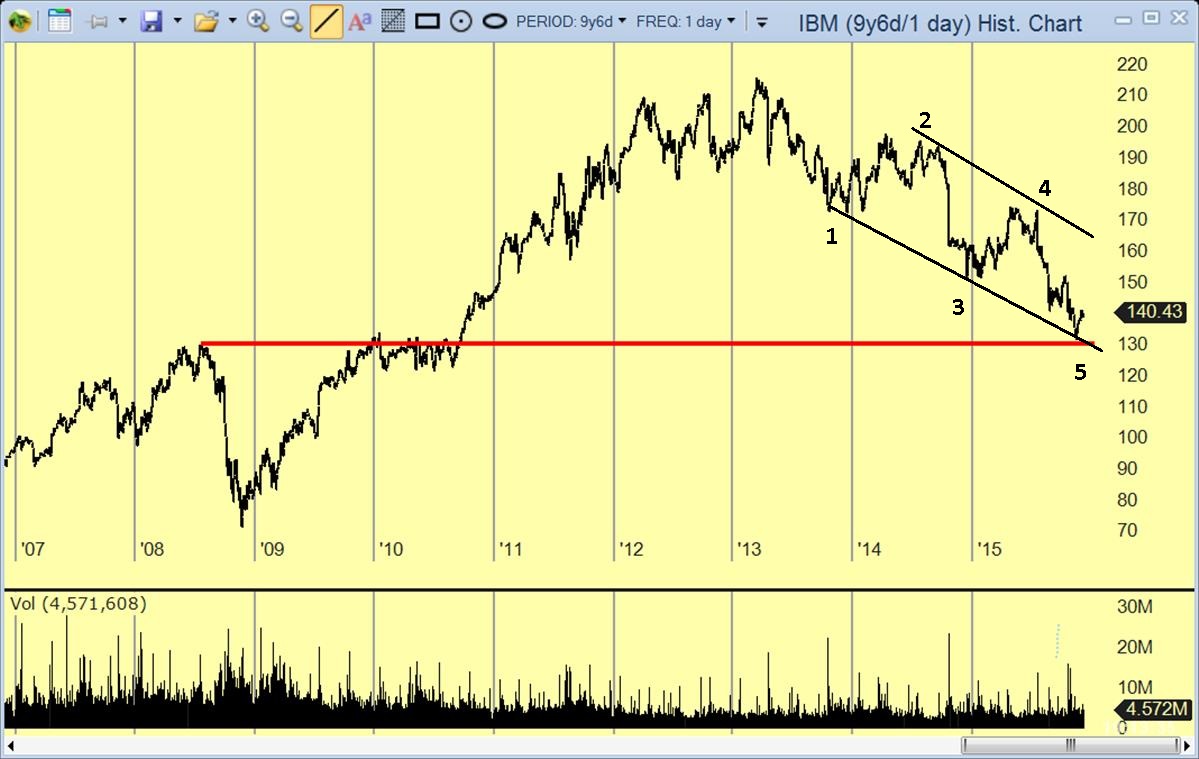
Long term patterns can tell what's to come.
O/S stochastic suggests a break out of the pennant...
.jpg)
Struggling with overhead resistance

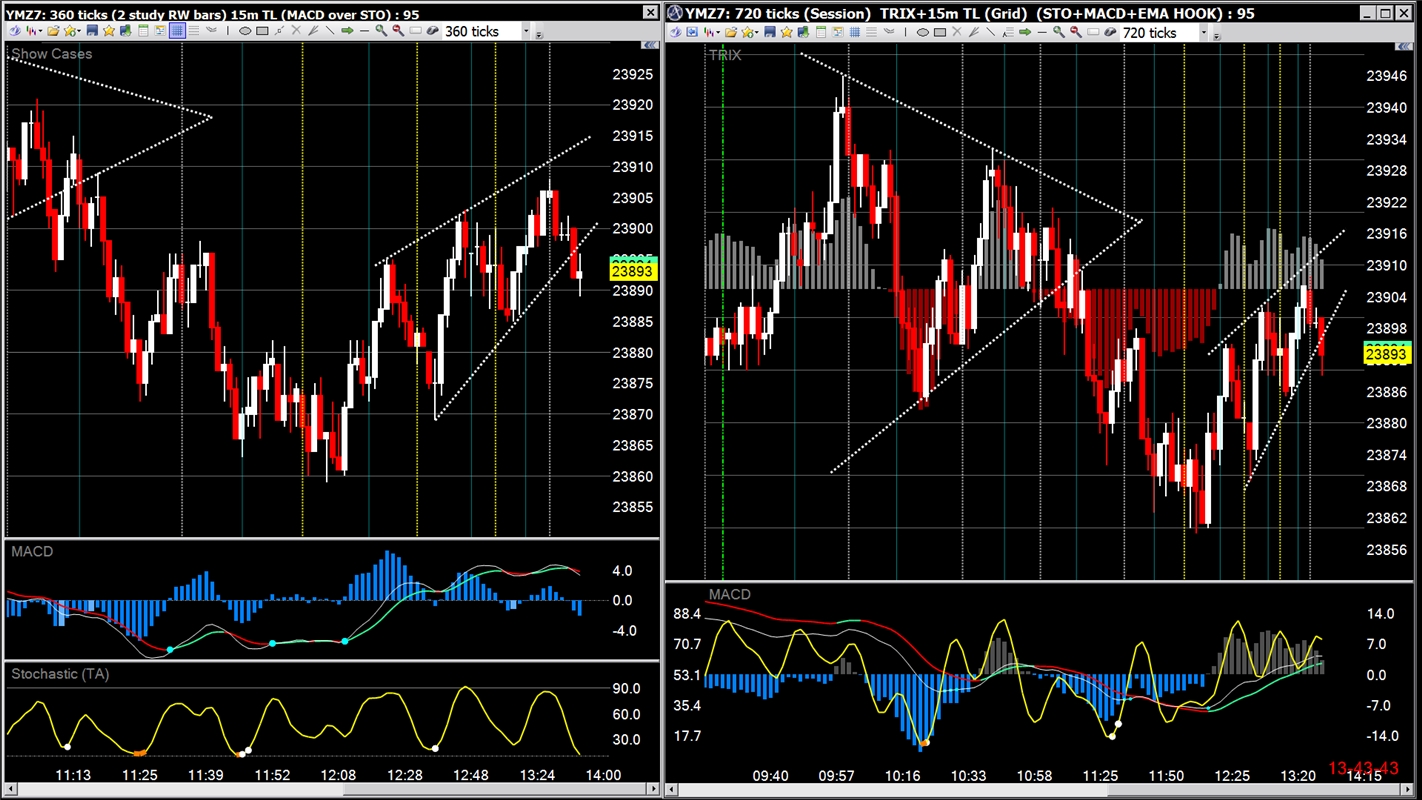
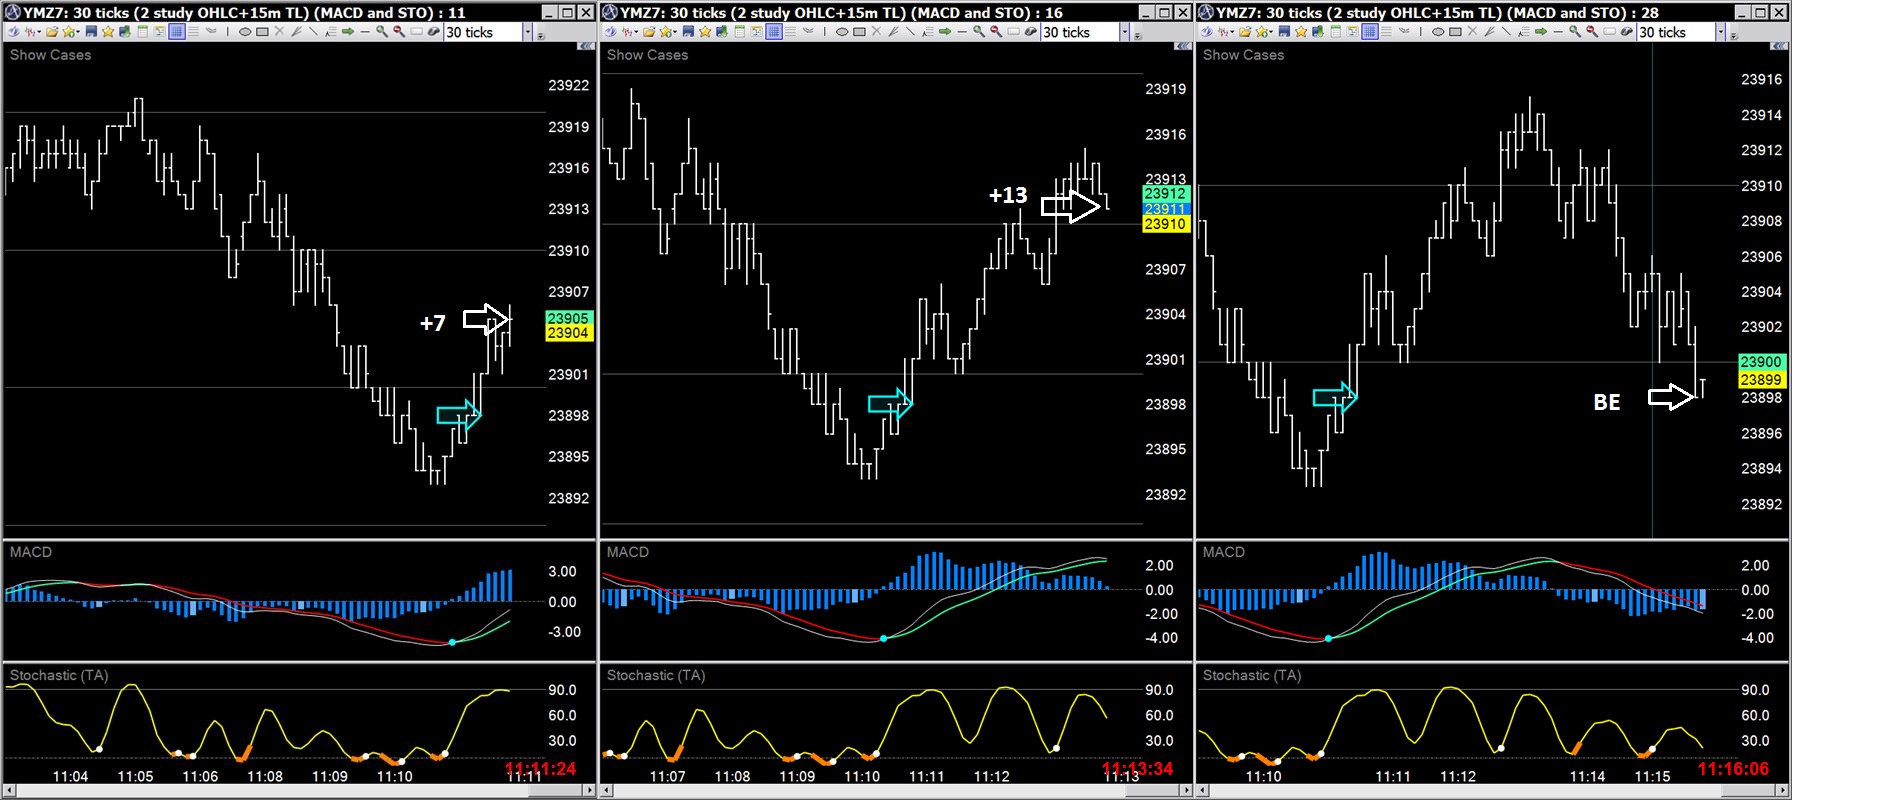
Short-term patterns are not easily seen on longer-term charts
but there are trades available if you are quick enough...
Flags on a pole...'normal' retest of breakouts taking place.
Expecting a continuation of the uptrend pattern...strong MACD EMAs with Stochastic hooking.

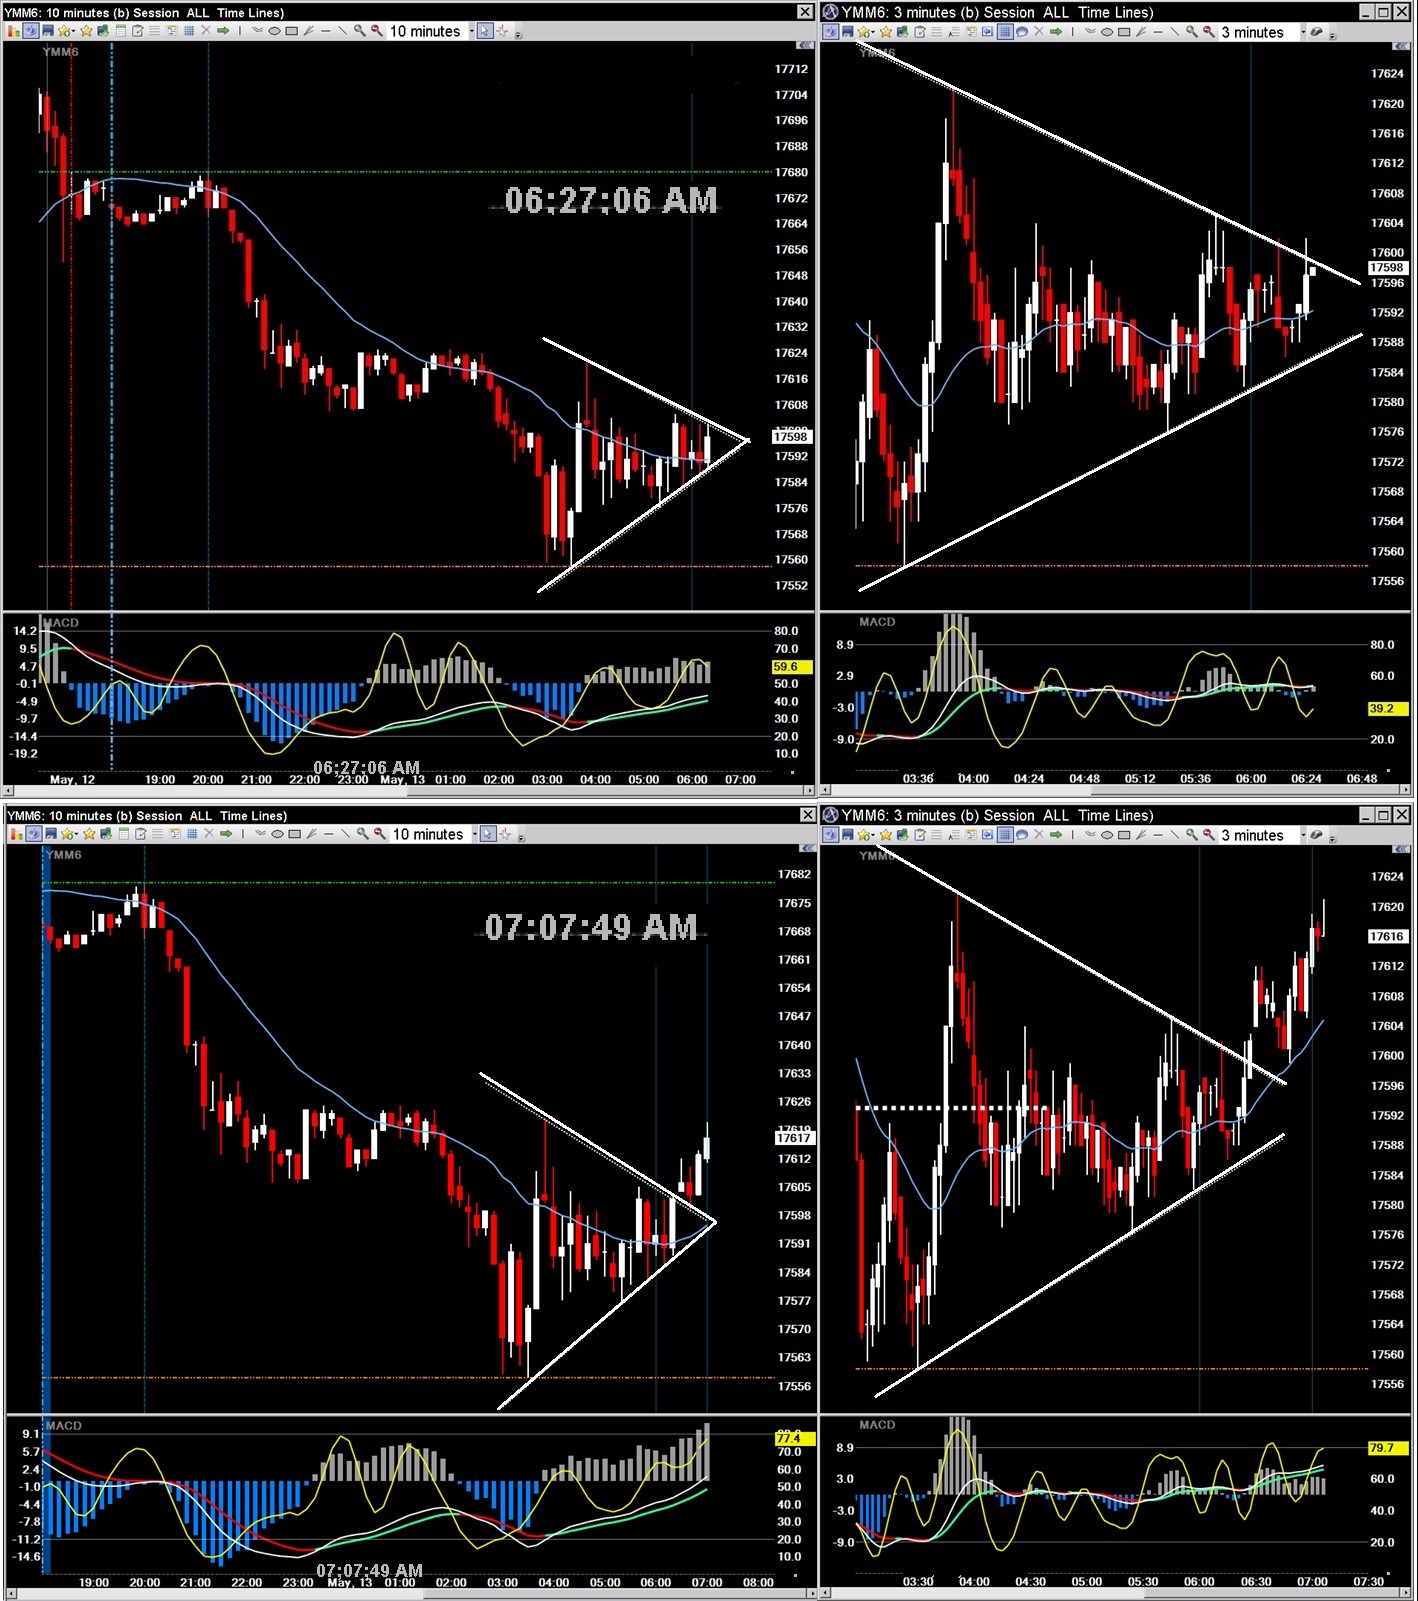
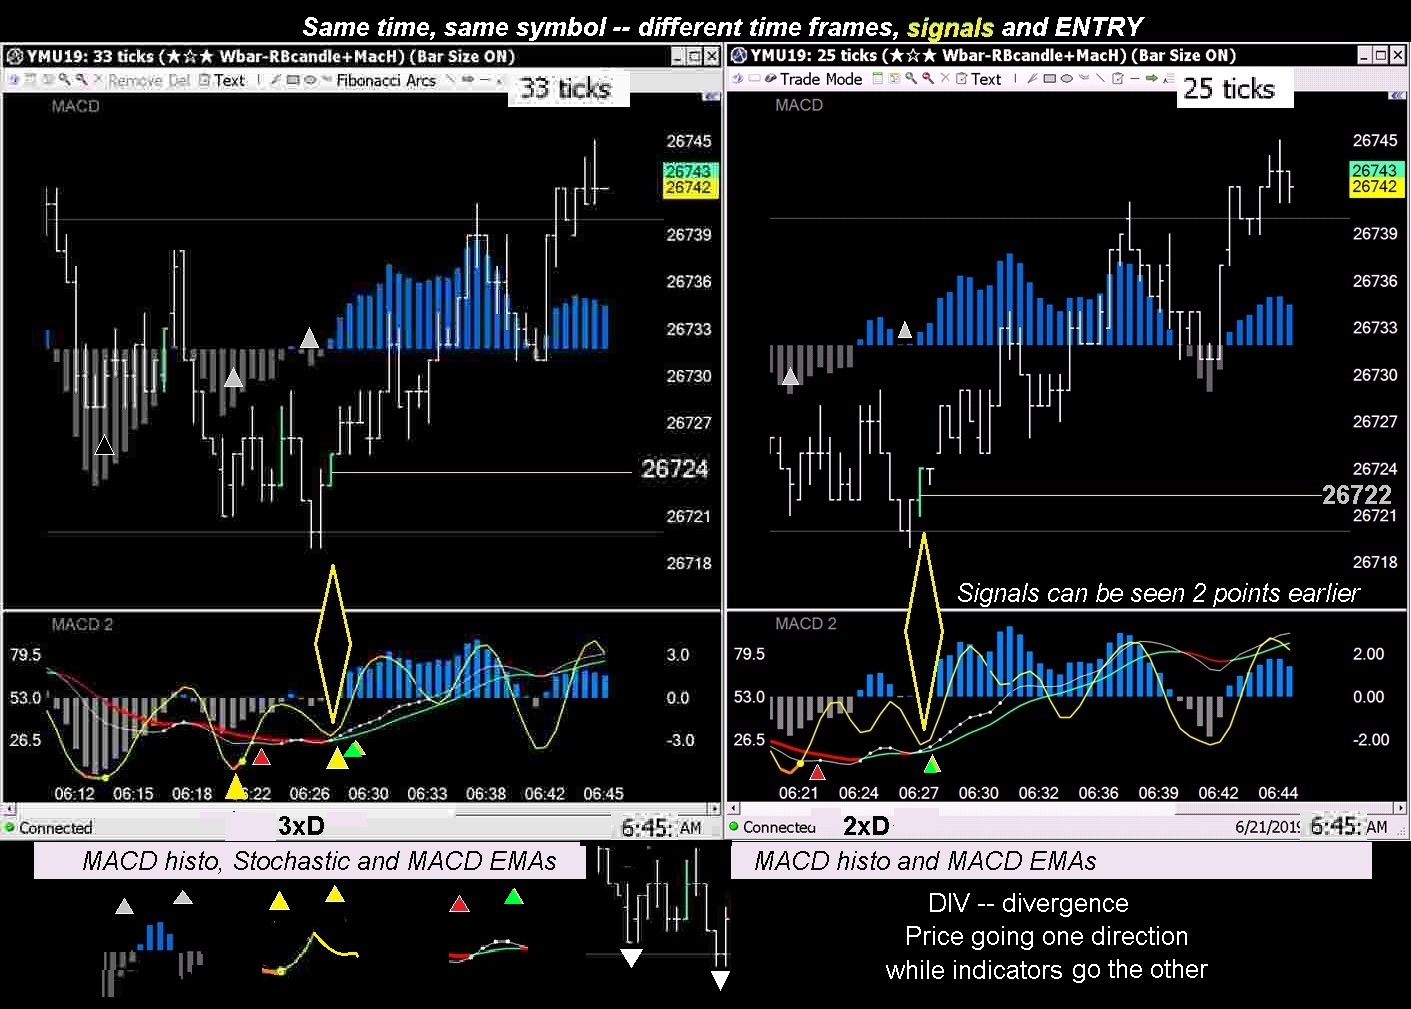
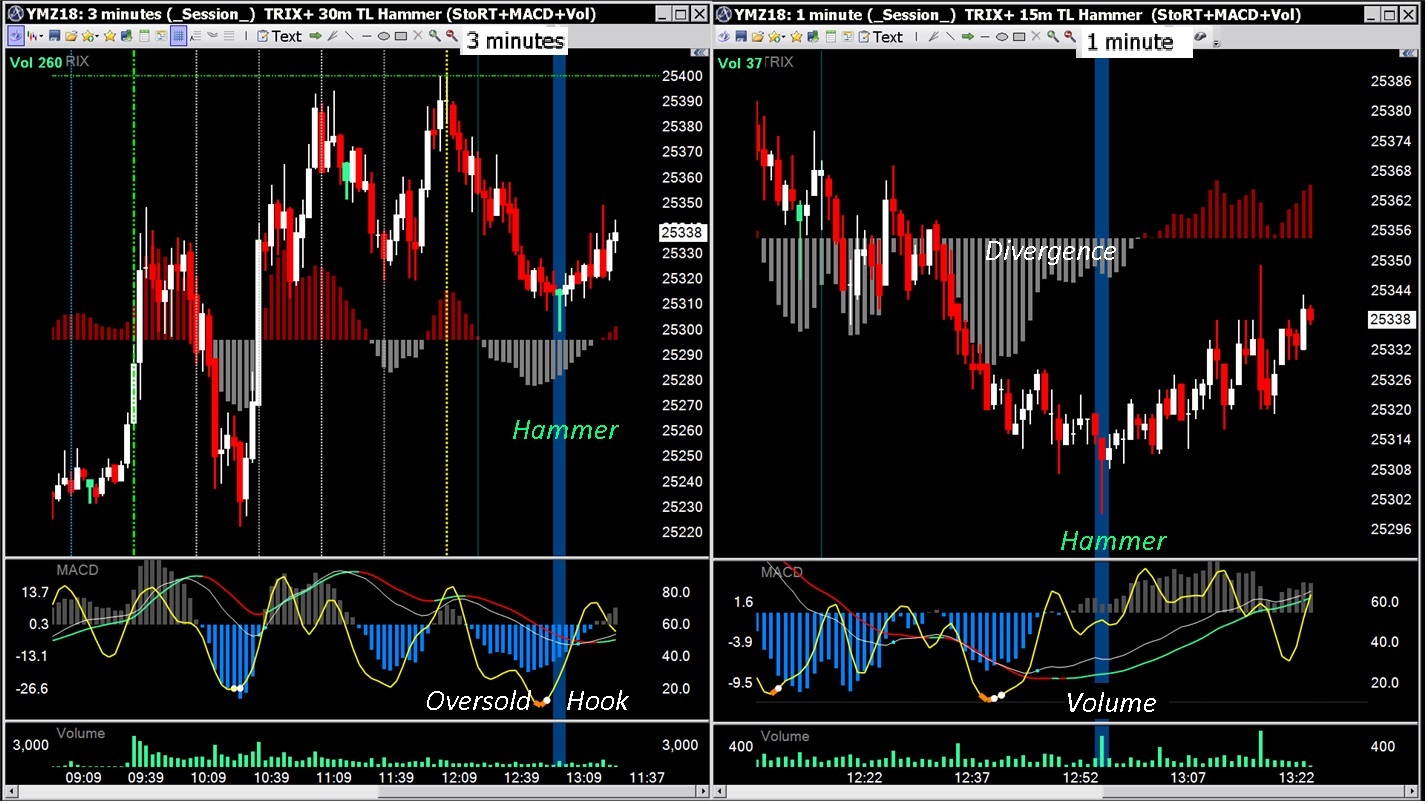
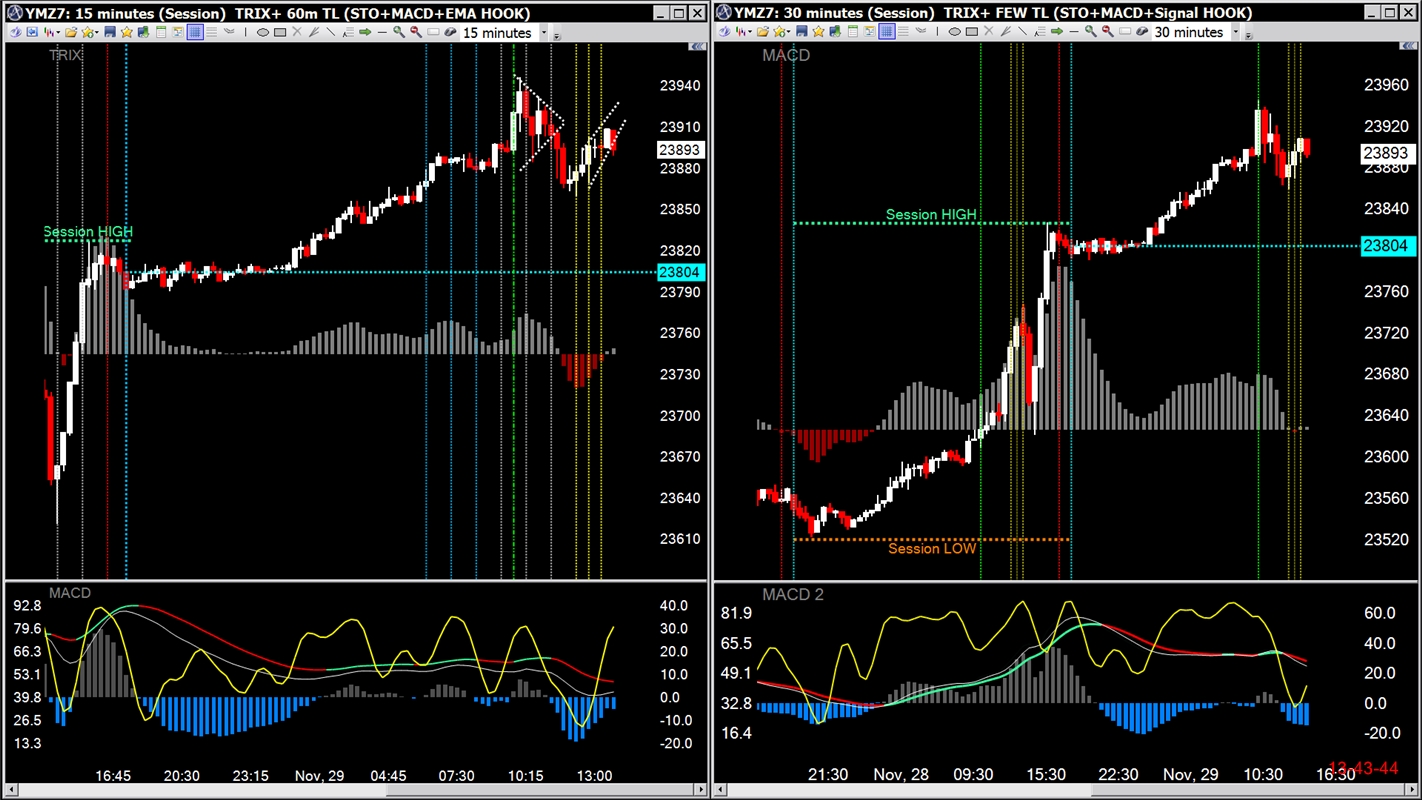
Candlestick clues on multiple time frames . . .
Combining Price Action and Indicator patterns for good entry signals.
FUTs S&P 500 bullish pennant on a pole

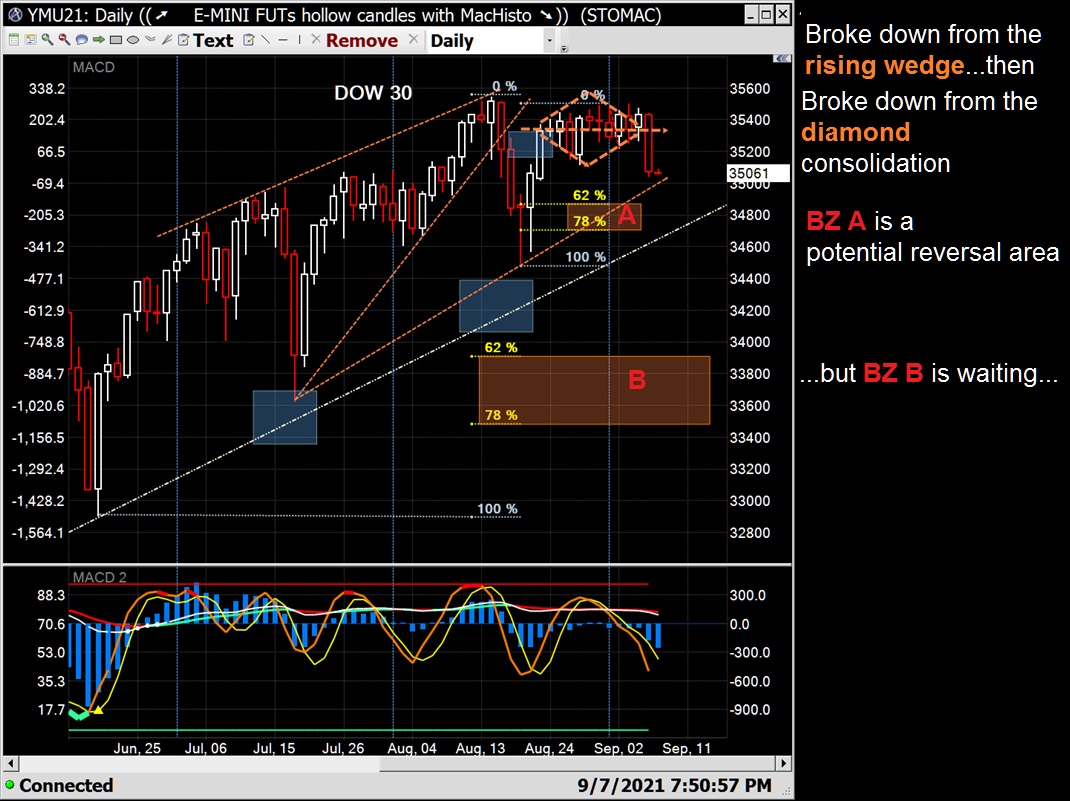
A rising wedge isn't always a negative ...
Now dropping out of a developing wedge

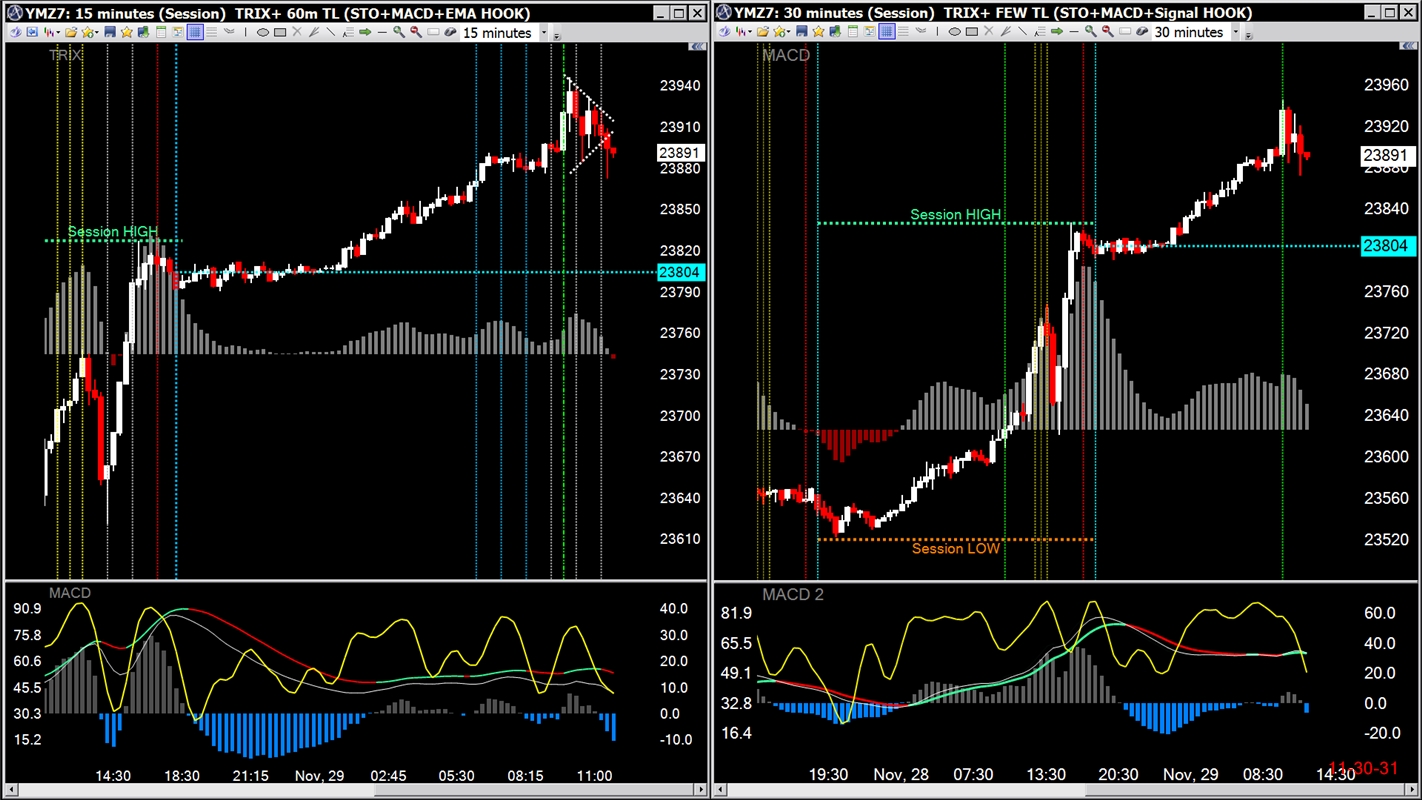
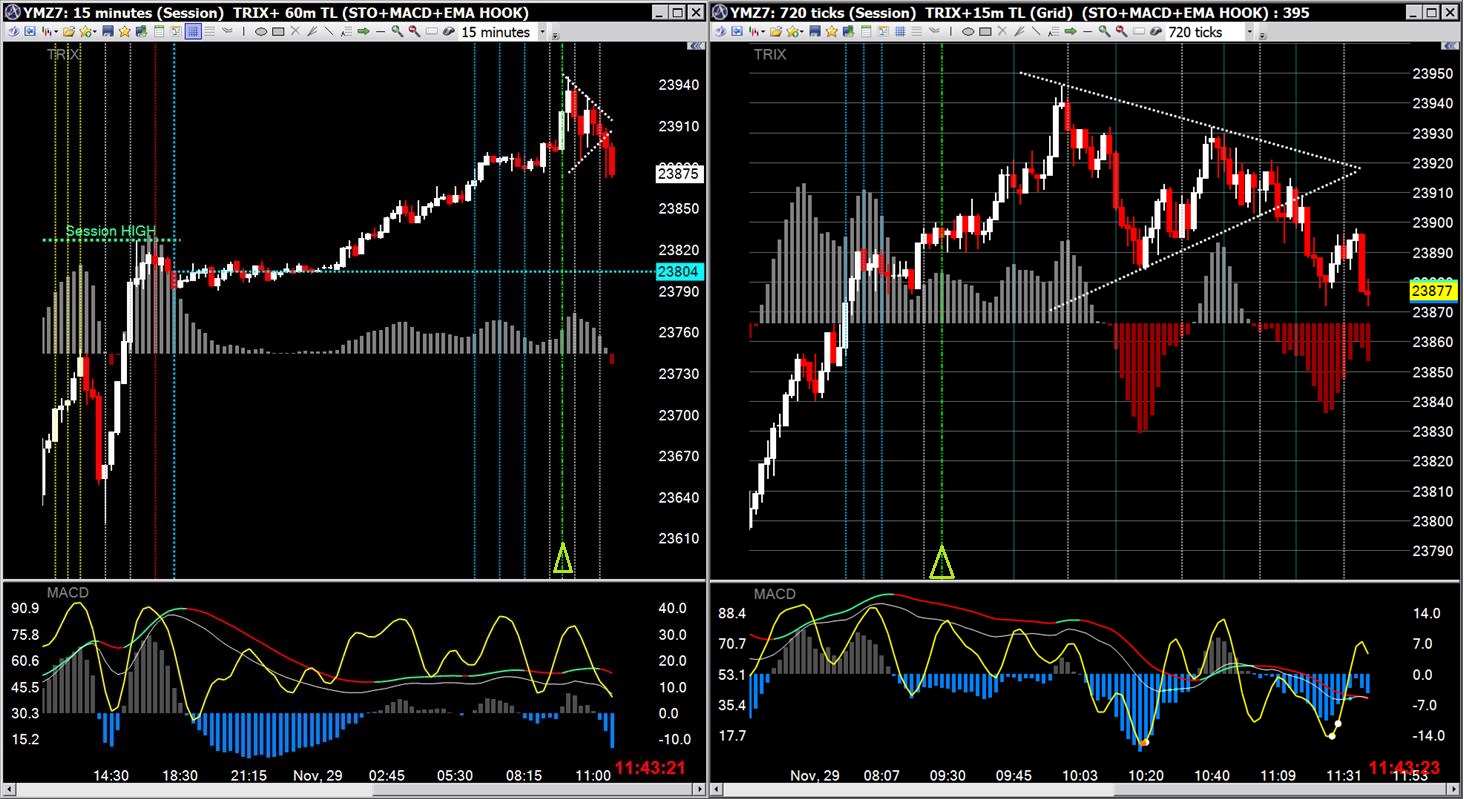
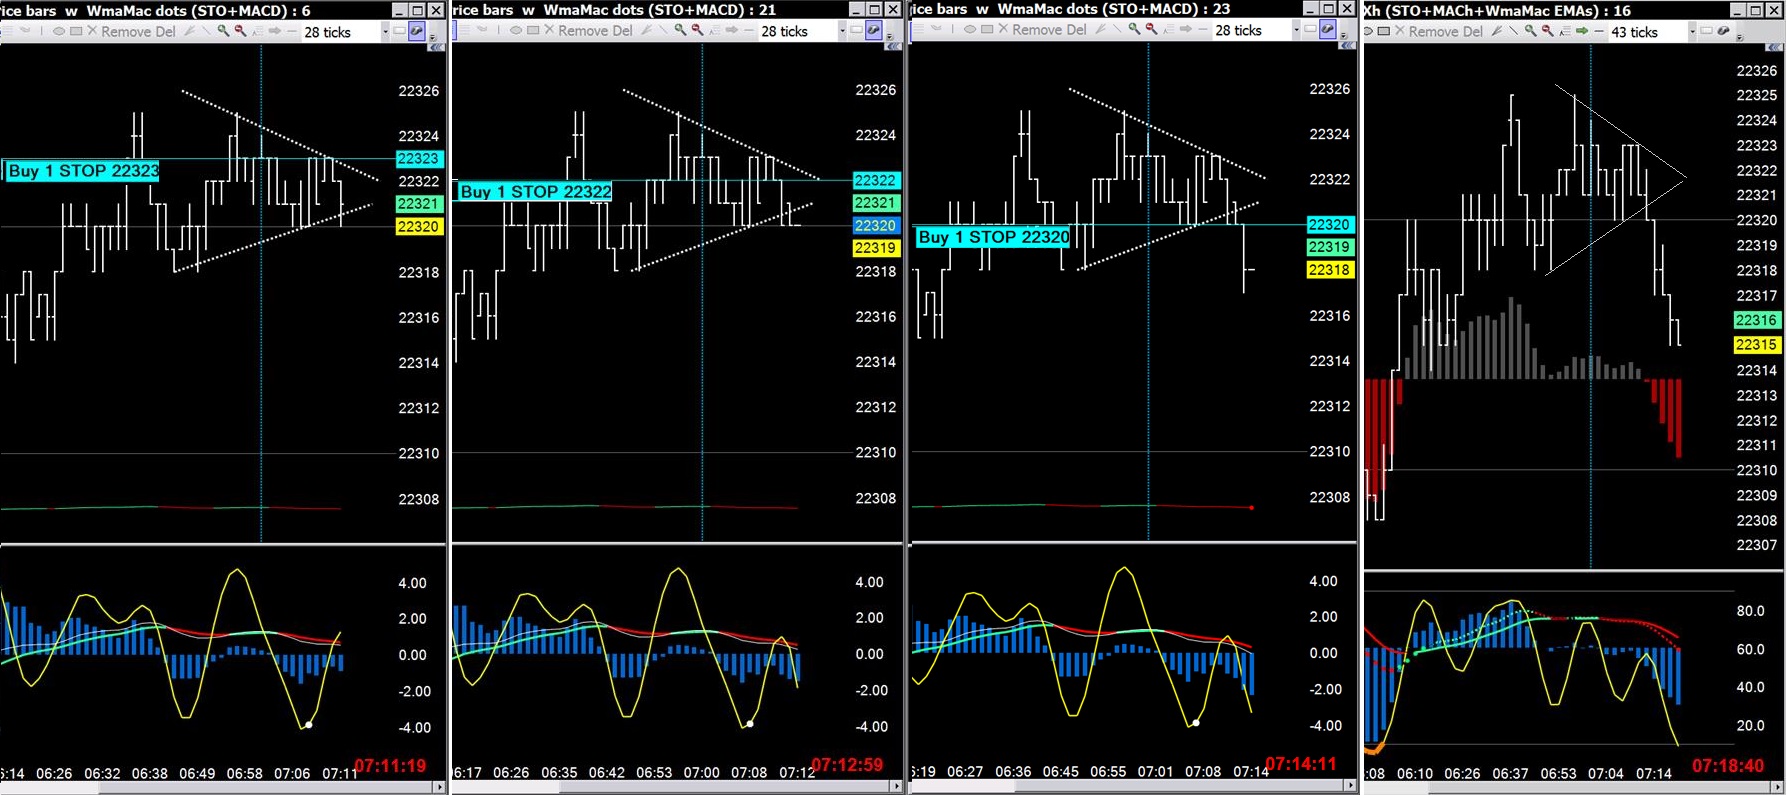
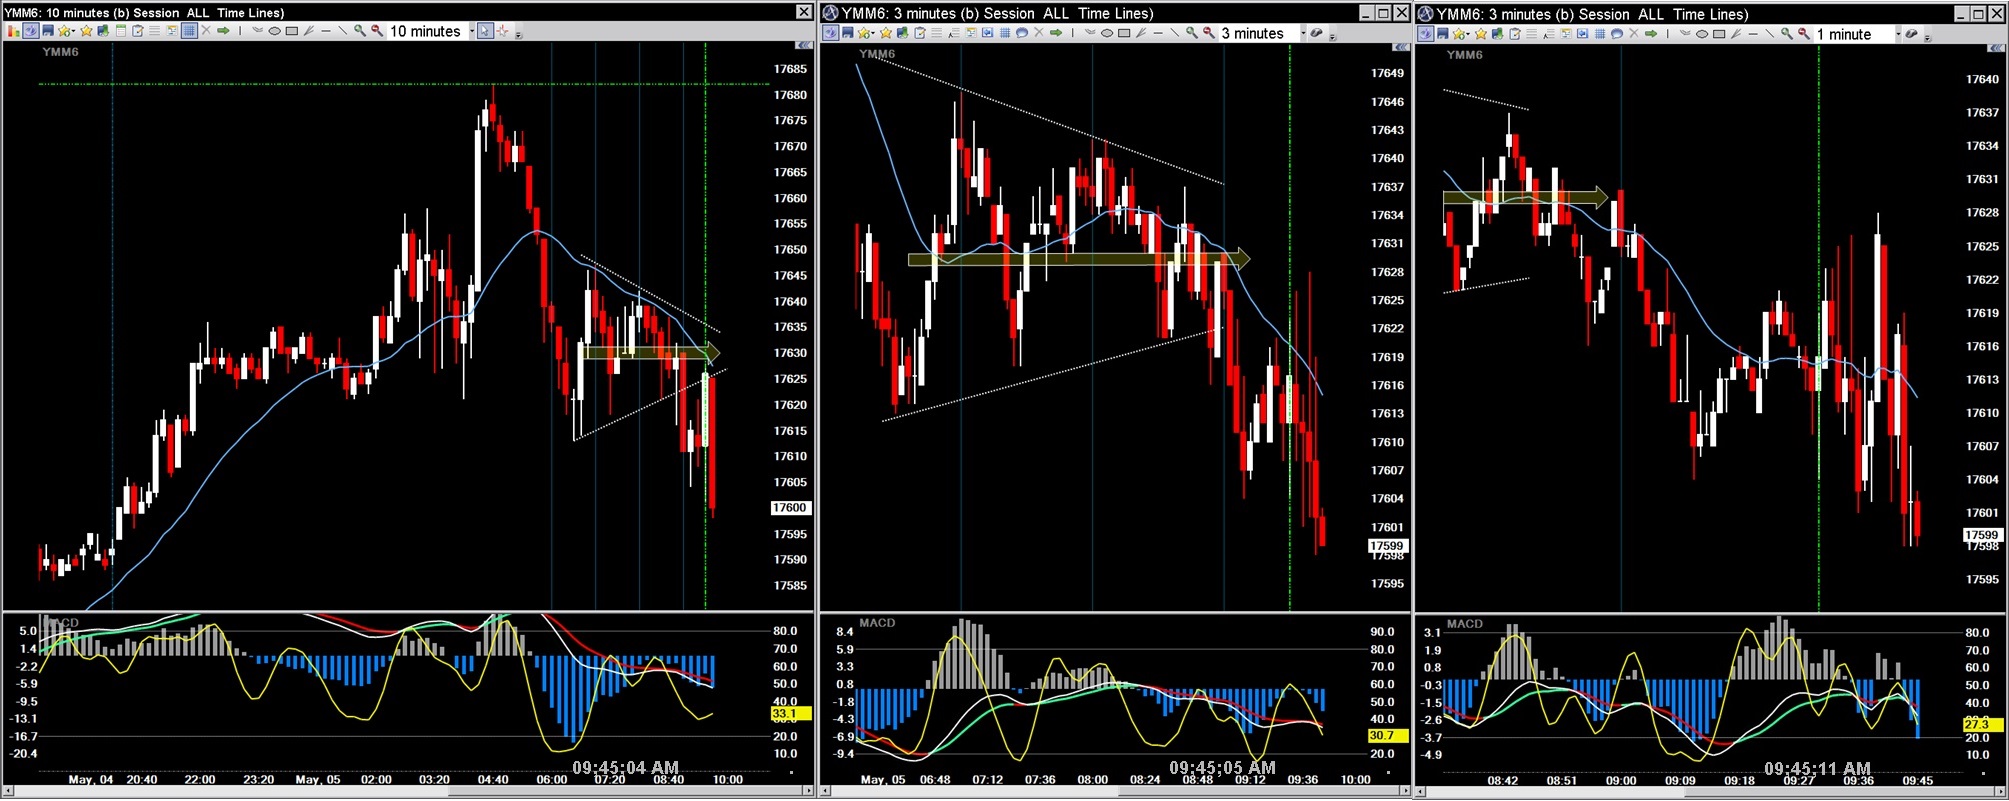
Trading a simple triangle:
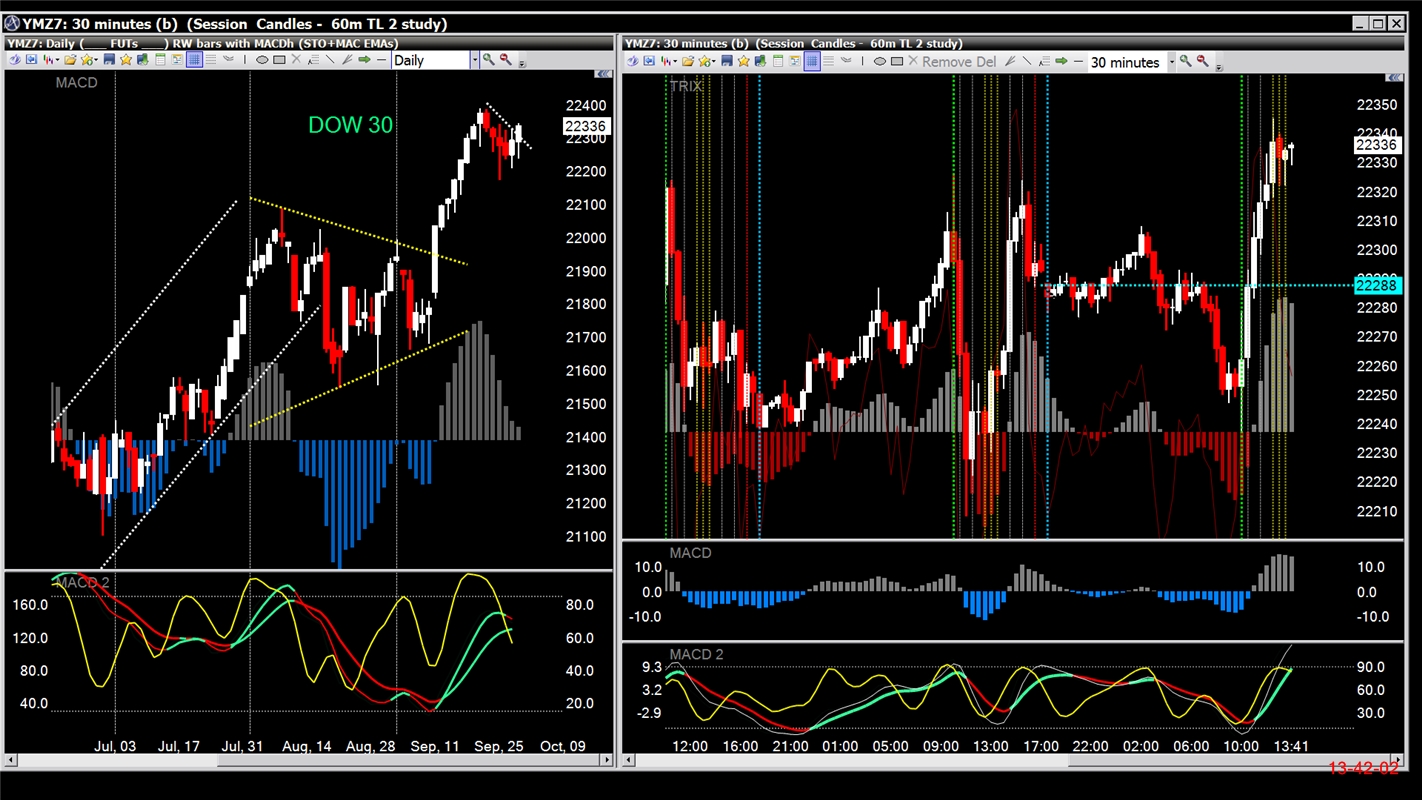
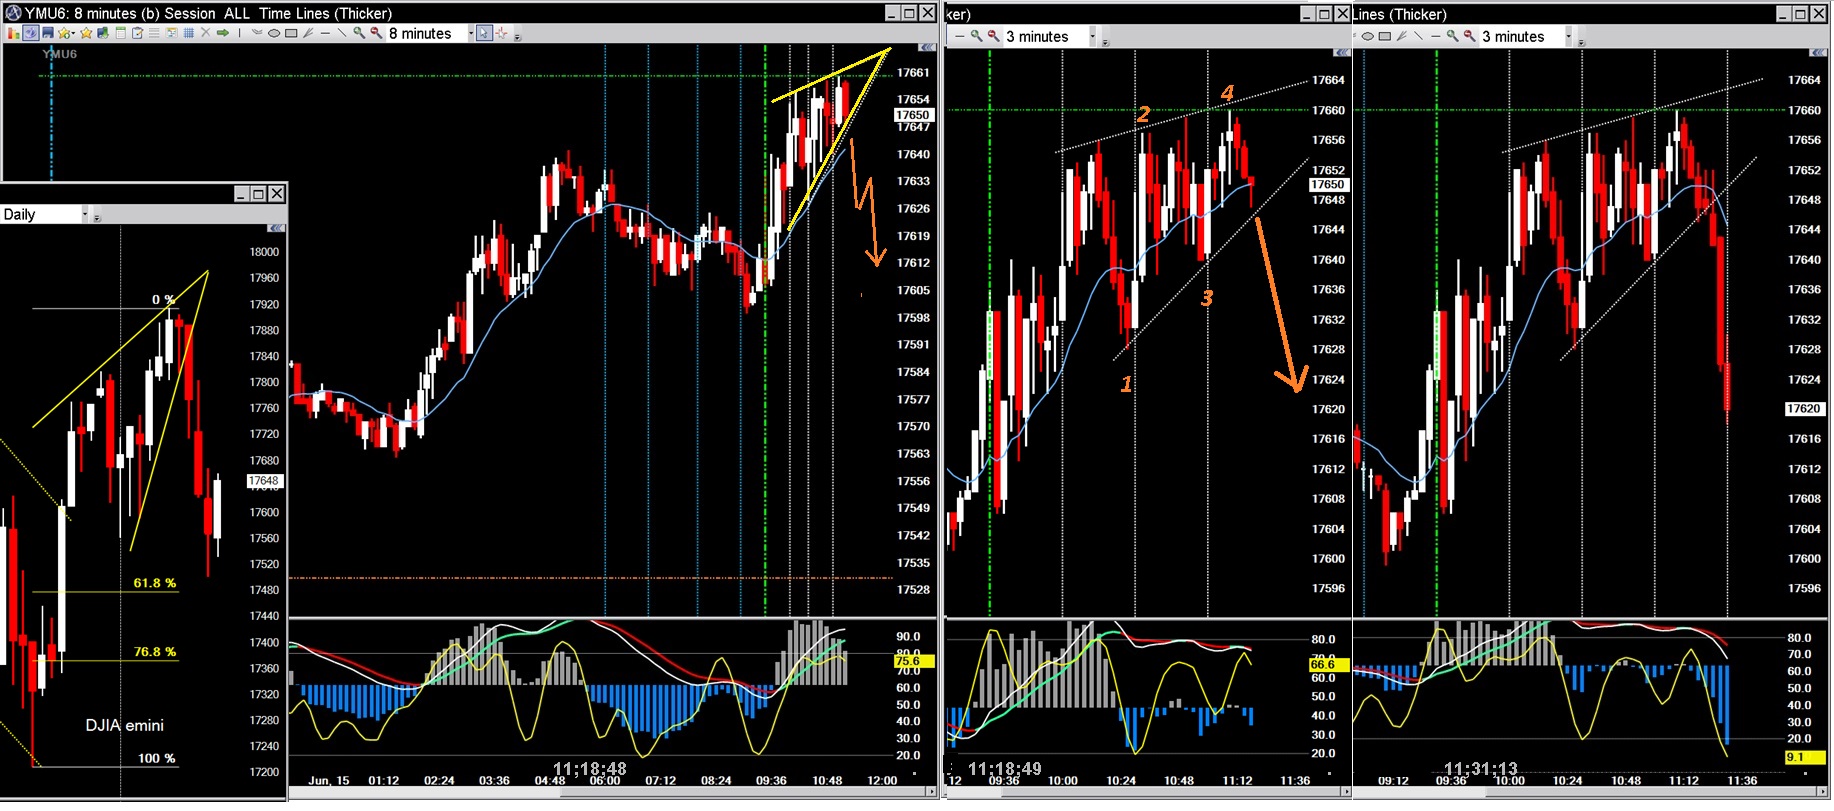
15 minute and 480 tick-per-barcandles
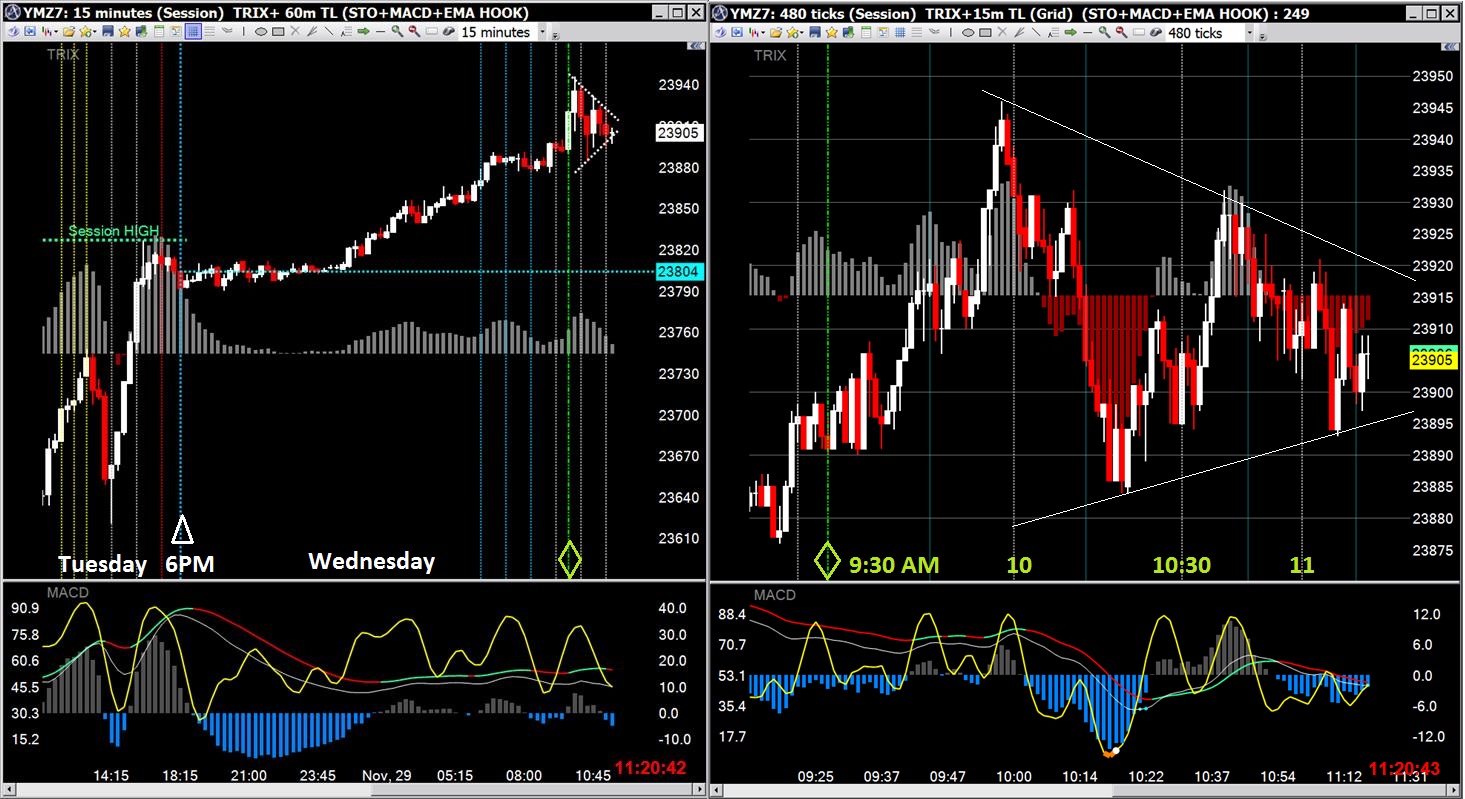
15 minute/single session and 30 minute 2 session
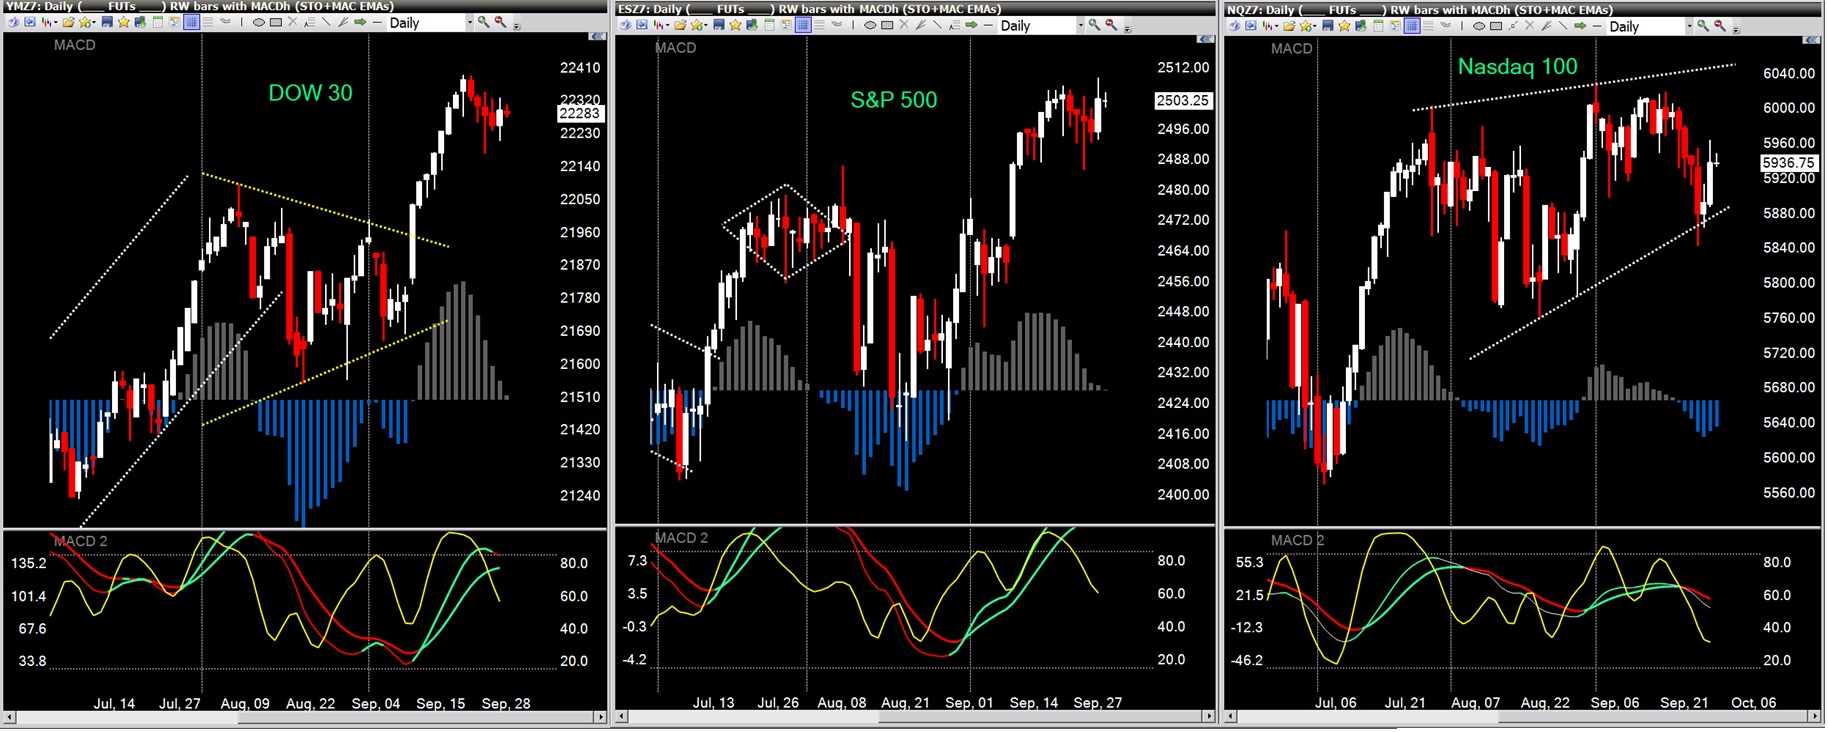
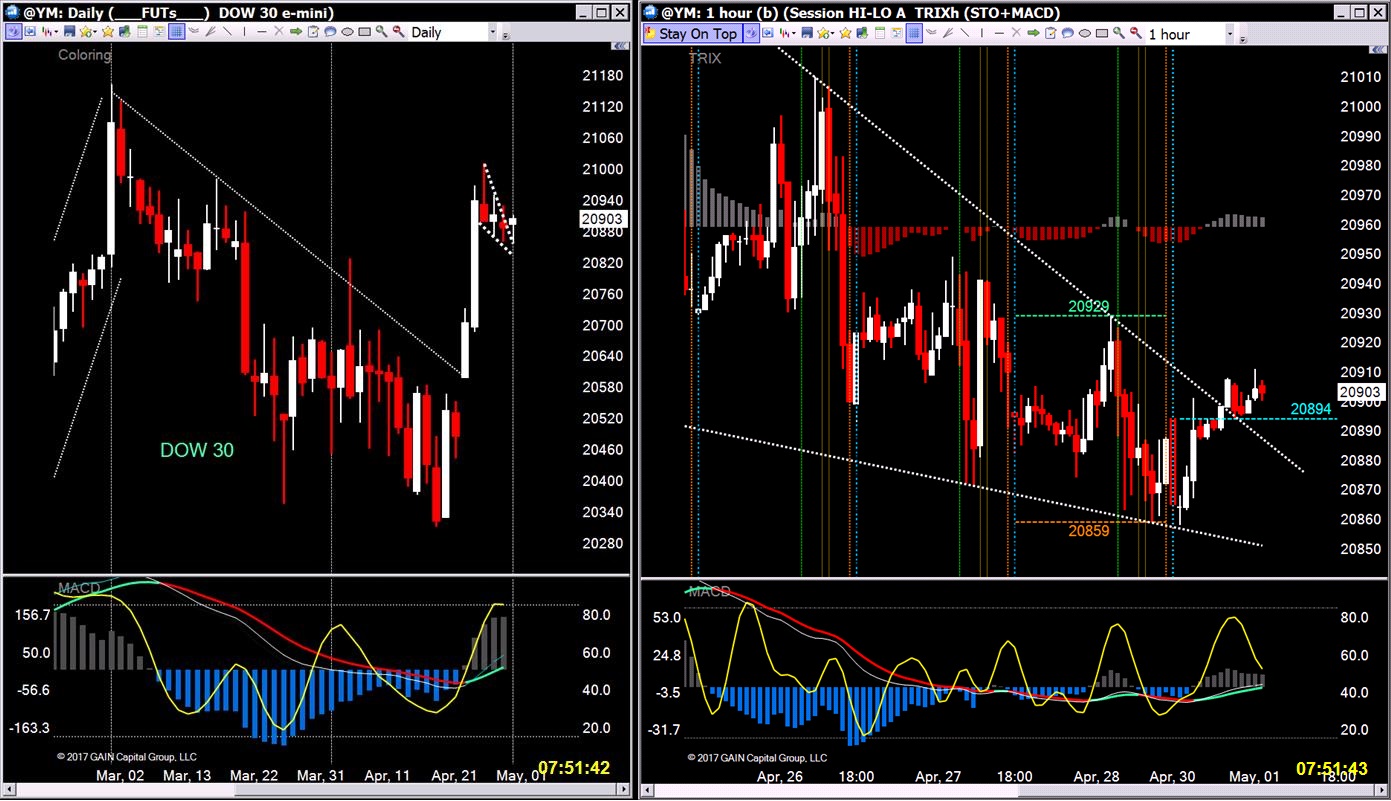
1 hour/5 session and daily
Seems price broke down this tme
The DJIA is now breaking out of its flag
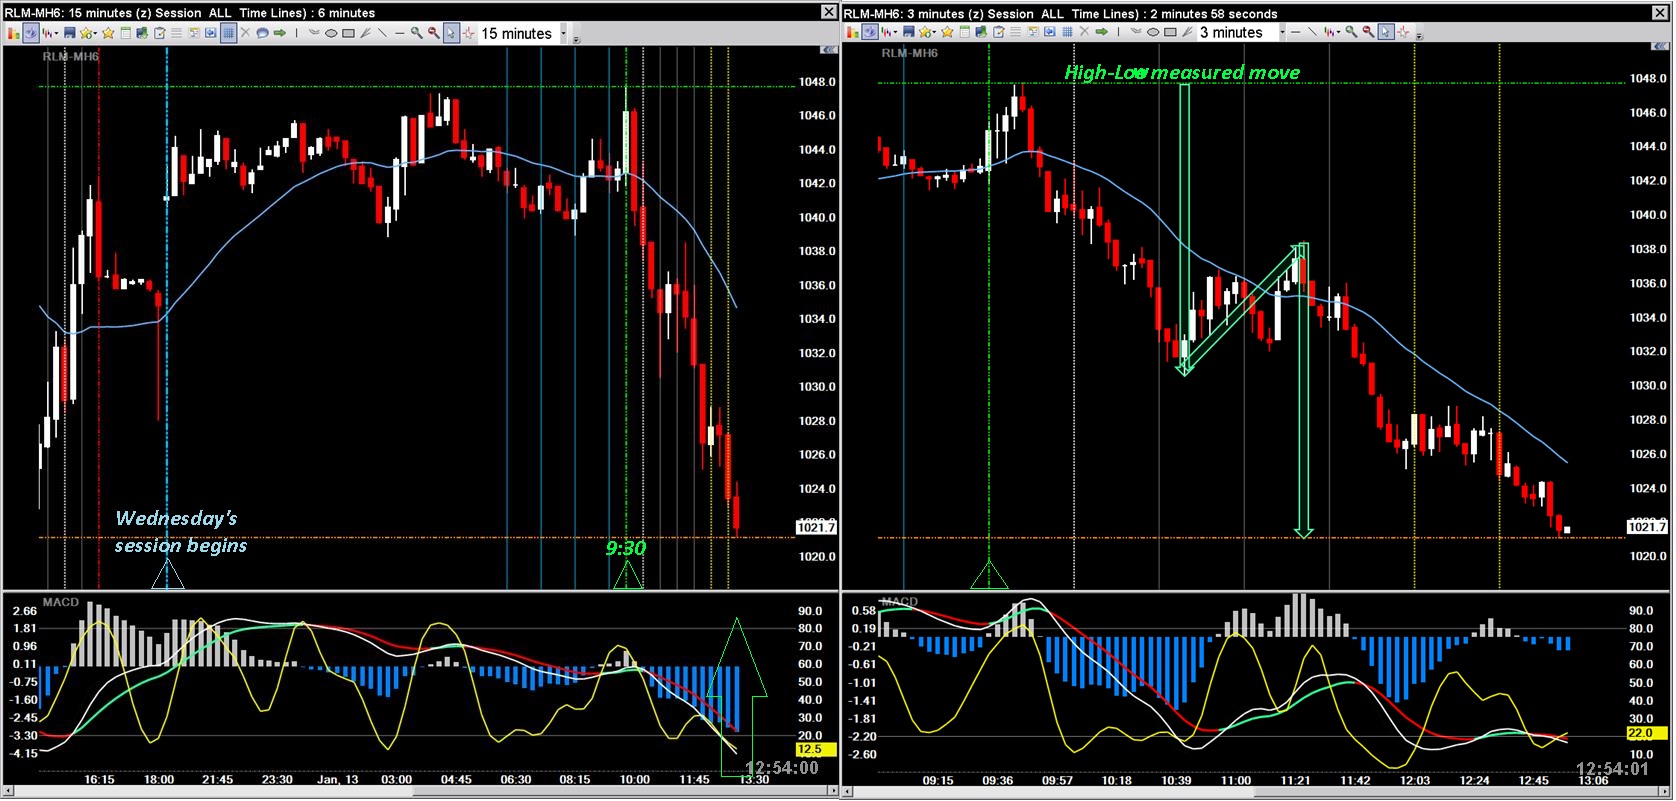
Not a 'perfect' measured move this morning but it did mark the reversal...
Breaking down, approaching a 'perfect' measured move

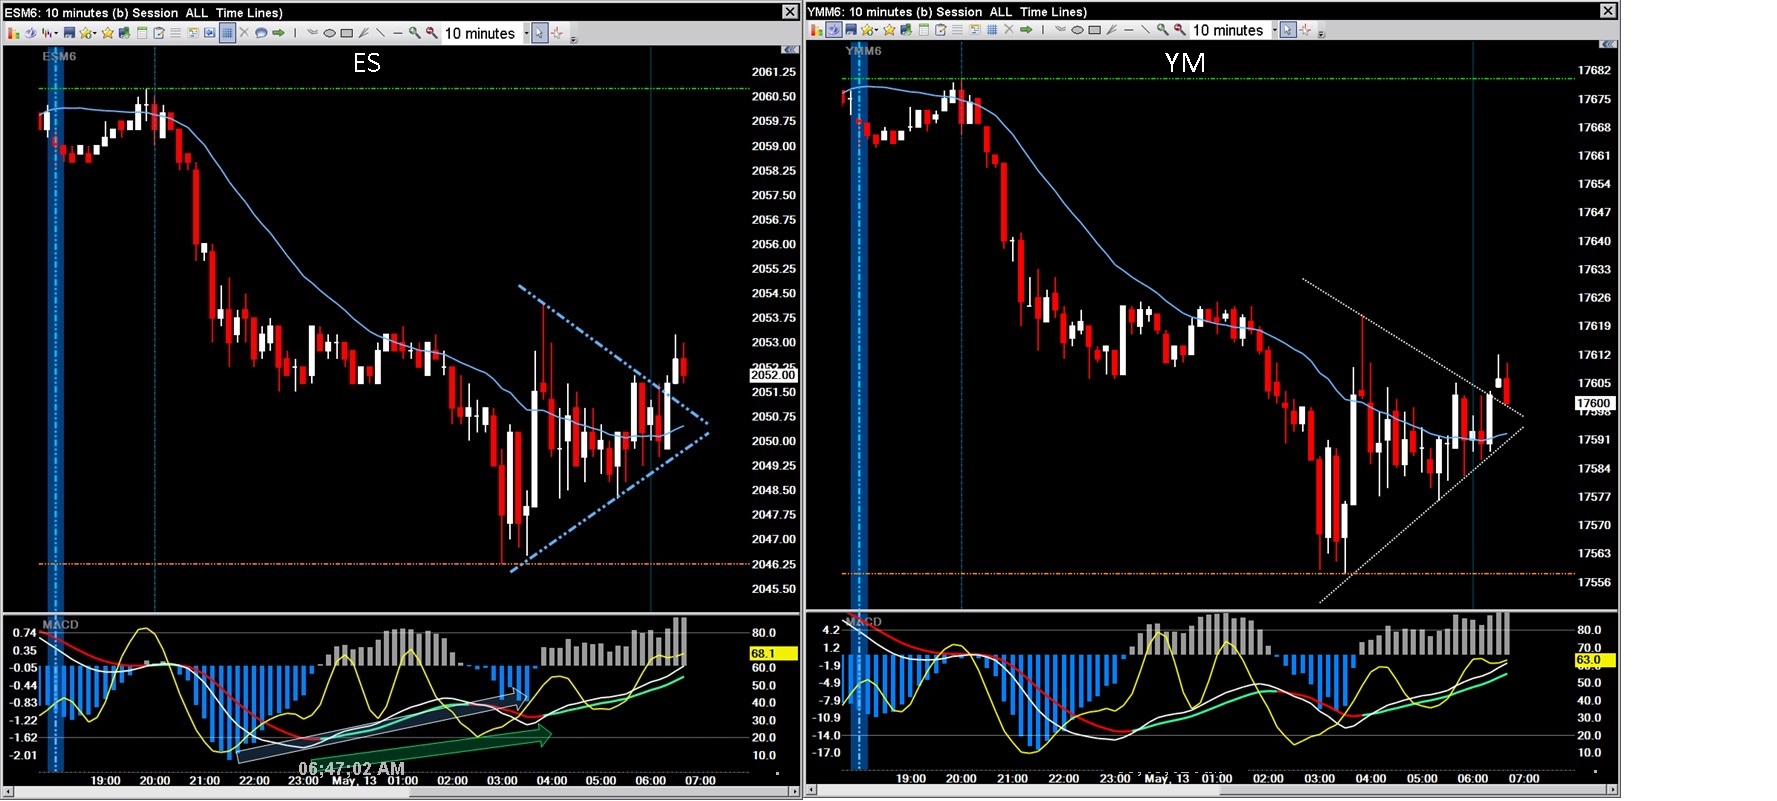
Reversal hints on the shorter time frames include indicator divergences and
bottoming MACD EMAs with momentum diminishing (EMAs turning up)
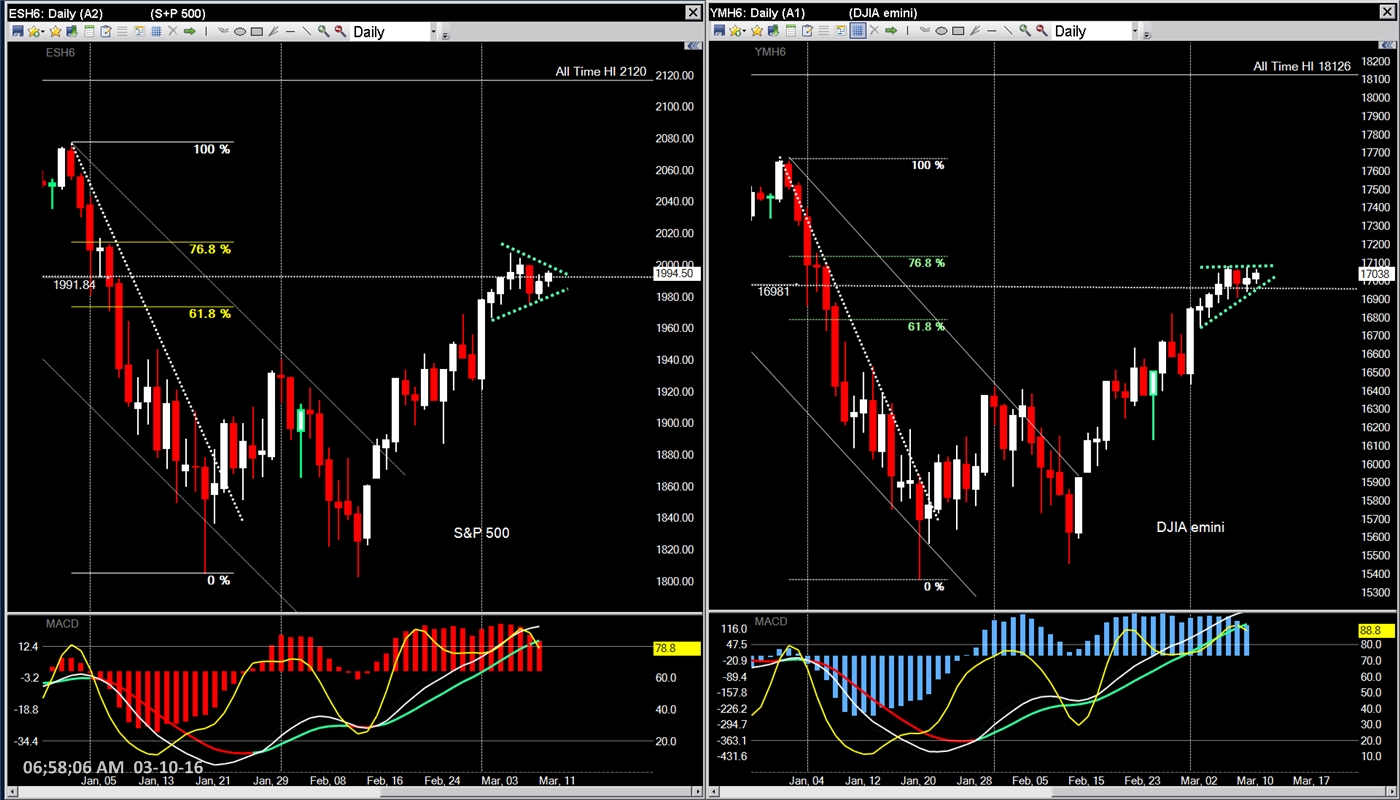
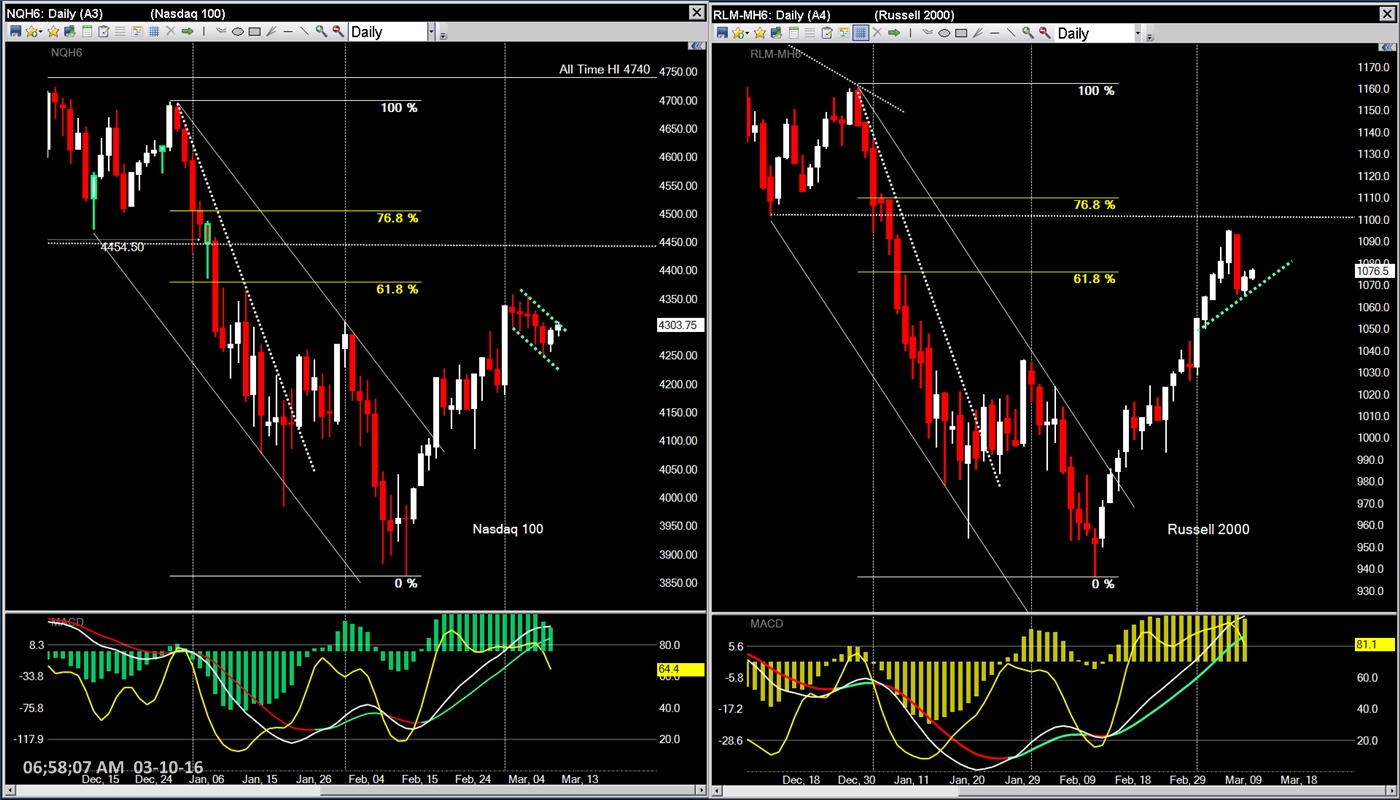
These things can go either way
Little bullish flags on the YM and ES dailies
sometimes they break down
was stalking for entry
took it -- signals don't guarantee a winner here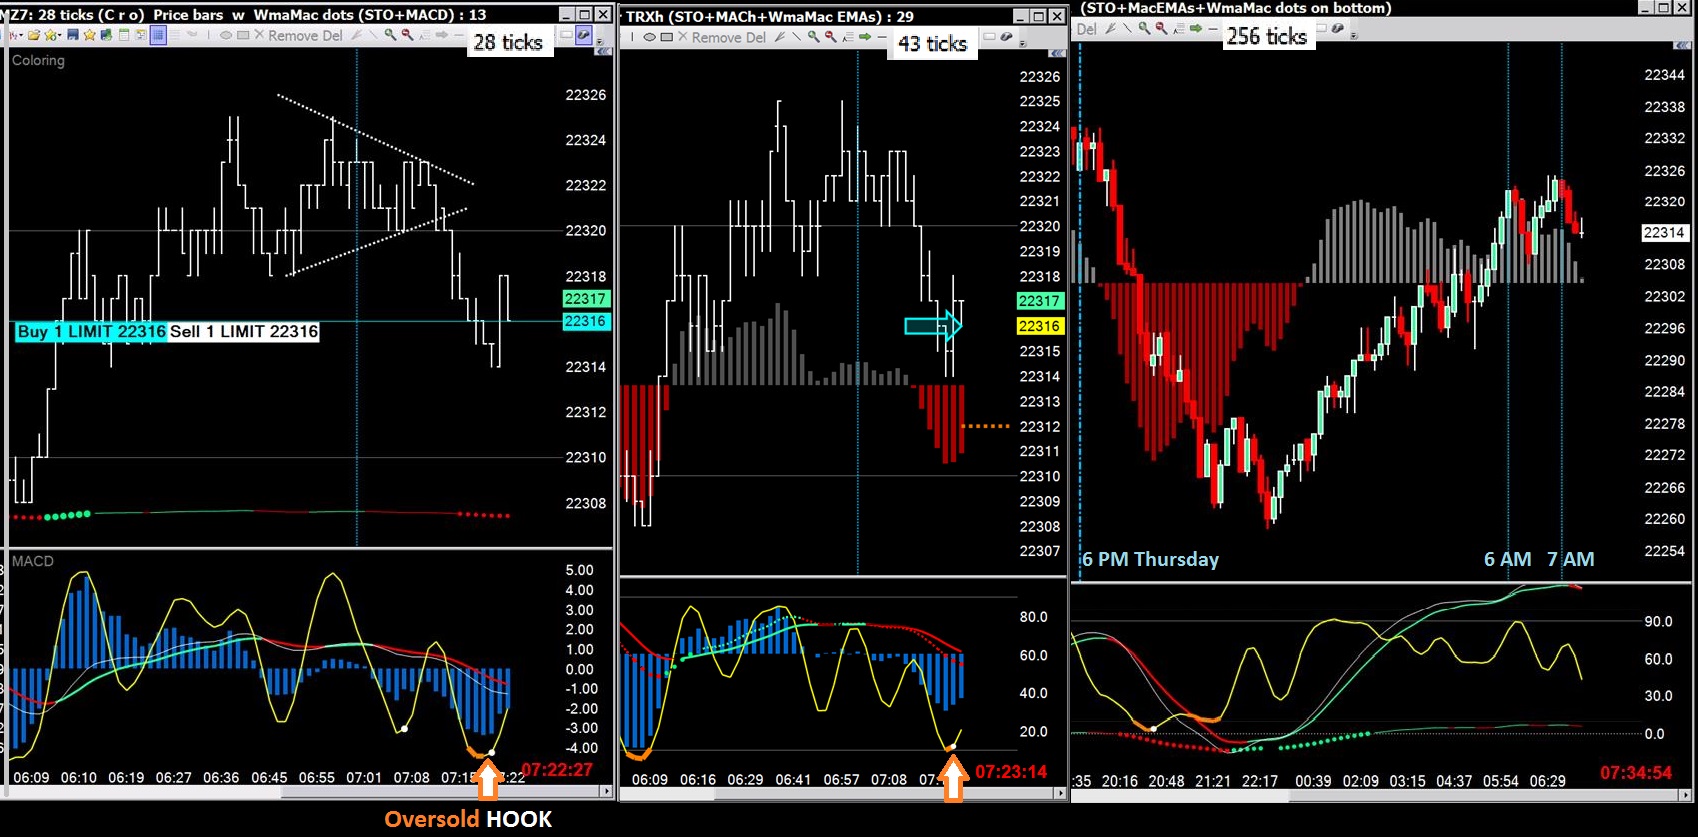
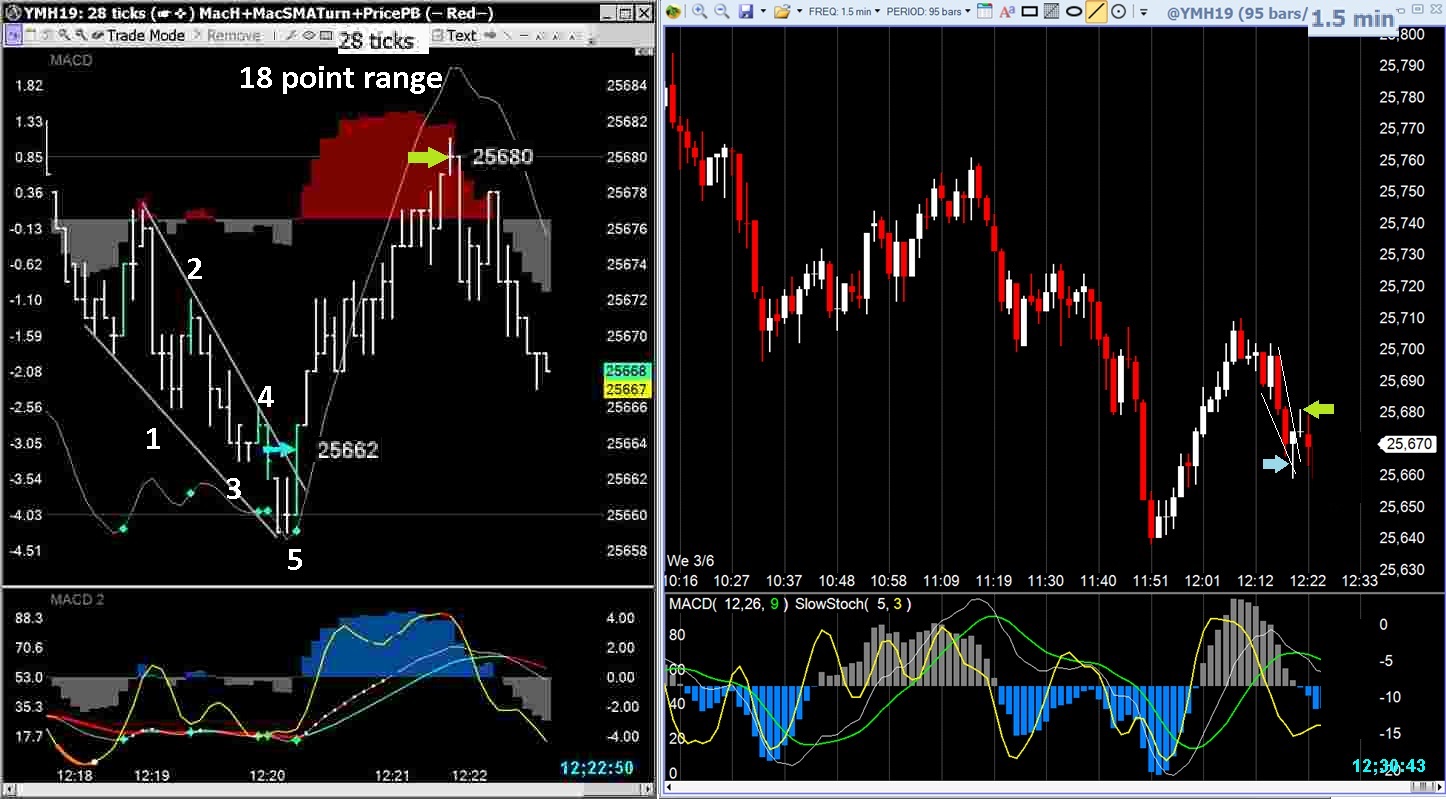
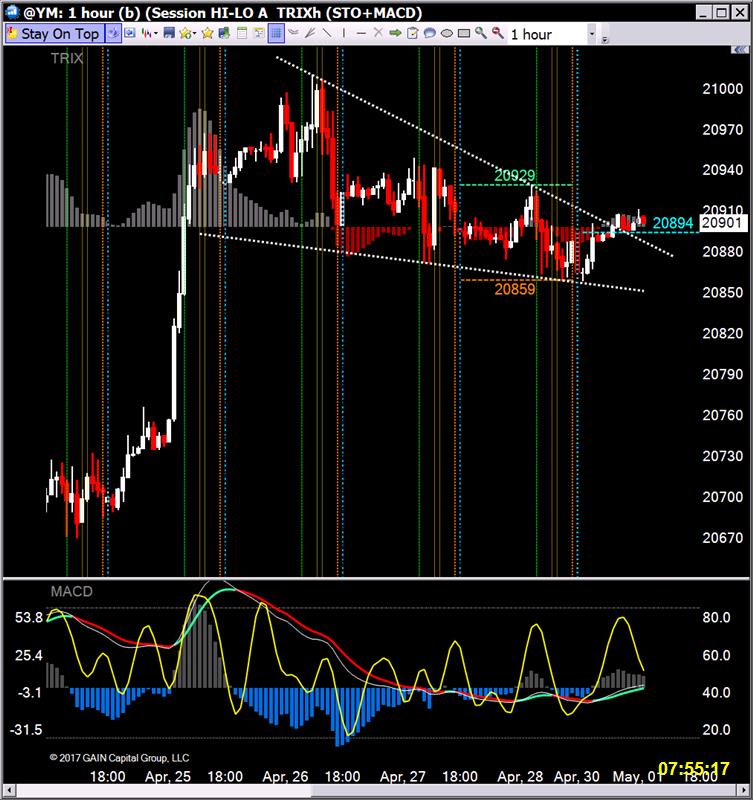
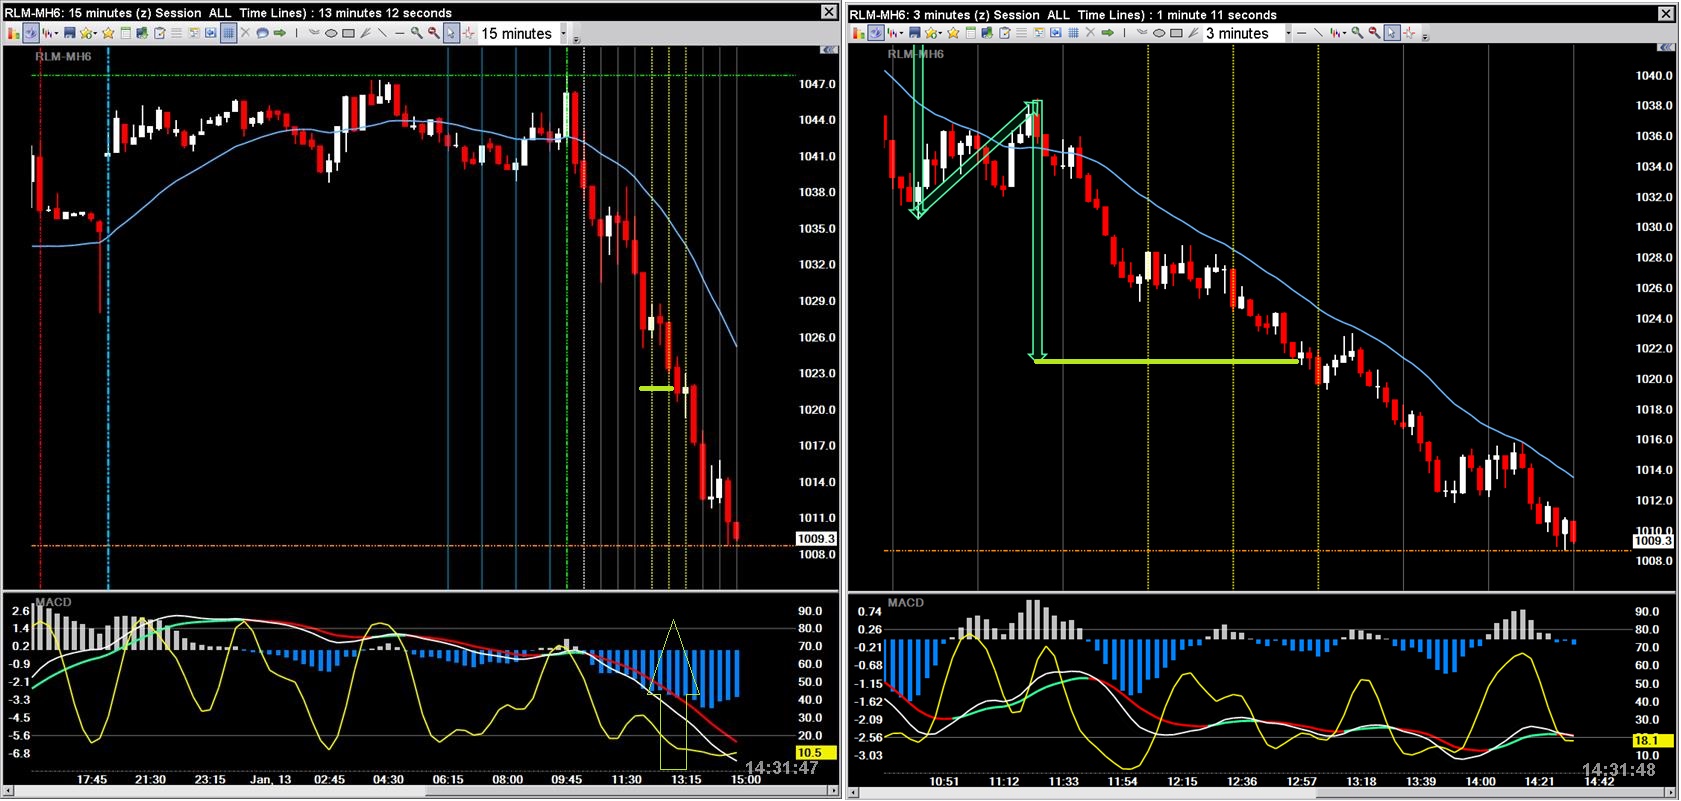
5 Wave ascending triangle ... bottoming reversal pattern
was pre-announced by the histogram divergences, propelled up by the MAC Trend Slingshots
while suggesting an initial target @20856 (the session open price).
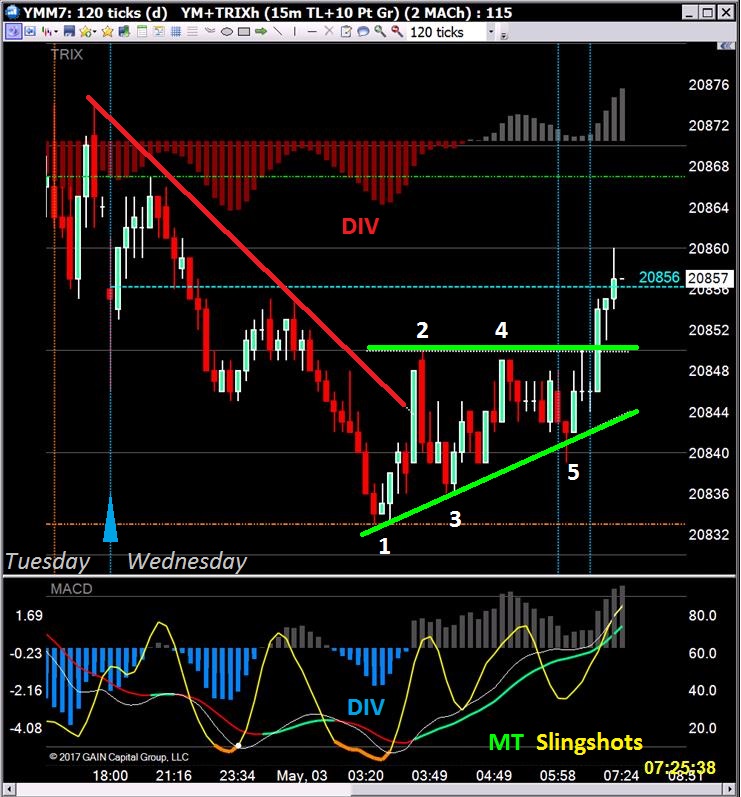
The ES and NQ also showing their versions...
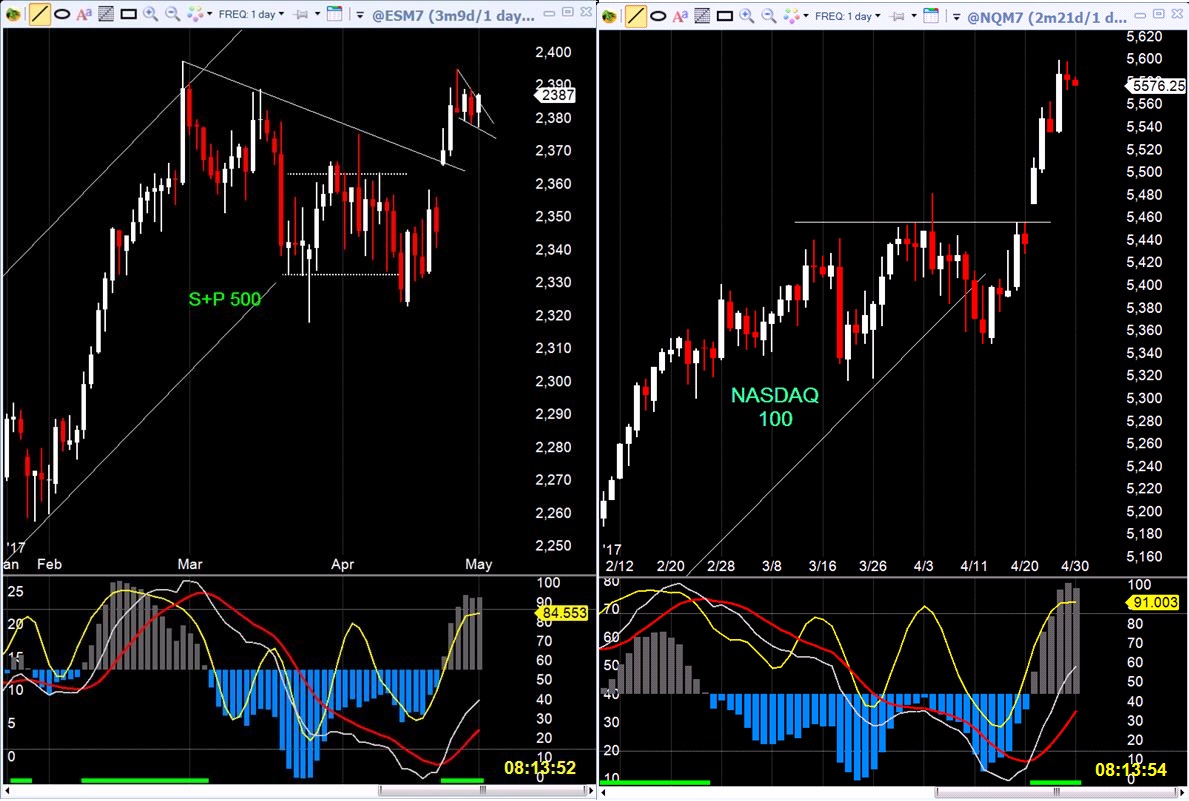
Nice little multi-Time-Frame flag on a pole
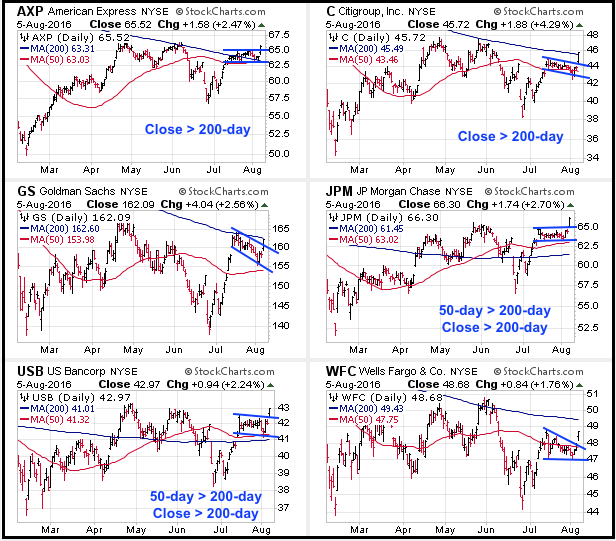
Financials flagging ... bullish breakouts
StockCharts.com ChartWatchers Newsletter
...chart set excerpted from Arthur Hill | August 06, 2016
Triangles, pennants, measured moves ... ya gotta love T/A when it's working...
_07-20-16_.JPG)
_07-20-16_.JPG)
and the NQ is just trending
_07-20-16_.JPG)
The old Pennant-on-a-pole after breaking a triangle trick
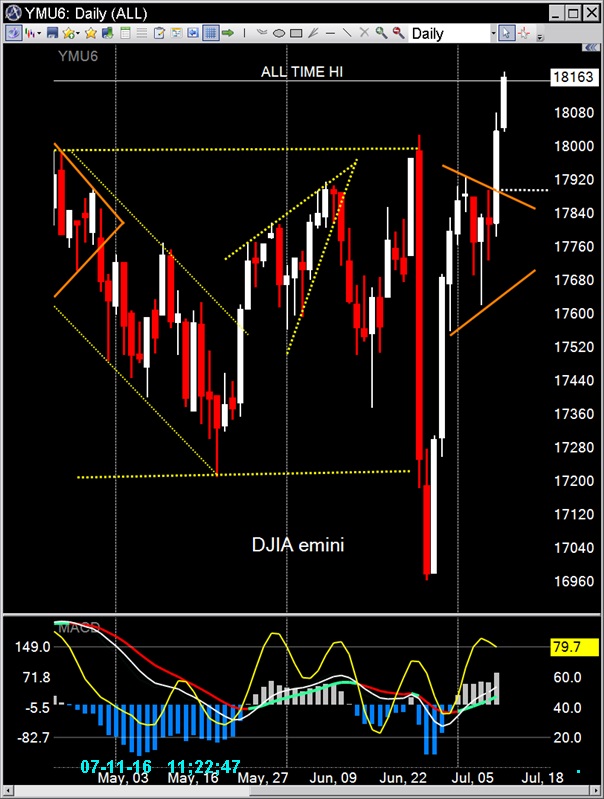
Pennant on a pole - continuation triangle.


Triangles are consolidation patterns - pausing to give the market time to absorb a previous move.
_07-11-16.jpg)
_07-11-16_.JPG)
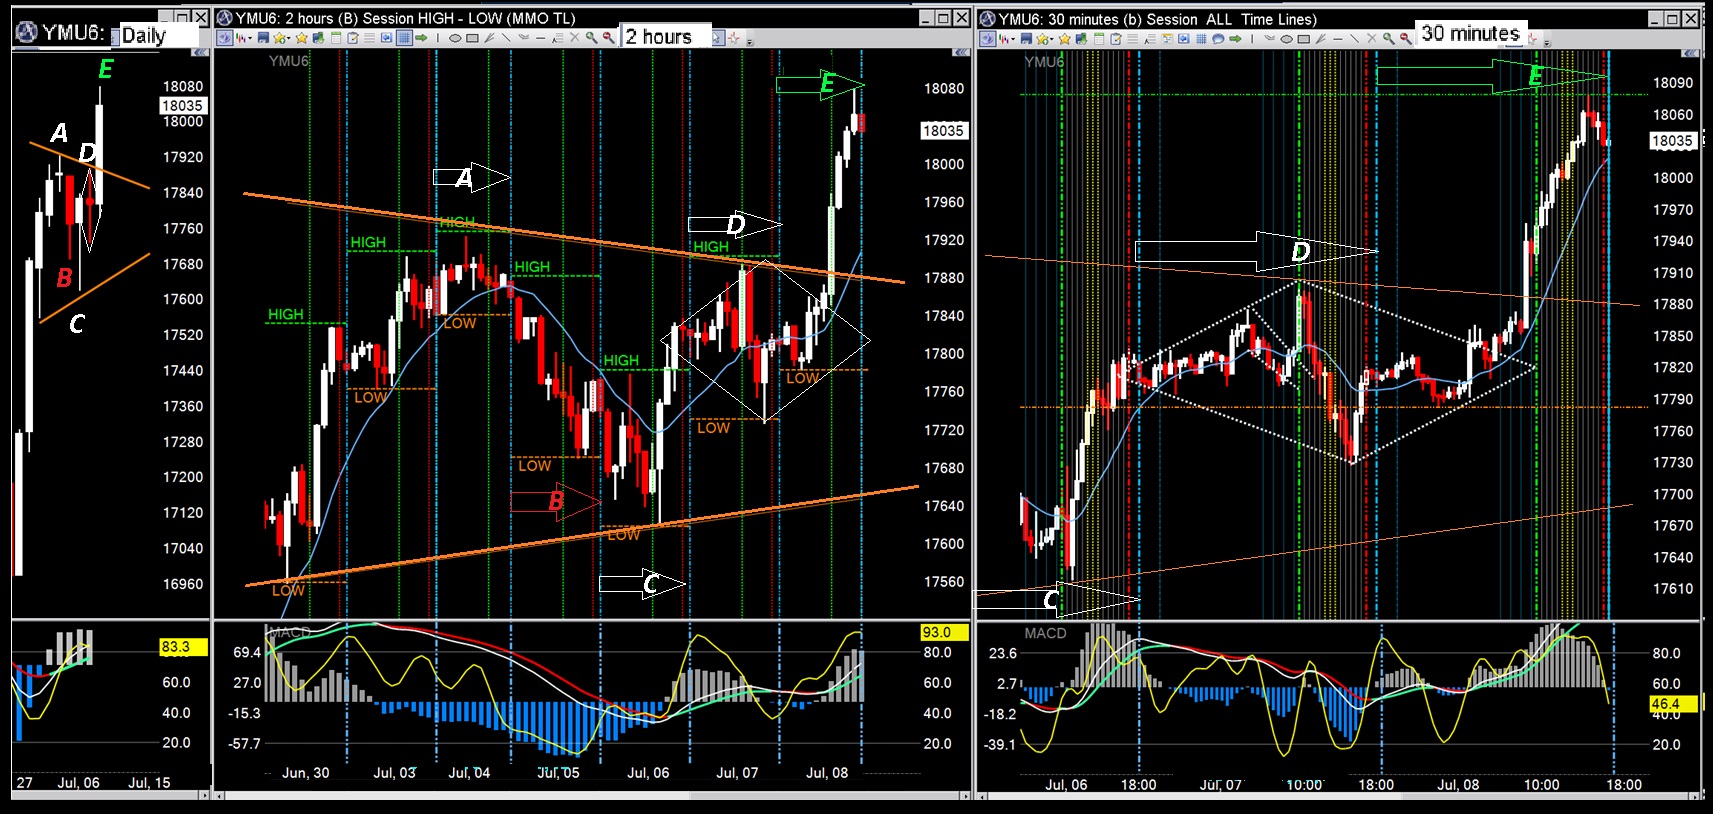
Doji, triangle and diamond patterns can go either-way.
(A) The triangle is defined by the doji top on Monday July 4th...
(B) followed by a wide range sell-off Tuesday...
(C) then a hammer reversal on Wednesday...
(D) To top it all off, a long tailed doji formed a nice indecisive diamond pattern on Thursday...
Shoula known - "It was the old triangular and diamond doji consolidation patterns trick..."
(a rare but well known 5 day continuation pattern)
Rising wedges are always bearish, declining bullish ...
Equilateral (horizontal) triangles can be either bullish or bearish ...
they generally break in the same direction of the immediate preceding trend.
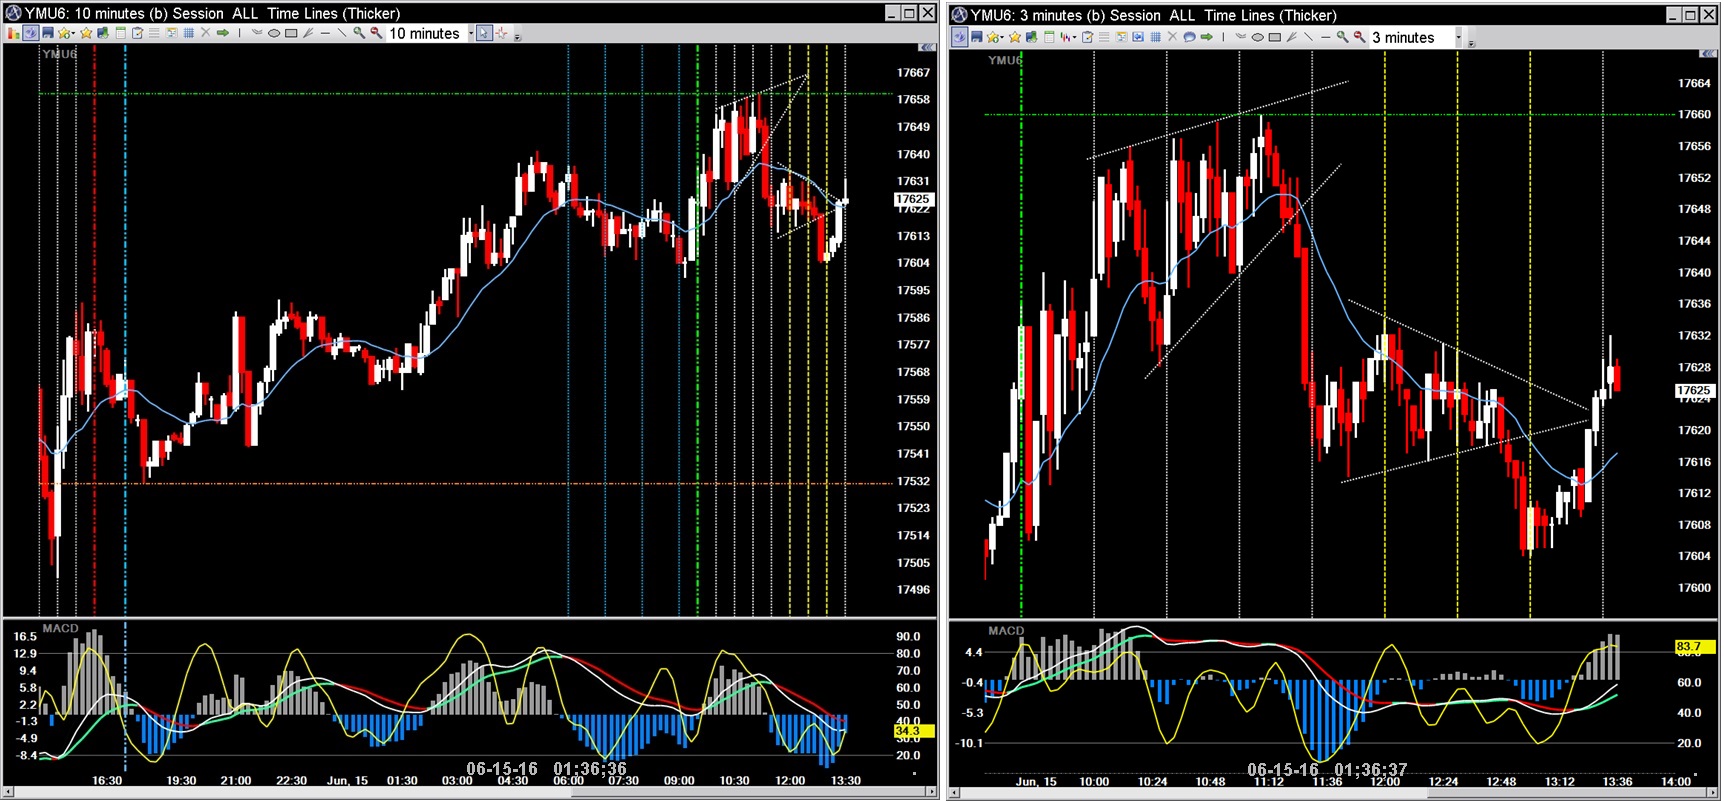
Rising Wedge - TIME or TICK based charts ... They are all bearish to me...
Declining wedge...flag on a pole...a pennant...
They are all bullish to me...TIME or TICK based charts

Another look at TLB Re-Tests

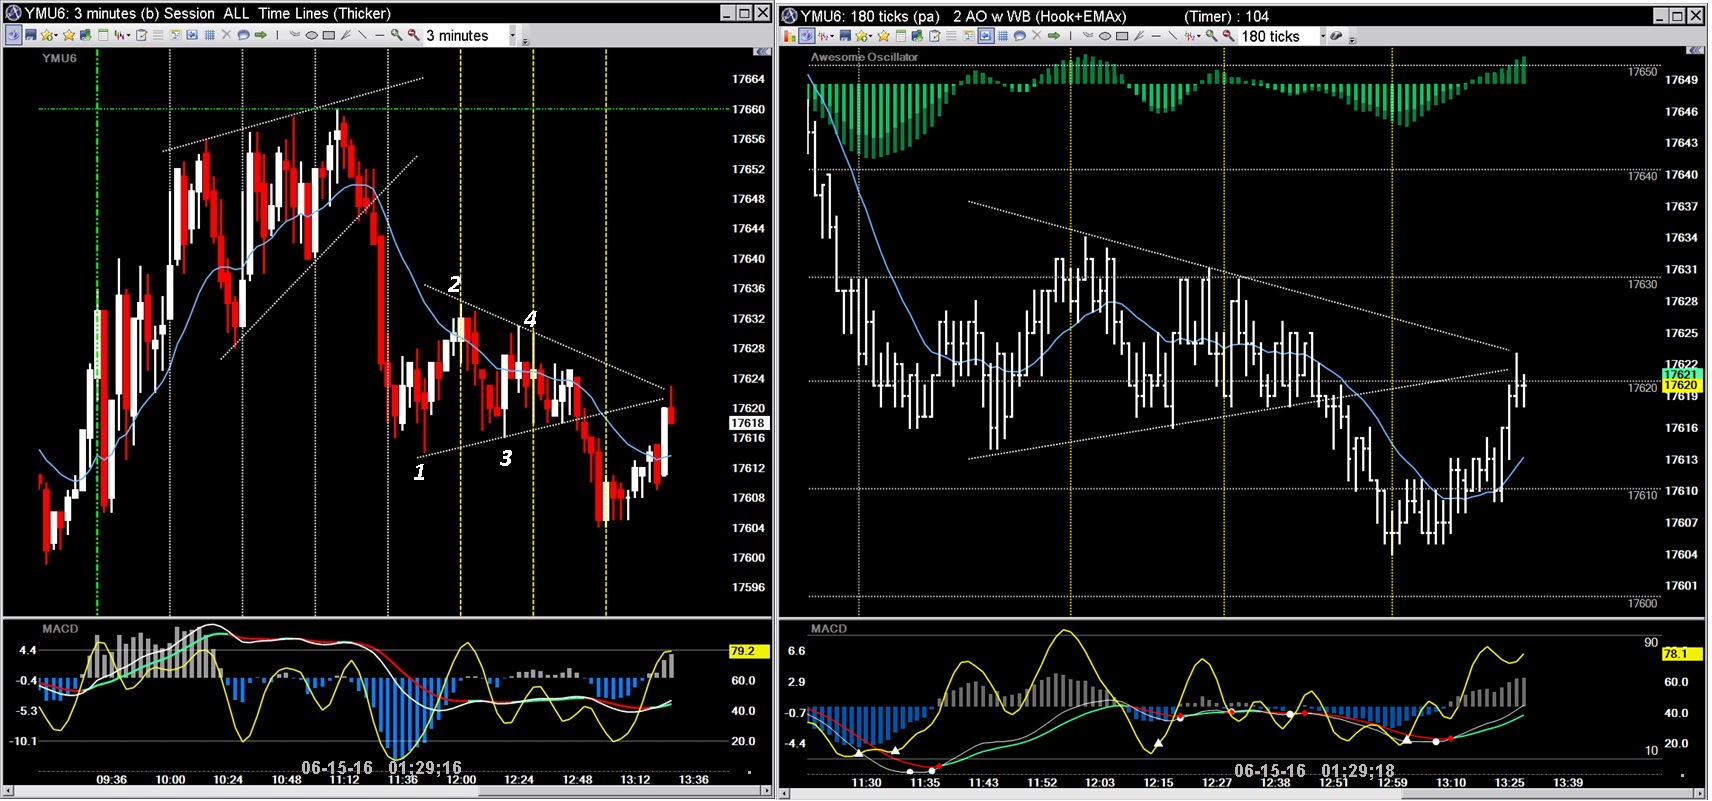
Trading triangle patterns - wait for a Re-Test
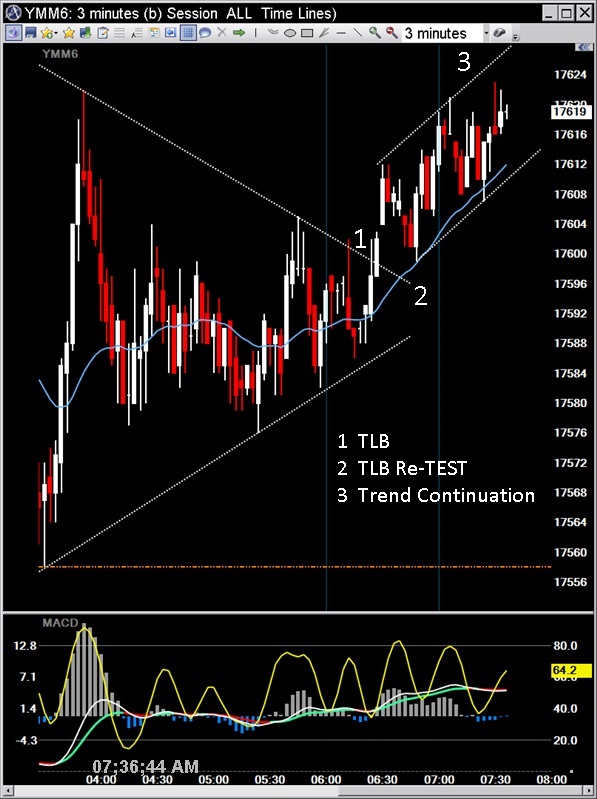
Typical price action of triangle consolidation patterns.
They do not infer a probable direction before they resolve.
Price is bounded by sloping upper and lower lines as it approaches the apex of the triange.
A 3 or 5 wave pattern most often can be ID'ed.

A breakout of either side will usually be re-tested before price continues
to move in the breakout direction...Use the re-test to anticipate a trade.
Down channel - 5-wave count for entry possibility...


Sometimes watching higher time frame charts will spark ideas for a trade...Sometimes this happens:

NR 7 patterns ... bullish set ups in the ES, YM and NQ sessions so far...
pennant, ascending triangle and flag respectively...
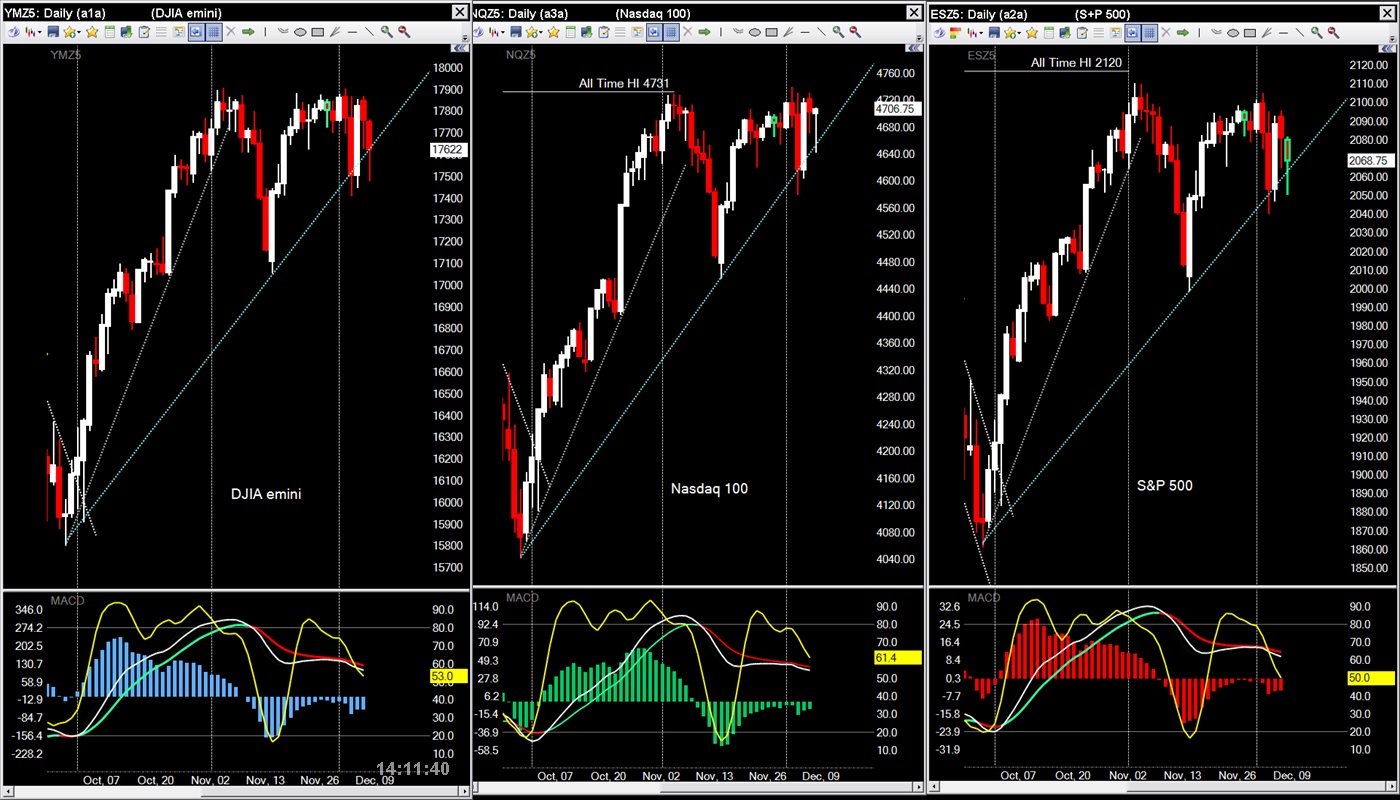
Not even close...
In general they will be very similar but there can be significant differences because the e-minis do expire every 3 months and get rolled over to the next 3-month period...prices get "adjusted" each time they roll-over...
Futures quotes also include the 24-hour prices - - of course the regular indices mostly close at 4 PM EST.
Also, when getting futures quotes from BigCharts, StochCharts, Yahoo etc they are "continuous contract" symbols (that are never actually traded).
These quotes will vary further away from the actual prices shown for the indices.
But, ALL quotes for the indices or for futures are adjusted by those who have the registered trade marks...they own the data but they let financial firms use the quotes and of course the trade mark owners get compensated by the users...brokers, financial firms, news firms as well as individual traders/investors all pay for data in some form or another.
Quite surprising how much the Futures ruler-lines differ from the.....regulars.....
*Noticed that last week
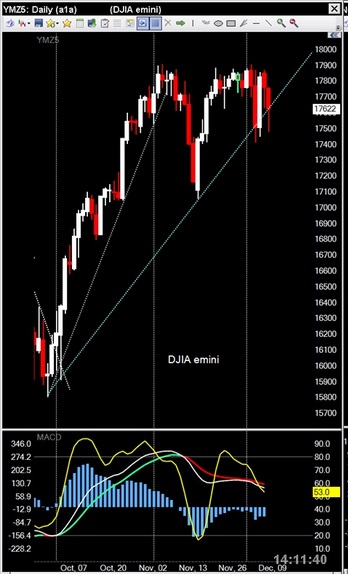
Oh wait.....
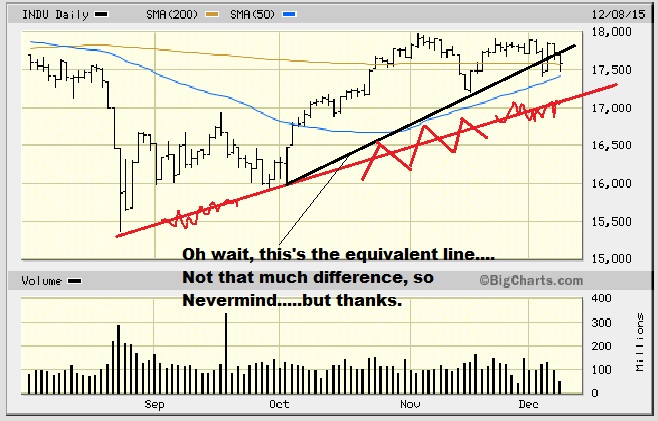
And yet, hmmm, maybe there IS quite a difference.....
Wonder why :
How come it's trading quite a bit below my line, but is not doing so in yours' ?....
.
Should one place more faith in the lines of Futures traders ?
Seein' as they might be a bit more experienced ?
.
Bulls putting up a fight...support at-the-up-trend lines
A nice measured move pattern on the RUT intrday

Created with Medved Trader instead of BigCharts---nowwhat2 ruler-line chart ...
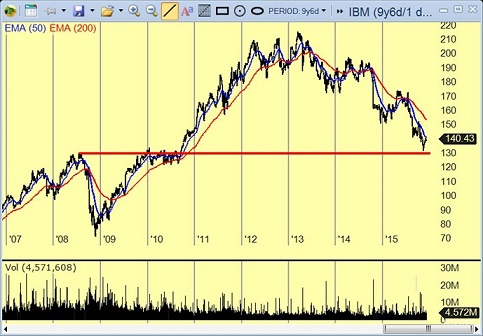
Watch IBM's 130 level
Sharpshorts added a 5-wave pattern ID
Static and Dynamic charts with BigCharts
By dynamic I assume you mean charts that update automatically without needing to refresh your browser.
Don't know if BigCharts has that available...I think StockCharts.com does but you have to pay a minor yearly membership fee to get "real-time".
Medved Trader (the new QuoteTracker chart program)
Download if here "http://forums.medvedtrader.com/forum/2-support/
It's free and you can use free yahoofinance for the live data fee, including automatic back-fill each time you start it - or you can just leave MT running all day...
You can configure MT's charts to look exactly like BigChart's if you want.
The only probelm is yahoofinances does not provide a live feed for most of the indices you follow.
IQfeed is a pay-fo-feed provider that works with MT and has the indices you use...
Here's a U-tube video on Medved Trader -
But, how to create both Static and Dynamic charts ?.....
For, that'd be great thing to know how to do !
D'ya know if it can be done using Bigcharts' charts ?
'Cause those're generally all I use.
All the best !
Quite the day today here huh ? ---- INDU up 362 (2.07 %) midday
Just like ya' say : "It's like yesterday never happened".
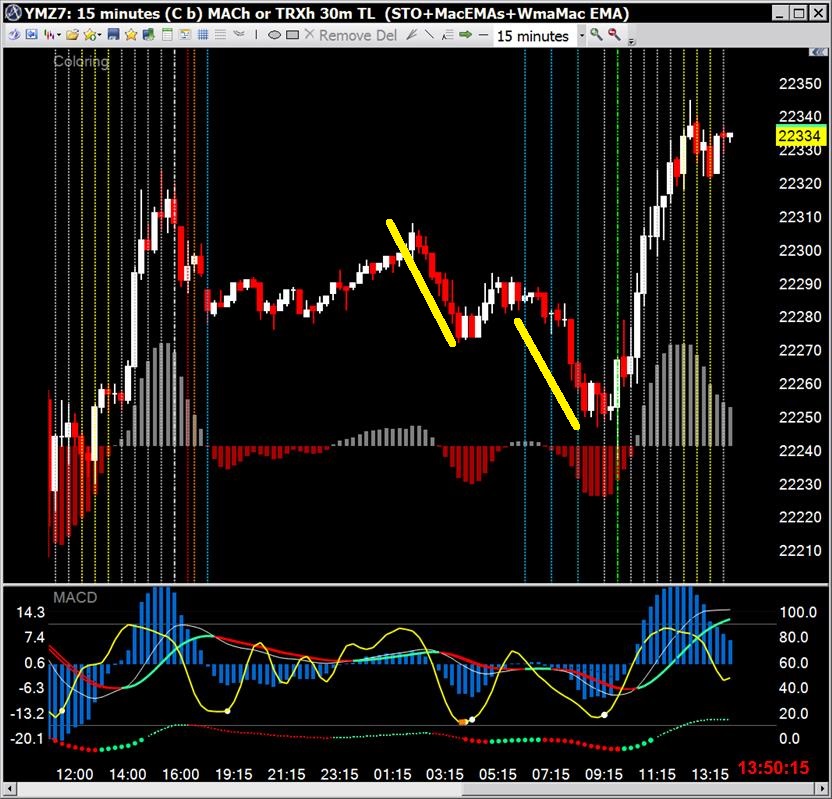
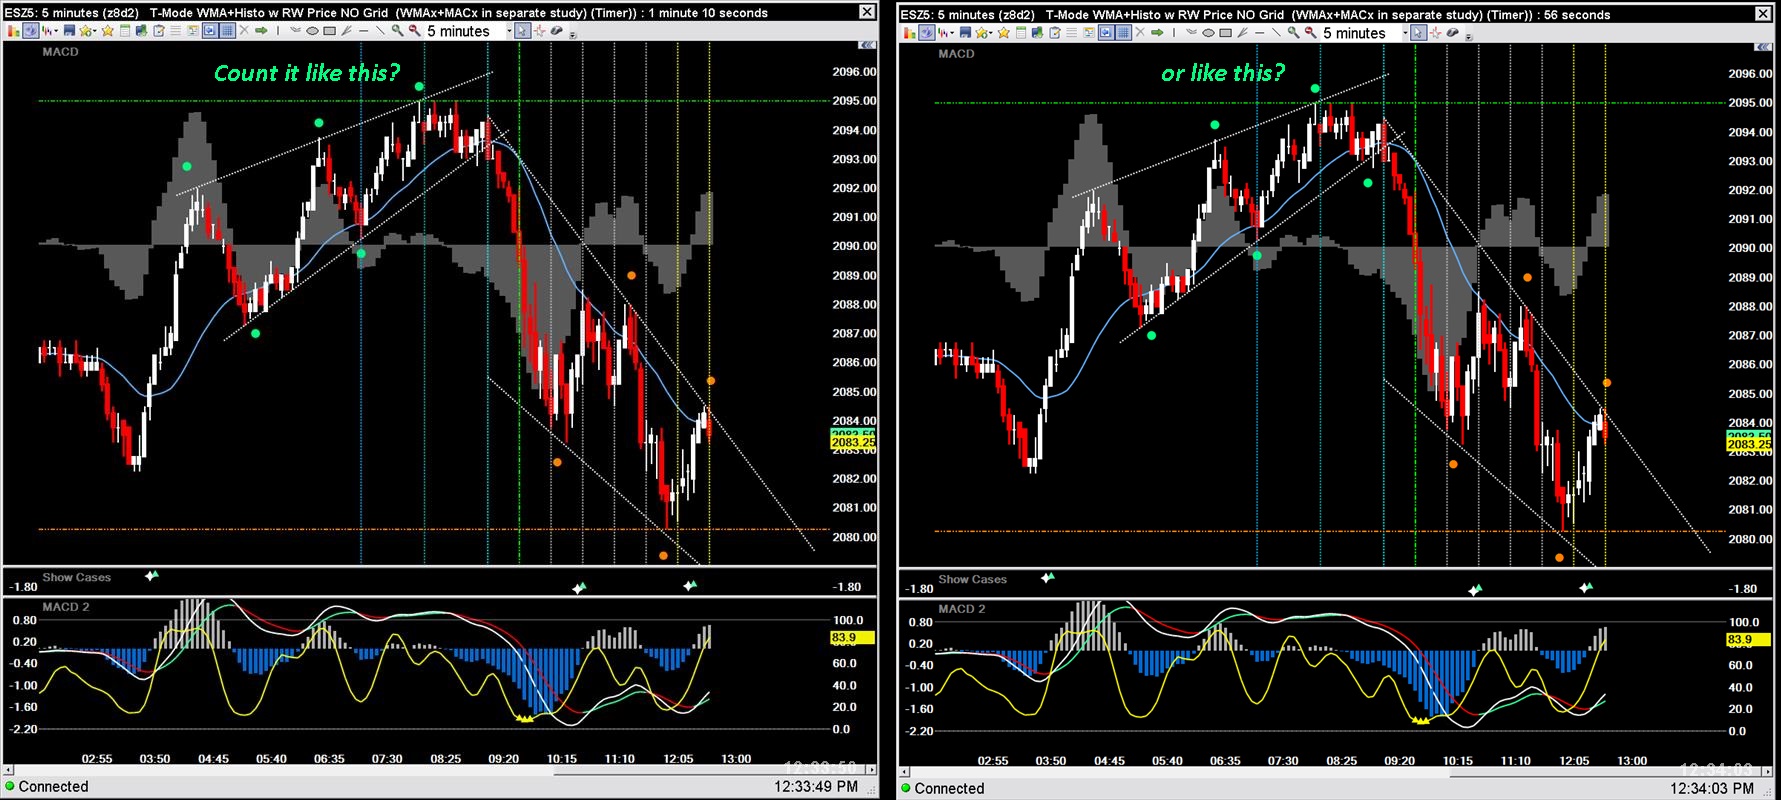
P/A wedges...How would you mark them?
I perfer the set on the LH chart...
Rising 5-wave wedges...HH,HL,HH,HL,HH...reverse
Falling 5-wave edges...LL,LH,LL,LH,LL...reverse
As always, there are bullish and bearish technicals to consider.
5 wave rising wedge, rounded top and a triple top in a channel...bearish
A 'Bat-Wing' continuation of trend pattern...bullish

|
Followers
|
6
|
Posters
|
|
|
Posts (Today)
|
0
|
Posts (Total)
|
196
|
|
Created
|
02/15/12
|
Type
|
Free
|
| Moderator sharpshorts | |||
| Assistants | |||

|
|
| Volume | |
| Day Range: | |
| Bid Price | |
| Ask Price | |
| Last Trade Time: |