thank you. question-- how does one find stocks that are poised to cross? Again, thank you so much, this is an incredibly useful post. I can't wait to try it.
OT: Just a note about "smarty" traders. Don't mean to put anyone down. I wrote that in reference to myself, and it's a bad habit--making gutsy, fast technical trades. I will continue to make short-term technical trades where I see a high-probability opportunity. The thing is this: I can earn more far easier and with better physical health by finding the flow of the market.
The far better way to trade and invest is to surrender to the life of the market--and that means owning positions that are above the jugular vein, the 20-day ma, when it is up-sloping. As a long-term investor, it might mean owning positions that are above the 50-day ma or the 200-day.
The market is holographic, and what is true of the 20-day ma is true of the 200-day ma.
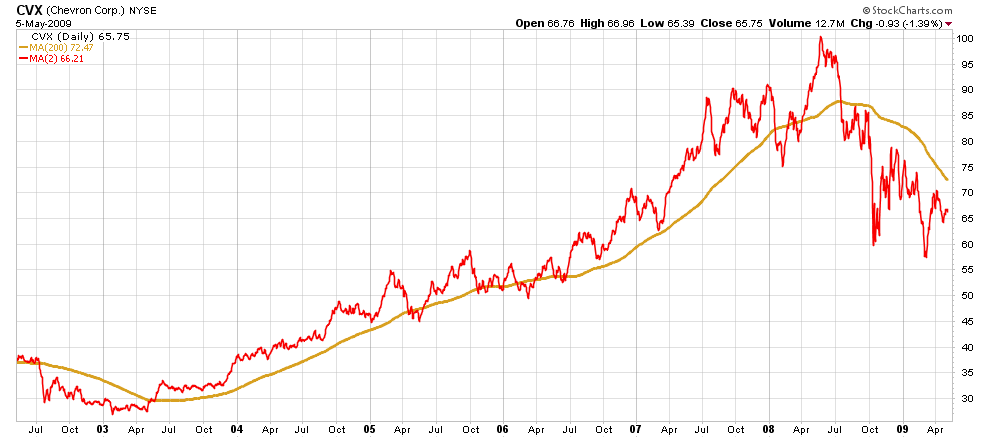
CVX is a good demonstration of the 200-day model. The following chart doesn't have candlesticks or volume or stochastics--not even an MACD. We can't tell the fundamentals, but one thing is certain. The wave in the following chart is bigger than anyone. Wall Street can influence what happens and the Government can make decisions that will crater the market. But rarely does that happen overnight (maybe tonight based on the futures), but in general, here's a pattern you can bank on. I love this chart.
It was a beauty until it caught the flu in early 2008, and then you can just see its death coming in the summer of 2008. I watched it one day at a time, held on until the last minute to a position purchased in 2003, giving the stock and the market every chance to recover. Sold at $86 a share.
 News
News  Market Data
  Discover