InvestorsHub Logo

nowwhat2

03/22/22 11:31 PM

#95 RE: Lowjack #94

No idea - It's like......uh -

Just TRY and find a proper long term chart


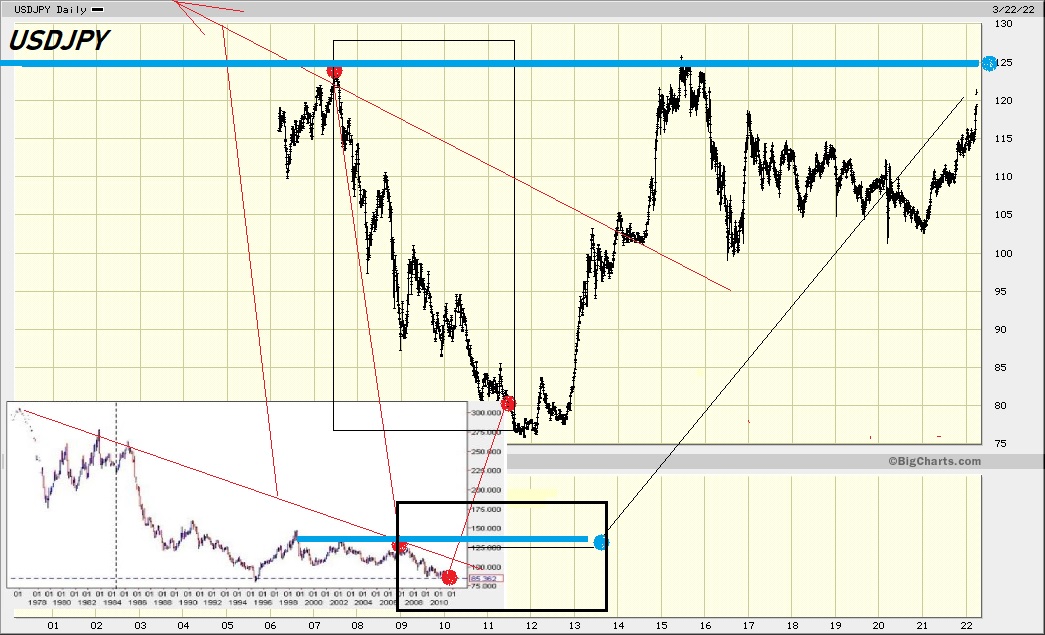
Judging from this "work" it seems to be saying that anything over 125 is/would be a 25yr breakout (ie break DOWN of the USD), which, seems to be in line with what gold's doing now ?


Seems "Treasure Maps" can be hard to find.....
for some peculiar reason


Or perhaps it just simply takes a while to find 'em


Written in 2010 (LoL)
https://seekingalpha.com/article/218501-25-years-of-decline-for-the-u-s-dollar-vs-the-japanese-yen


https://www.google.ca/search?q=usdjpy+1980&sxsrf=APq-WBs_Rb_G7TAQksWQJZGN3tWTjBUegQ:1648005163672&source=lnms&tbm=isch&sa=X&ved=2ahUKEwi1mvnSodv2AhVSEzQIHXd0D_QQ_AUoAnoECAEQBA&biw=1280&bih=577&dpr=1.5


https://www.tradingview.com/chart/USDJPY/TOM4sQU8-USDJPY-1M-very-very-long-term-goal/


Last is best one I could find


= this one ; Looks like the move above 110 this yr was a breakout