


Just TRY and find a proper long term chart
Judging from this "work" it seems to be saying that anything over 125 is/would be a 25yr breakout (ie break DOWN of the USD), which, seems to be in line with what gold's doing now ?
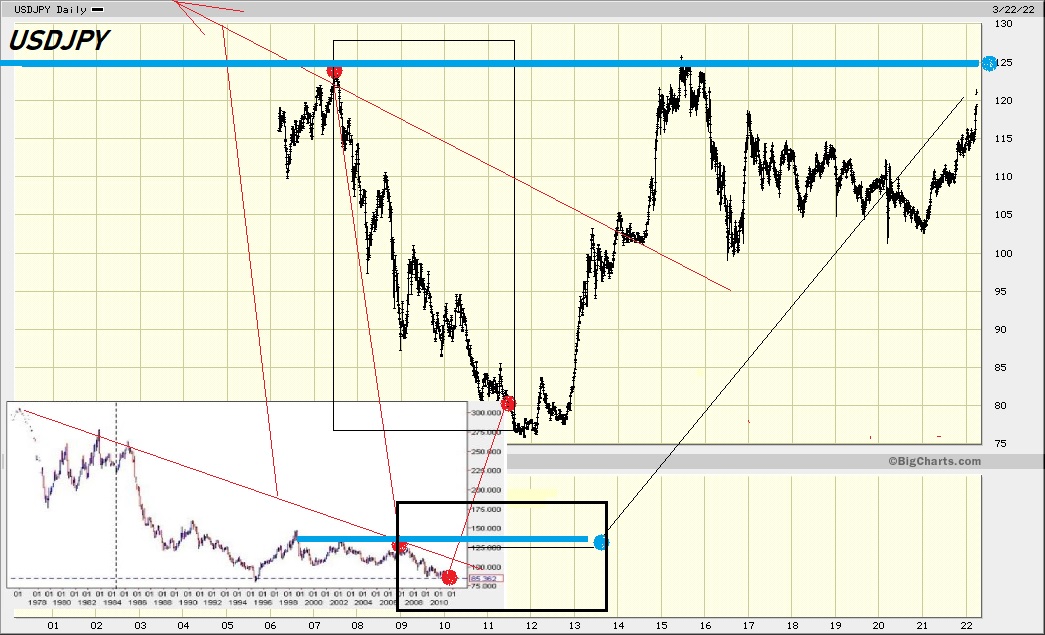
Seems "Treasure Maps" can be hard to find.....for some peculiar reason
Or perhaps it just simply takes a while to find 'em
Written in 2010 (LoL)
https://seekingalpha.com/article/218501-25-years-of-decline-for-the-u-s-dollar-vs-the-japanese-yen
https://www.google.ca/search?q=usdjpy+1980&sxsrf=APq-WBs_Rb_G7TAQksWQJZGN3tWTjBUegQ:1648005163672&source=lnms&tbm=isch&sa=X&ved=2ahUKEwi1mvnSodv2AhVSEzQIHXd0D_QQ_AUoAnoECAEQBA&biw=1280&bih=577&dpr=1.5
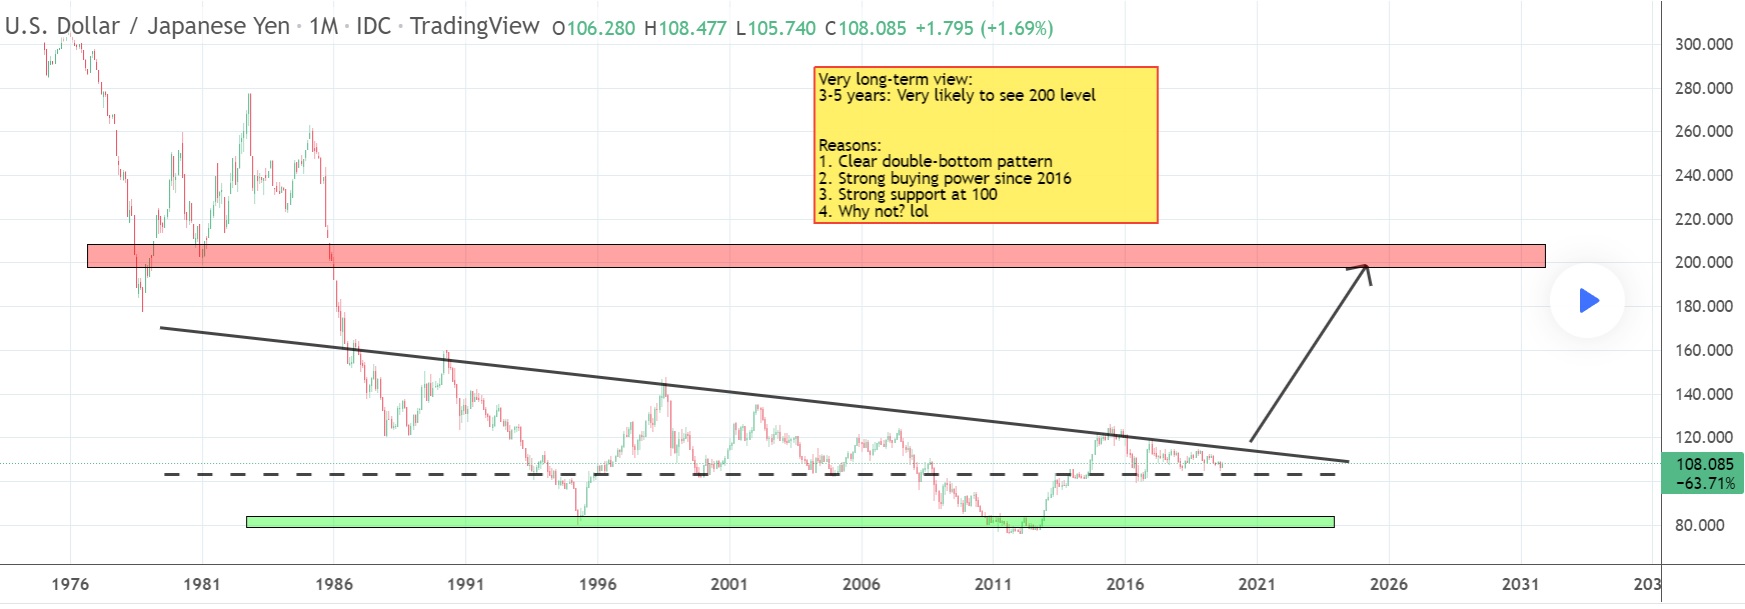
https://www.tradingview.com/chart/USDJPY/TOM4sQU8-USDJPY-1M-very-very-long-term-goal/
Last is best one I could find
= this one ; Looks like the move above 110 this yr was a breakout
Recent USDCAD News
- U.S. Dollar Drops As Powell Signals Progress On Softening Of Price Pressures • RTTF2 • 07/02/2024 12:52:21 PM
- Canadian Dollar Drops Against Most Majors • RTTF2 • 07/02/2024 02:58:18 AM
- Canadian Dollar Edges Down To 117.50 Against Yen • RTTF2 • 07/02/2024 12:39:42 AM
- European Economic News Preview: Eurozone Flash Inflation Data Due • RTTF2 • 07/02/2024 12:30:20 AM
- U.S. Dollar Climbs Before Powell's Speech • RTTF2 • 07/01/2024 02:08:59 PM
- U.S. Dollar Slides After PCE Inflation Data • RTTF2 • 06/28/2024 10:57:59 AM
- German Unemployment Rises More Than Forecast • RTTF2 • 06/28/2024 10:56:28 AM
- U.S. Dollar Firms Ahead Of U.S. Core PCE Inflation Data • RTTF2 • 06/28/2024 05:43:30 AM
- U.S. Dollar Rises Against Majors • RTTF2 • 06/28/2024 04:05:17 AM
- U.S. Dollar Lower Ahead Of Inflation Data • RTTF2 • 06/27/2024 12:33:29 PM
- U.S. Dollar Higher On Fed Remarks • RTTF2 • 06/26/2024 01:06:10 PM
- Pound Rises Against Majors • RTTF2 • 06/25/2024 05:57:30 AM
FEATURED BNCM and DELEX Healthcare Group Announce Strategic Merger to Drive Expansion and Growth • Jul 2, 2024 7:19 AM
EWRC's 21 Moves Gaming Studios Moves to SONY Pictures Studios and Green Lights Development of a Third Upcoming Game • EWRC • Jul 2, 2024 8:00 AM
NUBURU Announces Upcoming TV Interview Featuring CEO Brian Knaley on Fox Business, Bloomberg TV, and Newsmax TV as Sponsored Programming • BURU • Jul 1, 2024 1:57 PM
Mass Megawatts Announces $220,500 Debt Cancellation Agreement to Improve Financing and Sales of a New Product to be Announced on July 11 • MMMW • Jun 28, 2024 7:30 AM
VAYK Exited Caribbean Investments for $320,000 Profit • VAYK • Jun 27, 2024 9:00 AM
North Bay Resources Announces Successful Flotation Cell Test at Bishop Gold Mill, Inyo County, California • NBRI • Jun 27, 2024 9:00 AM

