Register for free to join our community of investors and share your ideas. You will also get access to streaming quotes, interactive charts, trades, portfolio, live options flow and more tools.
Curious to follow this as Freeland is going to announce soon that they are 25 billion (60+ billion deficit) more in debt than advertised.
Canadas economy is very small, does anyone know how much they have changed the metric for debt to look like they are doing well? No, they have.
They have also changed the public pensions to mortgage backed securities in the last few years as well.
This should be at a 2:1 ratio, Canada is doomed
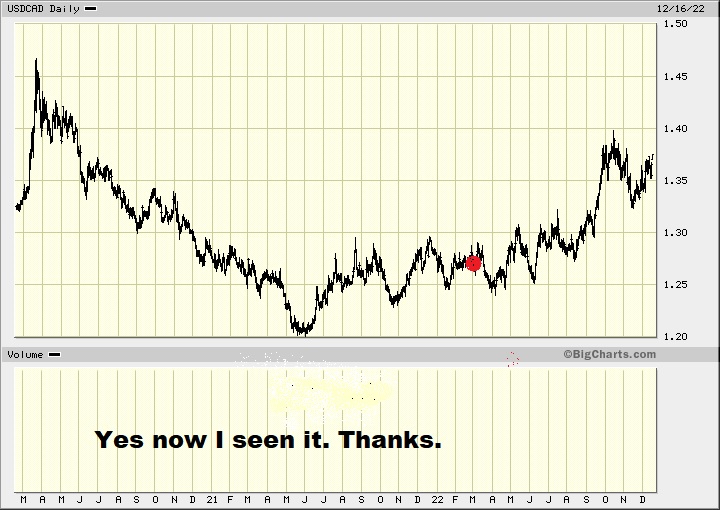
But it really all started happening as soon as this started so......it SEEMS like I DID partly see it before.
https://investorshub.advfn.com/boards/read_msg.aspx?message_id=170085230
Plus we've had YOUR chart to go by as well ;
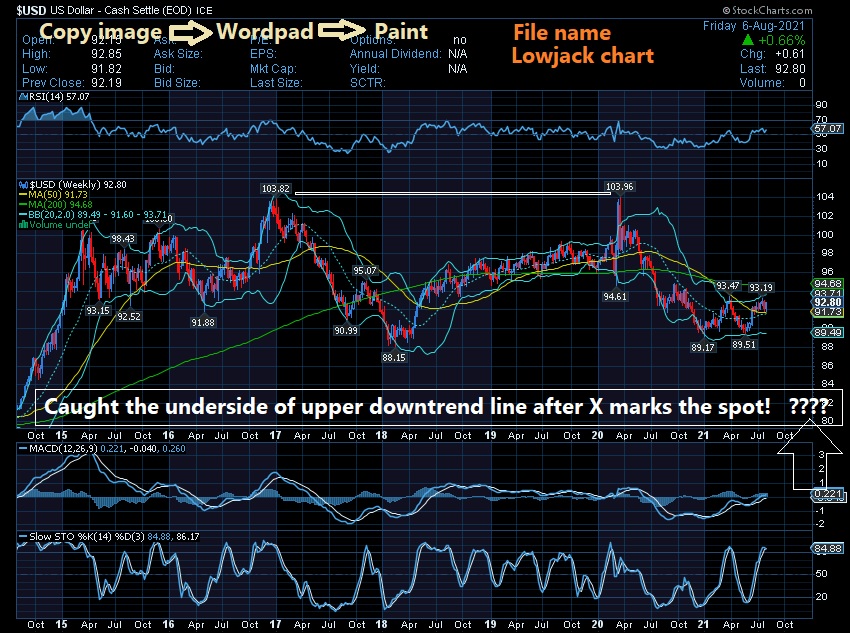
Do you see it yet?
ooooops I got my ceviche and paella mixed up :)
Oh Canada, you beautiful place, you include some of the most fun people I ever met Jenny and Chris 2/3, RIP our friend, the Ceviche is missed
I am looking forward to your breakout from the grasp of wretchedness in the mid 30s
Venture 550 should have cleared out all the suckers by then. Tis a falling wedge on the longer time frame!!! Fed emergency meeting monday on advance rates. Play catch! ~9000 nasdaq bottom BB. Sharp knives may hurt a bit. ![]()
I would imagine that their lumber sales have fallen off a cliff!
Yeah there was quite a sig swing in the USD to Cad lately
Which I haven't looked into much
The Dollar is soaring tho against the Yen
Against most everyone else it's been......flatish ?
Pound looks like it's heading to parity with USD.
CDN should be doing the same.
![]() Yea, seems to be missing a few years before 72?
Yea, seems to be missing a few years before 72?
https://schrts.co/SzhDDwee
126, 135, 140...after that it should be clean to go to 240.
Something definitely changed. Have they been shorting comex gold with Yen funding for the last 41 years!? If so, It's the MOASS of MOASS3S
https://www.fxstreet.com/rates-charts/chart-interactive?asset=usdjpy&config=https://editorial.blob.core.windows.net:443/chartconfigs/editorial%20charts/usdjpyeditorialconfig200420.json
https://www.macrotrends.net/2550/dollar-yen-exchange-rate-historical-chart
This is why you are supposed to pay attention in History class; So you can connect the dots later!
Might look to see what Dennis Gartman is up to.
No idea - It's like......uh -
Just TRY and find a proper long term chart
Judging from this "work" it seems to be saying that anything over 125 is/would be a 25yr breakout (ie break DOWN of the USD), which, seems to be in line with what gold's doing now ?
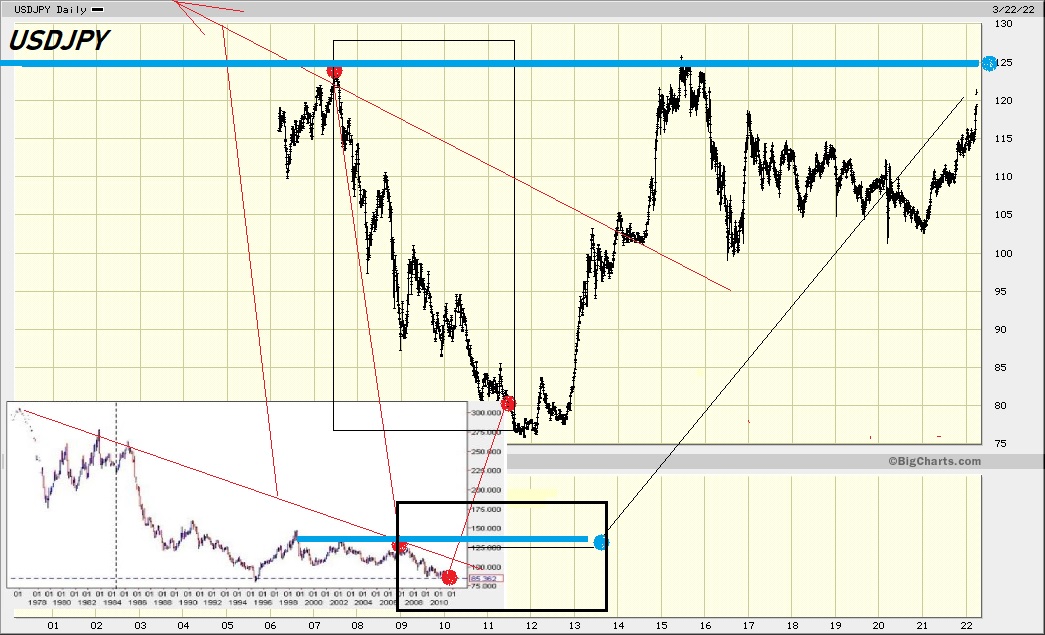
Seems "Treasure Maps" can be hard to find.....for some peculiar reason
Or perhaps it just simply takes a while to find 'em
Written in 2010 (LoL)
https://seekingalpha.com/article/218501-25-years-of-decline-for-the-u-s-dollar-vs-the-japanese-yen
https://www.google.ca/search?q=usdjpy+1980&sxsrf=APq-WBs_Rb_G7TAQksWQJZGN3tWTjBUegQ:1648005163672&source=lnms&tbm=isch&sa=X&ved=2ahUKEwi1mvnSodv2AhVSEzQIHXd0D_QQ_AUoAnoECAEQBA&biw=1280&bih=577&dpr=1.5
https://www.tradingview.com/chart/USDJPY/TOM4sQU8-USDJPY-1M-very-very-long-term-goal/
Last is best one I could find
= this one ; Looks like the move above 110 this yr was a breakout
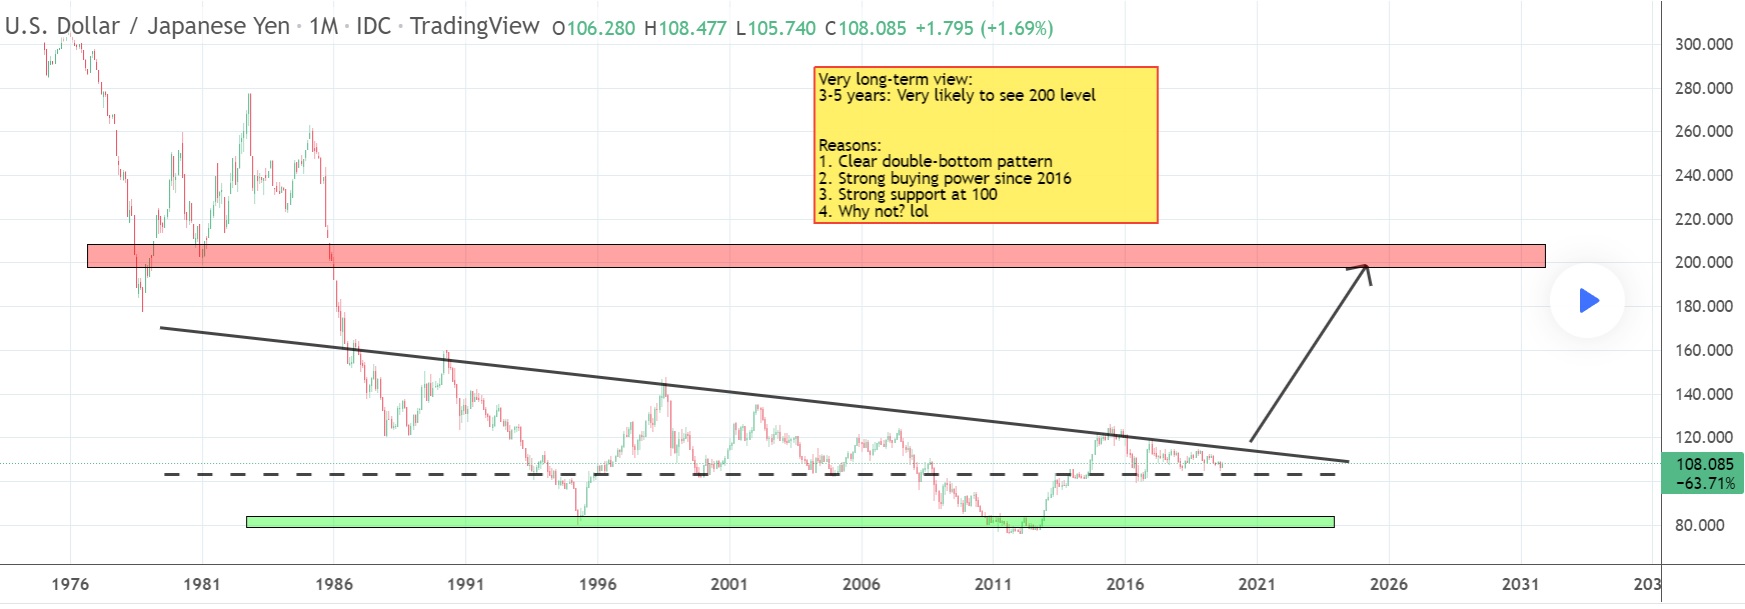
What do you see for the USDJPY? If I remember correctly ~140 ish from like 2008.
Break 1.20 to get to 1.04.
yes.....I don't see no HUGE US strength
https://bigcharts.marketwatch.com/advchart/frames/frames.asp?show=&insttype=&symb=usdcad&x=62&y=22&time=100&startdate=2%2F15%2F2020&enddate=3%2F21%2F2022&freq=1&compidx=aaaaa%3A0&comptemptext=&comp=none&ma=0&maval=9&uf=0&lf=1&lf2=0&lf3=0&type=2&style=320&size=3&timeFrameToggle=false&compareToToggle=false&indicatorsToggle=false&chartStyleToggle=false&state=9
Next target ~1.05 on the 35Y chart!

https://schrts.co/AkVDeVgh doin' some night shootin'
Are they printing more loonies than the US is?
![]()
![]()
![]()
![]()
Just don't wander too far and remember to duck when you get to that 1.30 bridge!
Weekly 50 dma break
For $hiTT sake.
Hey Frenchy, what are you running from? Par is the other direction!
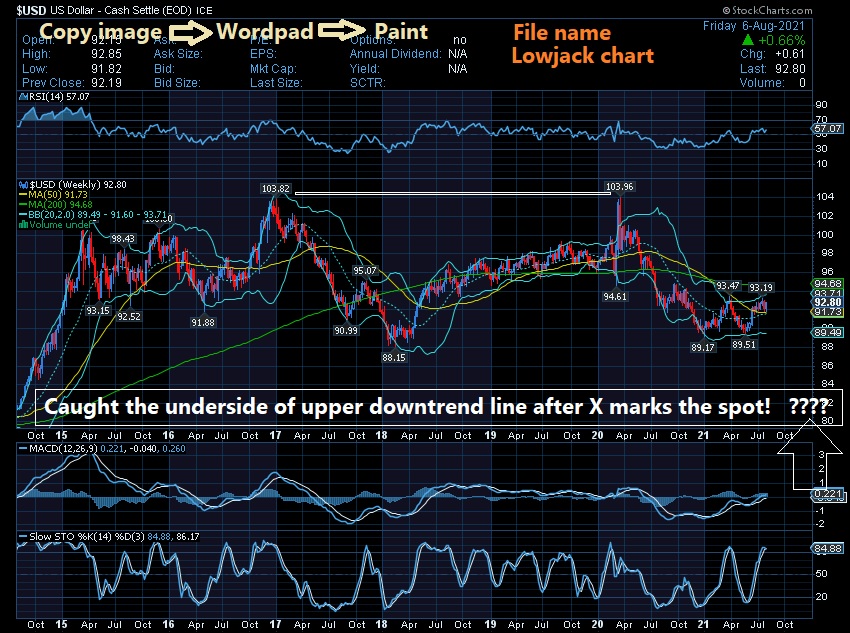
Huh ?......See ?.....I can't see it....
See how you could clarify instead of (PITA) - Instead leaving us scratching our heads
ah - I see - It's quite simple once ya' get the hang of it though
Ihub should have clear instructions somewhere
For me what is needed is Wordpad and Paint
Is that your double top there whose date should begin back in 1980 ?
Would like to see THAT chart
Closest thing I can come to it is . . . . .
Where Canada's dbl top came within 1 100th of a cent - I was freaking out
March 16th
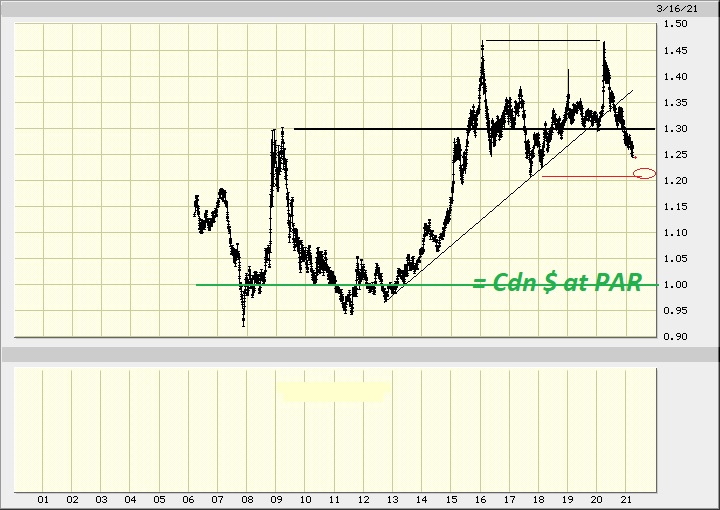
4 months later - Check !
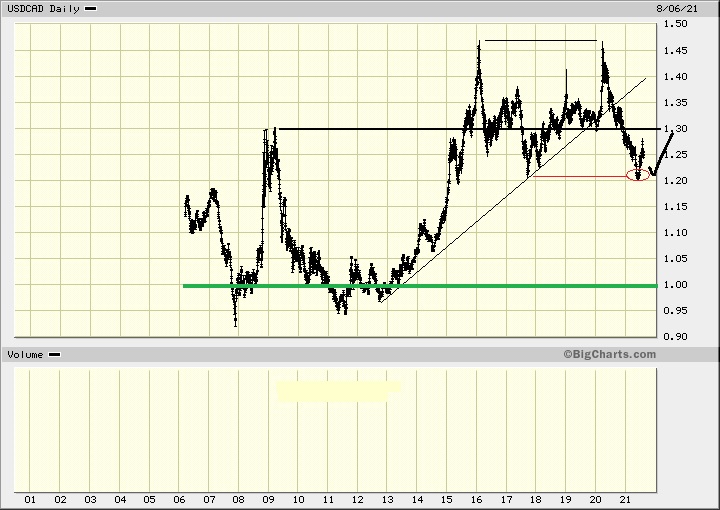
Too much of a PITA! Maybe if Ihub was better it would work!
https://stockcharts.com/c-sc/sc?s=%24USD&p=W&st=2014-08-07&i=t5263778260c&r=1628321289783&r=1628321530881[/img]
Haven't you yet learnt to post charts ?....Come on man - Get with it.
Anyways, he-he-he
Just sayin' so as you all know....
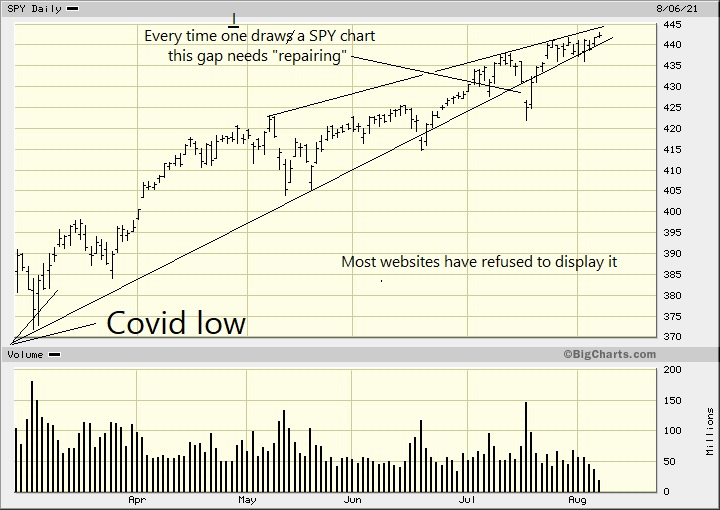
To me it could be the proverbial "shot across the bow"
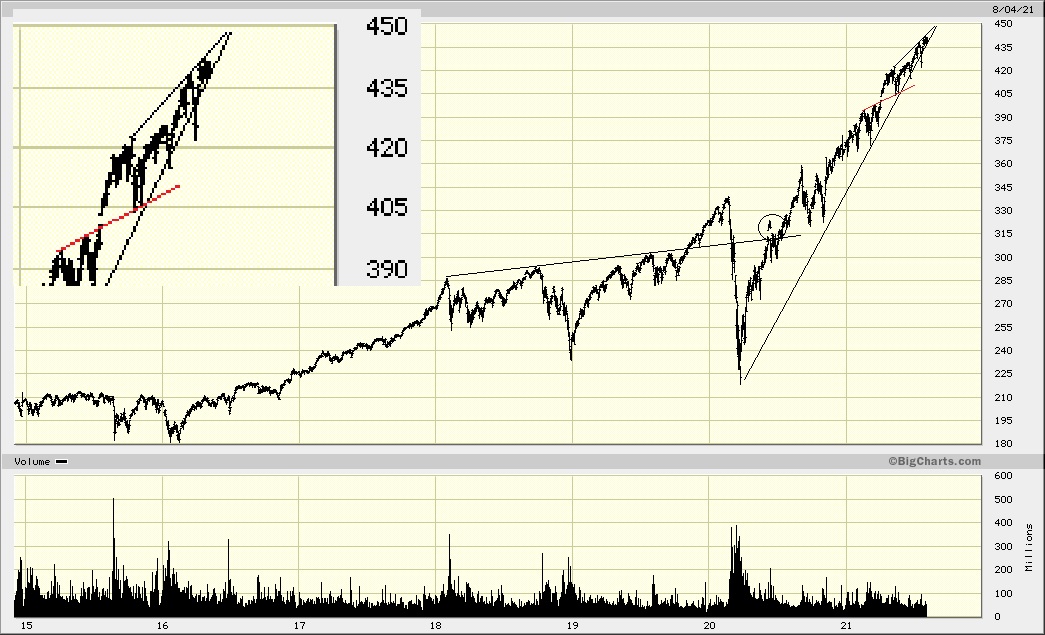
So that's where I am at with that, mind you ;
Most folks would not even consider a thing like that - and yet ;
Have another look at that top chart again....
And at how it's now down-gapped here TWICE thru The Covid Line
Making for possibly TWO shots across the bow.....
Can't anyone here sense a 3rd ?.....C'mon !
Crappiest sounding board EVER (this SPY board)......'Cuz so few believe in just BASIC TA
SOX a couple days ago
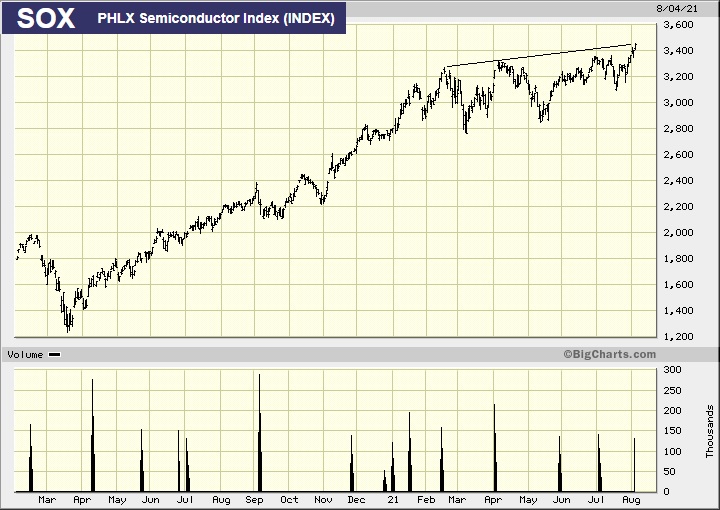
Here's where that now stands and
https://bigcharts.marketwatch.com/advchart/frames/frames.asp?show=&insttype=&symb=sox&x=35&y=12&time=100&startdate=1%2F7%2F2020&enddate=10%2F23%2F2021&freq=1&compidx=aaaaa%3A0&comptemptext=&comp=none&ma=1&maval=+50+200&uf=0&lf=1&lf2=0&lf3=0&type=2&style=320&size=3&timeFrameToggle=false&compareToToggle=false&indicatorsToggle=false&chartStyleToggle=false&state=11
DXY - All Data......Uh......now WHAT WUZ YOU SAYIN' AGAIN ?
Have a gander at the DXY from 1980-> 103 double top!
Y'see ?.....This only goes back to 86 - That's why you need to share YOUR chart
https://bigcharts.marketwatch.com/advchart/frames/frames.asp?show=&insttype=&symb=dxy&x=49&y=7&time=20&startdate=3%2F1%2F2021&enddate=8%2F23%2F2021&freq=1&compidx=aaaaa%3A0&comptemptext=&comp=none&ma=0&maval=+50+200&uf=0&lf=1&lf2=0&lf3=0&type=2&style=320&size=3&timeFrameToggle=false&compareToToggle=false&indicatorsToggle=false&chartStyleToggle=false&state=11
Have a gander at the DXY from 1980-> 103 double top!
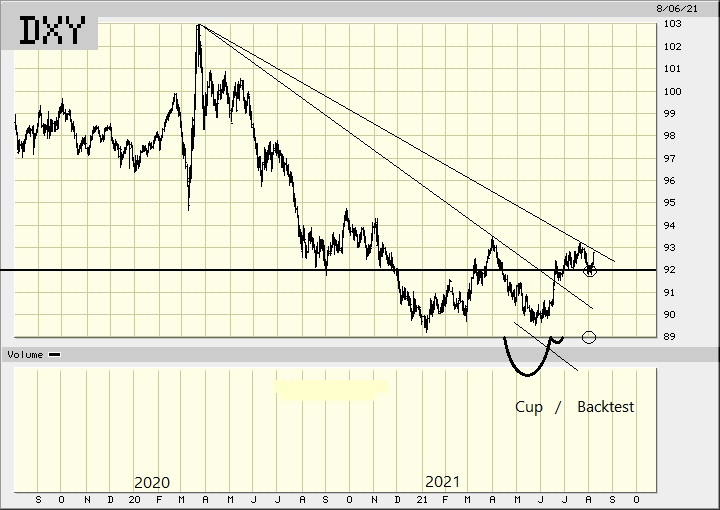
Caught the underside of upper downtrend line after X marks the spot! Buy the dip in real money!
I just KNEW that I smelt a frickin' Dollar Rat yesterday.....(and/or actually all frickin' MONTH)
https://investorshub.advfn.com/boards/read_msg.aspx?message_id=165294975
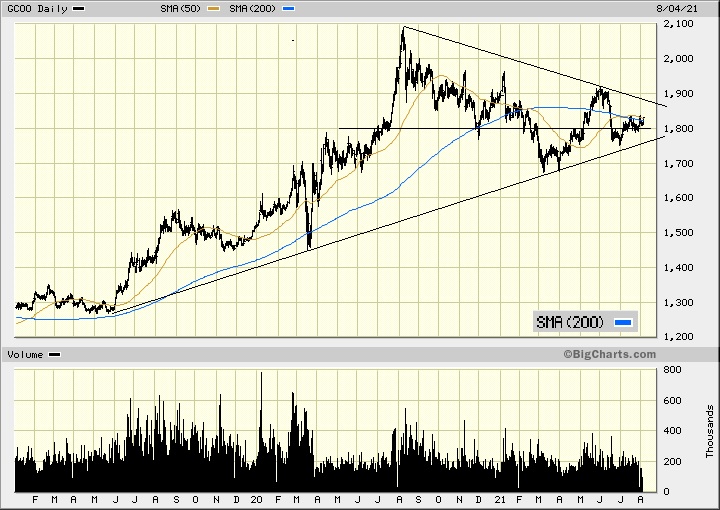
Gold plunges INSTANTLY down to support !
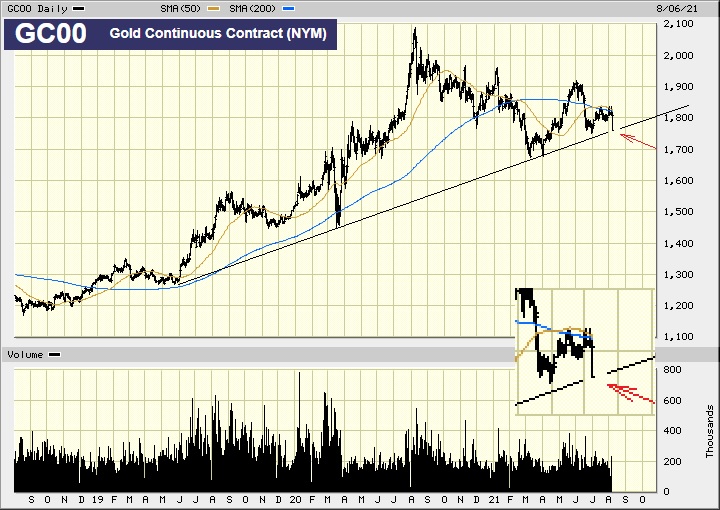
2 days earlier
SPY............Any ramifications ?
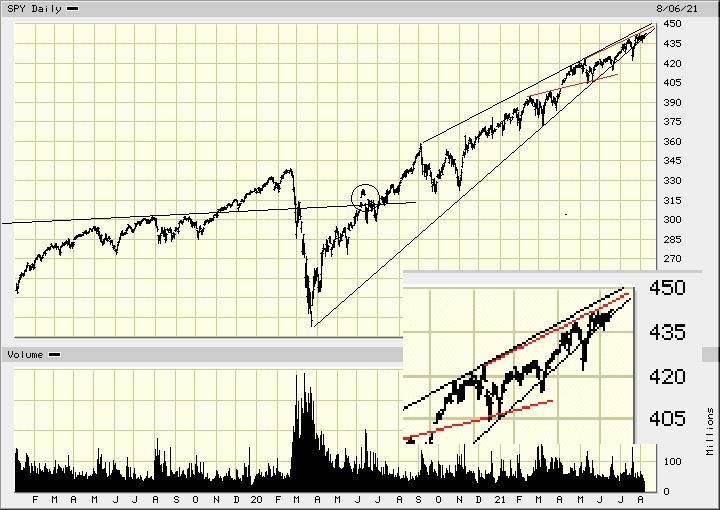
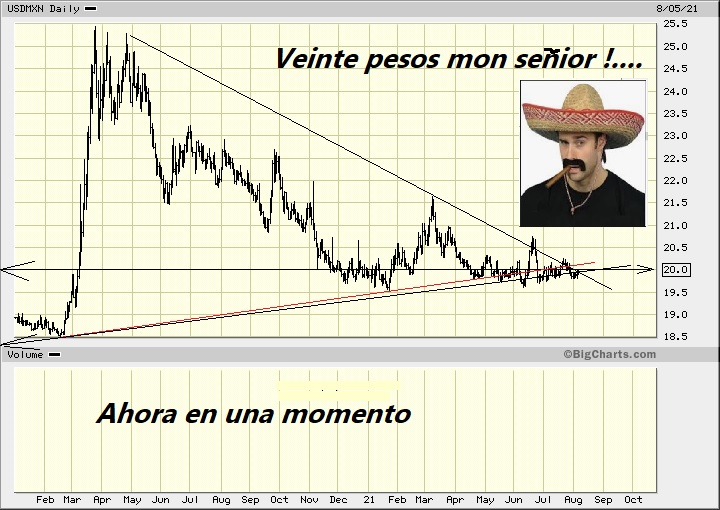
Yes, the Financial mkts are shuddering this Fri......
Seein' what they do with THE MONDAY is gonna be FUN
What would a soaring Dollar do to USA Exports ?
What might one do to JP Morgan ?
https://bigcharts.marketwatch.com/advchart/frames/frames.asp?show=&insttype=&symb=jpm&x=53&y=11&time=100&startdate=3%2F1%2F2020&enddate=8%2F23%2F2021&freq=1&compidx=aaaaa%3A0&comptemptext=&comp=none&ma=1&maval=+50+200&uf=0&lf=1&lf2=0&lf3=0&type=2&style=320&size=3&timeFrameToggle=false&compareToToggle=false&indicatorsToggle=false&chartStyleToggle=false&state=11
Currency Wars anyone ?.....Sure, why not ?
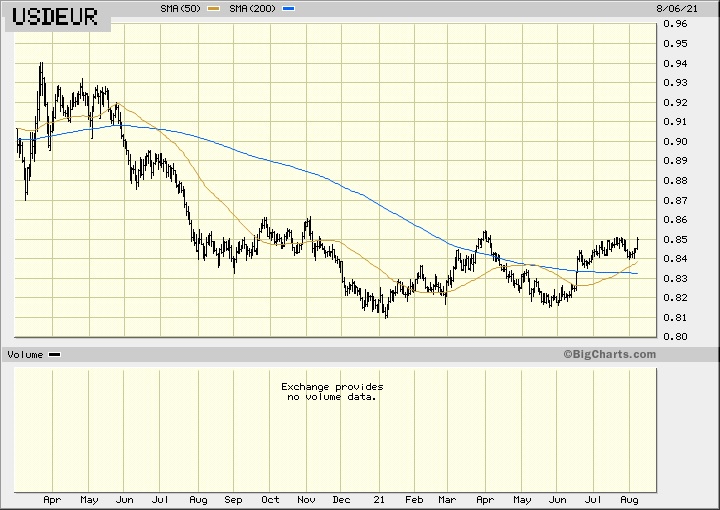
~50% retracement of the move! 0.907078
It's a good thing nobody wants to be Canadian!
I smell a rat (or a bunch of rats)......Something's in the wind
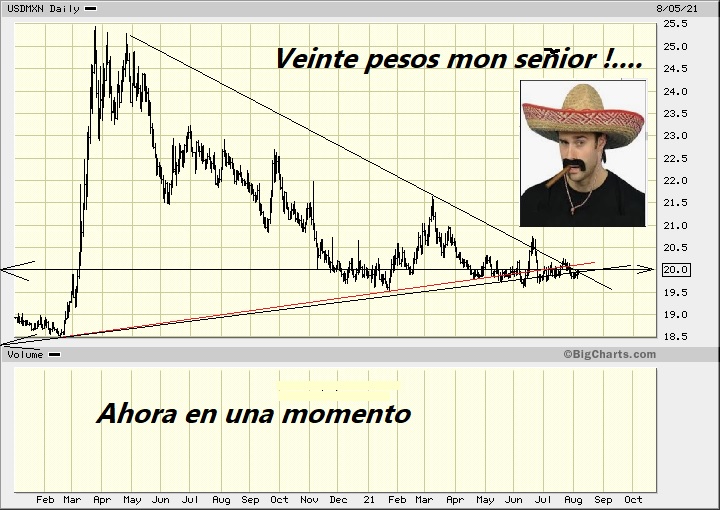
Couple of semanas ago
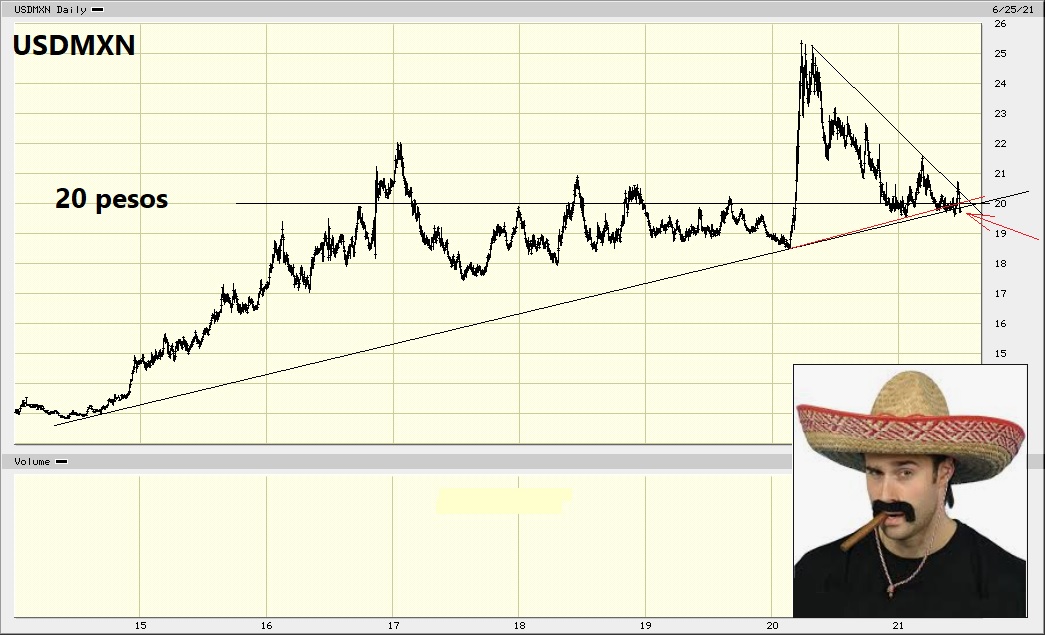
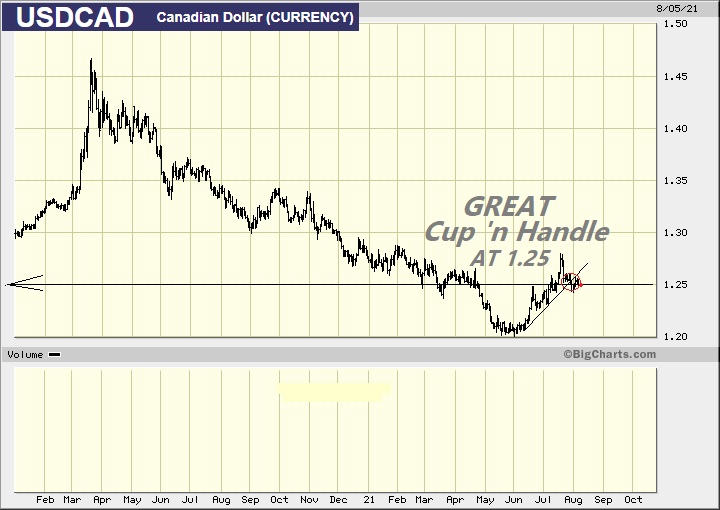
You should see THAT long term chart !
Something's in the cards I tell ya'.......Something's in the cards
The DXY 92's got some clues too !
https://bigcharts.marketwatch.com/advchart/frames/frames.asp?show=&insttype=Index&symb=dxy&x=53&y=16&time=100&startdate=1%2F1%2F2020&enddate=8%2F23%2F2021&freq=1&compidx=aaaaa%3A0&comptemptext=&comp=none&ma=1&maval=+50+200&uf=0&lf=1&lf2=0&lf3=0&type=2&style=320&size=3&timeFrameToggle=false&compareToToggle=false&indicatorsToggle=false&chartStyleToggle=false&state=15
Something's in the wind.
Currency Wars perhaps it seems.
Just WHAT are our "Captains of Industry" up to ?
Well, ONE thing's for sure - It won't BE good for Gold !......Or WILL it (be) ?
Next : Stay tuned
I suppose that could manifest ?
https://bigcharts.marketwatch.com/advchart/frames/frames.asp?show=&insttype=&symb=usdcad&x=55&y=15&time=100&startdate=5%2F21%2F2021&enddate=8%2F23%2F2021&freq=1&compidx=aaaaa%3A0&comptemptext=&comp=none&ma=1&maval=50+200&uf=0&lf=1&lf2=0&lf3=0&type=2&style=320&size=3&timeFrameToggle=false&compareToToggle=false&indicatorsToggle=false&chartStyleToggle=false&state=9
https://bigcharts.marketwatch.com/advchart/frames/frames.asp?show=&insttype=&symb=usdmxn&x=58&y=13&time=100&startdate=5%2F21%2F2021&enddate=8%2F23%2F2021&freq=1&compidx=aaaaa%3A0&comptemptext=&comp=none&ma=1&maval=50+200&uf=0&lf=1&lf2=0&lf3=0&type=2&style=320&size=3&timeFrameToggle=false&compareToToggle=false&indicatorsToggle=false&chartStyleToggle=false&state=9
What’s in store tomorrow I smell a squeeze
I Hub = lousy sounding board
I just say this in the/a hope that it might spur more zealous....participation
On the main board I post on

5 weeks earlier

True or False Survey launched last week : (little to no response)
TRUE ?.....or.....FALSE ?

Looks like TRUE it was....
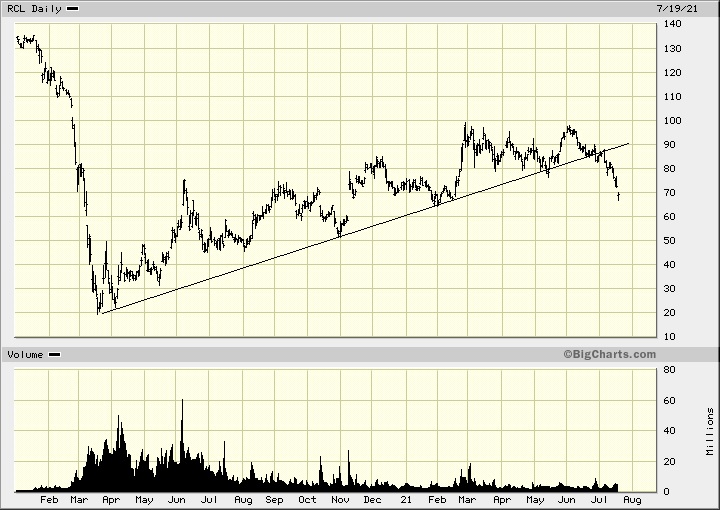
Global World of Lumber Prices ;
https://bigcharts.marketwatch.com/advchart/frames/frames.asp?show=&insttype=Future&symb=lumber&x=0&y=0&time=100&startdate=1%2F1%2F2010&enddate=8%2F23%2F2021&freq=1&compidx=aaaaa%3A0&comptemptext=&comp=none&ma=0&maval=200&uf=0&lf=1&lf2=0&lf3=0&type=2&style=320&size=3&timeFrameToggle=false&compareToToggle=false&indicatorsToggle=false&chartStyleToggle=false&state=11
Weekly 50 dma break bear market till oct imo
$USD MACD rollin over on the daily.
Some "movement" ?
But what d'ya' mean - so I can use them to roll again.....
Joints ?
Hurry up and sell the Peso so I can use them to roll again!
Up or down from here I converted 500 k over on Monday happy I did
U.S. Dollar - 20 pesos
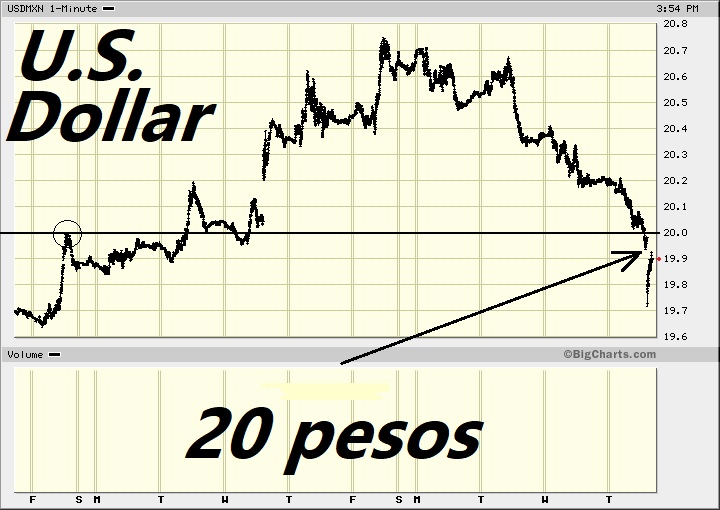
And yet, some just don't LIKE (my) T.A.
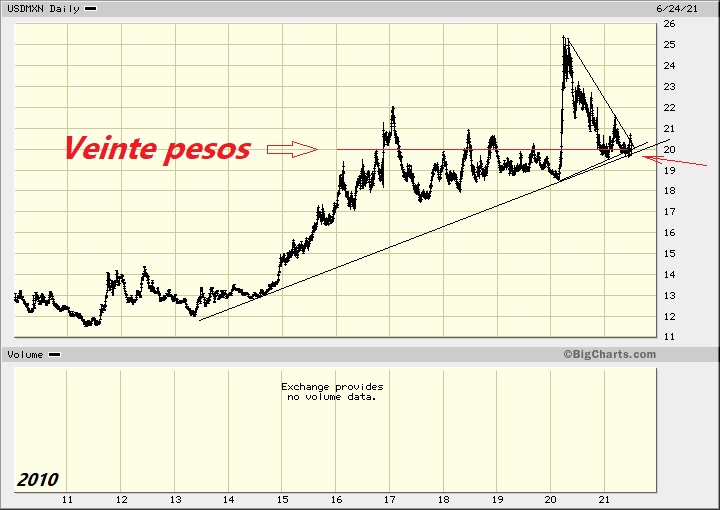
Yesterday :
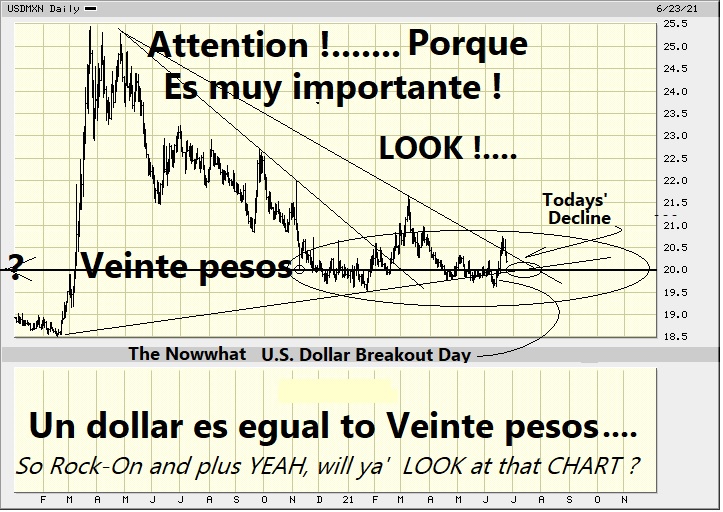
Whilst Gold Bullion monitors earnestly......
https://bigcharts.marketwatch.com/advchart/frames/frames.asp?show=&insttype=Future&symb=gc00&x=36&y=13&time=18&startdate=1%2F1%2F2010&enddate=12%2F3%2F2021&freq=9&compidx=aaaaa%3A0&comptemptext=&comp=none&ma=0&maval=9&uf=0&lf=1&lf2=0&lf3=0&type=2&style=320&size=3&timeFrameToggle=false&compareToToggle=false&indicatorsToggle=false&chartStyleToggle=false&state=9
|
Followers
|
19
|
Posters
|
|
|
Posts (Today)
|
0
|
Posts (Total)
|
109
|
|
Created
|
06/03/12
|
Type
|
Free
|
| Moderators | |||
| Volume: | - |
| Day Range: | |
| Last Trade Time: |
| Volume | |
| Day Range: | |
| Bid Price | |
| Ask Price | |
| Last Trade Time: |
