Gold appears to like where it is, everything says launch but paper gold rules instead of demand and true value compared to debt. Which is an indicator that says beware of stocks and dollar. I don’t get it, until 2008 it took 77c if debt to produce $1 of GDP, after that its taking $4 of debt to produce $1 GDP. Outrageously unsustainable.
SPX Monitoring purposes; Sold SPX 3/28/19 & 2815.44= gain .61%; Long 2798.36 & 3/25/19. Monitoring purposes GOLD: Long GDX on 1/29/19 at 21.96. Long Term Trend SPX monitor purposes; Long SPX on 10-19-18 at 2767.78.
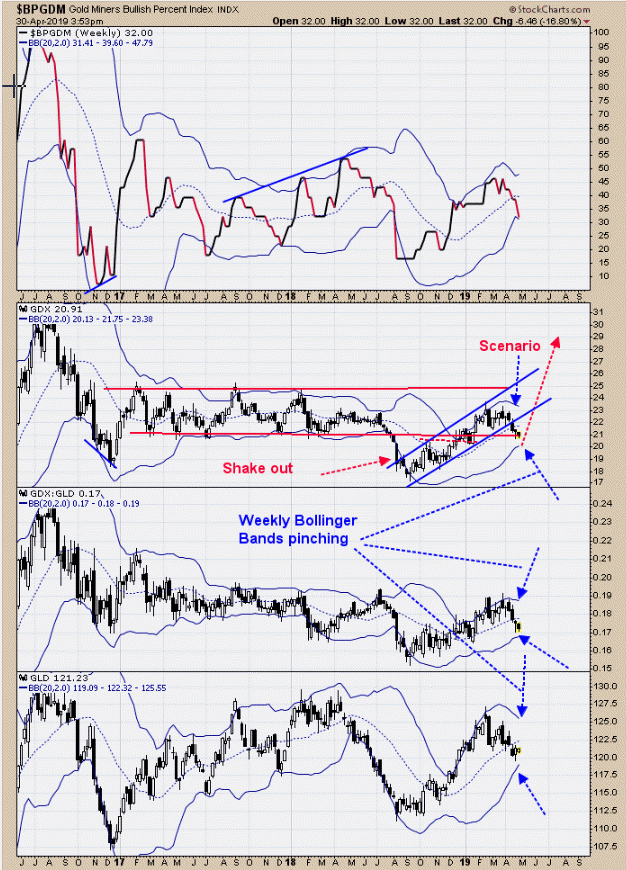
Notice that the Bollinger bands are pinching on GLD (Bottom window), GDX/GLD (next window up) and GDX (next window up). Bollinger band pinching suggests increase volatility will be entering the market soon. We drew red parallel lines on the GDX chart to show support and resistance. GDX fell through support (near 21.00) back in August 2018 and then closed back above 21.00 in late 2018 creating a bullish “shakeout.” GDX is back down near support again and we do expect this area will hold, but it could see a brief shot at the 20.00 range before reversing higher. With the Bollinger bands pinching, this suggests the next move could be an impulse wave and, with the “shakeout,” that move should be up. A time cycle low is also due now and helps the bullish outlook. Long GDX on 1/29/19 at 21.97.
 Market Data
  Markets