


| Followers | 0 |
| Posts | 148553 |
| Boards Moderated | 7 |
| Alias Born | 03/10/2004 |
Wednesday, April 24, 2019 12:52:00 PM
The Ord Oracle
By: Tim Ord | April 24, 2019
SPX Monitoring purposes; Sold SPX 3/28/19 & 2815.44= gain .61%; Long 2798.36 & 3/25/19.
Monitoring purposes Gold: Long GDX on 1/29/19 at 21.96.
Long-Term Trend SPX monitor purposes; Long SPX on 10-19-18 at 2767.78
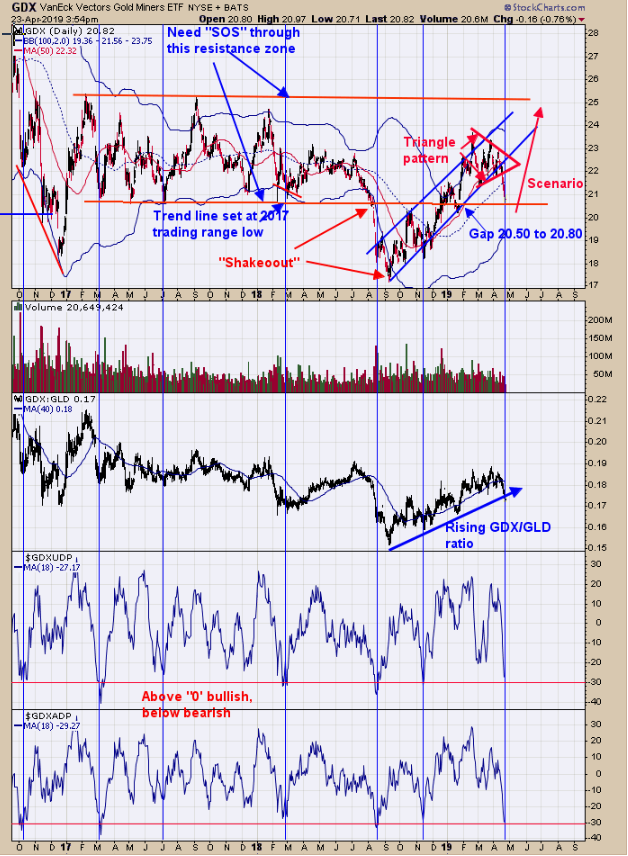
Above is the daily GDX chart going back 2 years and 7 months. Yesterday we said, “GDX trading range developed in 2017 between 21.00 to 25.00. GDX fell below the 21.00 level in late 2018 and then closed above it in early 2019 creating a bullish “Shakeout”. A “Shakeout” is a false break to the downside and they normally reverse and rally back to breakout to the upside which in this case would mean a break above the resistance level of 25.00. Form late January to mid April a “Triangle” pattern formed. Its common for the first breakout of a “Triangle” patterns to be a false break and that may have developed here. There is strong support near the bottom of the 2017 trading range near 21.00 and also there is an open gap that formed on January 25 in the 20.50 to 20.80 range which is also support. A cycle low is due from Mid April to early May and we are in that time zone now. Its common for “Triangle” patterns to form at the half way point of the move and if that is true this time around than an upside target near 28.00 range is possible.” Adding to that, the bottom window is Advance/Decline with an 18 period moving average indicator and next window up is the Up Down Volume with 18 period moving average indicator. When both indicators reach -30, GDX is near a low (designated with blue vertical lines) . GDX is near support and its common to overshoot support before it reverses higher which is common to happen on a Friday. Long GDX on 1/29/19 at 21.97. ord-oracle.com.
Read Full Story »»»
• DiscoverGold
Click on "In reply to", for Authors past commentaries
Information posted to this board is not meant to suggest any specific action, but to point out the technical signs that can help our readers make their own specific decisions. Your Due Dilegence is a must!
• DiscoverGold
Recent GDX News
- Precious metals shares climb as U.S. tariffs extend to certain gold bars • IH Market News • 08/08/2025 01:45:14 PM


