Weekly Wrap (Gold) »» Daily & Weekly Charts By: Carl Swenlin | January 11, 2019
IT Trend Model: BUY as of 10/19/2018
LT Trend Model: BUY as of 1/8/2019
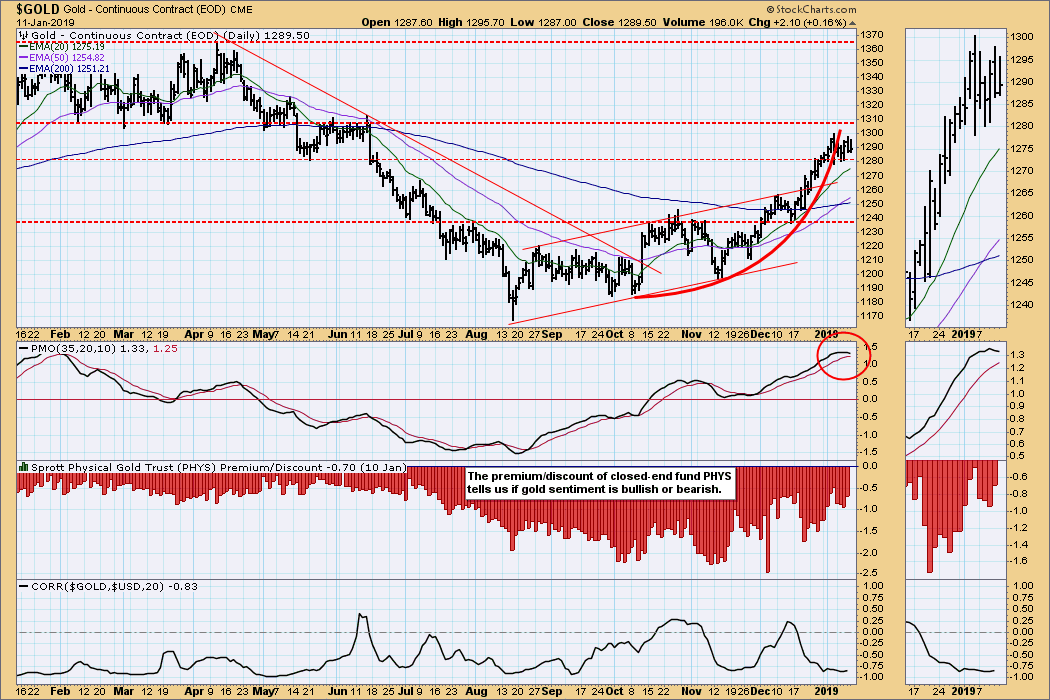
GOLD Daily Chart: On Monday the 50EMA crossed up through the 200EMA, generating an LT Trend Model BUY signal. The mini-parabolic that I recently identified has resolved by price moving sideways through the arc instead of a breakdown. The daily PMO is overbought and has topped, so a pullback could still be in the cards.
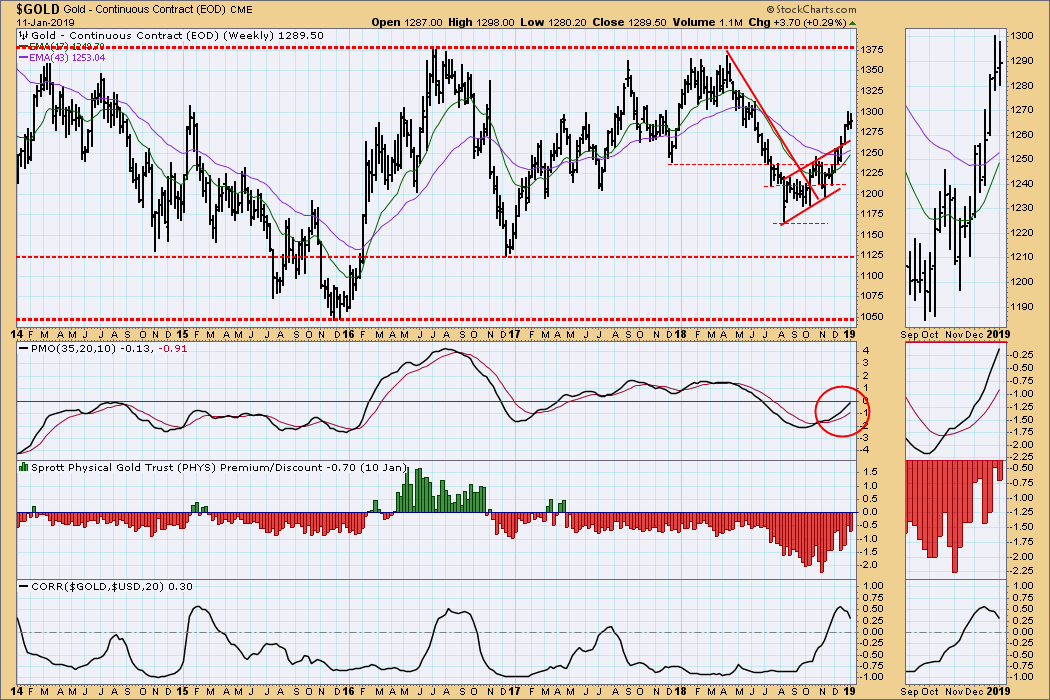
GOLD Weekly Chart: Positive. The weekly PMO looks strong, and the next obvious resistance is well above at 1375.
 News
News  Market Data
  Discover