


| Followers | 689 |
| Posts | 143817 |
| Boards Moderated | 35 |
| Alias Born | 03/10/2004 |
Sunday, January 13, 2019 9:30:19 AM
By: Carl Swenlin | January 11, 2019
IT Trend Model: BUY as of 10/19/2018
LT Trend Model: BUY as of 1/8/2019
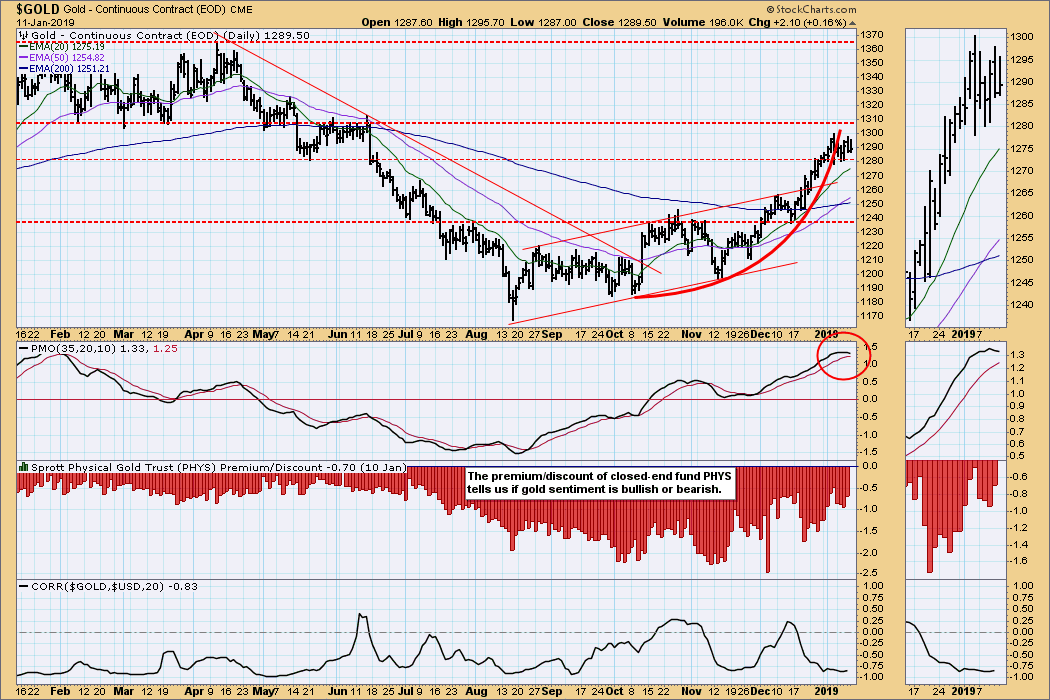
GOLD Daily Chart: On Monday the 50EMA crossed up through the 200EMA, generating an LT Trend Model BUY signal. The mini-parabolic that I recently identified has resolved by price moving sideways through the arc instead of a breakdown. The daily PMO is overbought and has topped, so a pullback could still be in the cards.
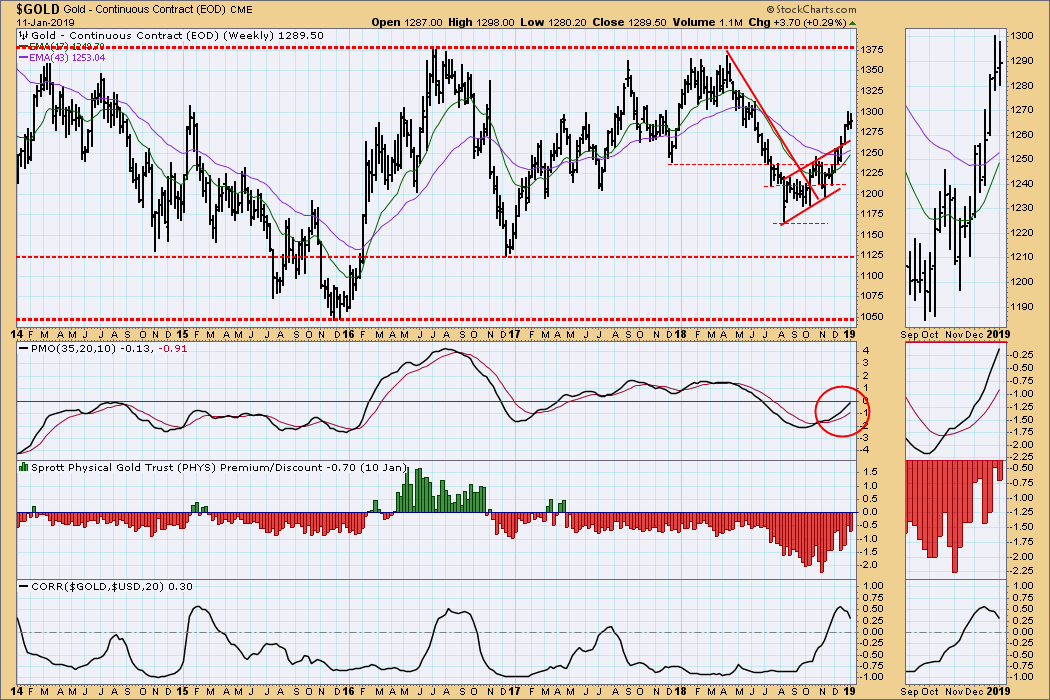
GOLD Weekly Chart: Positive. The weekly PMO looks strong, and the next obvious resistance is well above at 1375.
Read Full Story »»»
• DiscoverGold
Click on "In reply to", for Authors past commentaries
Information posted to this board is not meant to suggest any specific action, but to point out the technical signs that can help our readers make their own specific decisions. Your Due Dilegence is a must!
• DiscoverGold
Recent GOLD News
- Barrick Continues to Unlock Value Embedded in Its Asset Base • GlobeNewswire Inc. • 09/17/2024 05:00:29 PM
- Feasibility Study on Lumwana Super Pit Expansion Expected by Year-End • GlobeNewswire Inc. • 09/11/2024 09:00:00 PM
- Key Projects Advance as Barrick Keeps Tight Focus on Value Creation and Growth • GlobeNewswire Inc. • 08/12/2024 10:00:00 AM
- Barrick Declares Q2 Dividend and Buys Back Shares • GlobeNewswire Inc. • 08/12/2024 09:59:00 AM
- U.S. Futures Steady as Markets Await Key Inflation Data, Oil Prices Climb • IH Market News • 08/12/2024 09:47:41 AM
- Mining Plays a Vital Role in Advancing the UN’s Sustainable Development Goals, says Barrick • GlobeNewswire Inc. • 08/02/2024 06:45:39 PM
- Porgera Remains On Track Despite Mulitaka Landslide Challenges • GlobeNewswire Inc. • 07/25/2024 11:00:00 AM
- Higher Q2 Production Puts Barrick On Track to Deliver 2024 Targets • GlobeNewswire Inc. • 07/16/2024 11:00:00 AM
- Barrick Continues to Invest in Mali • GlobeNewswire Inc. • 07/09/2024 07:00:00 PM
- Exploration Success, Capital Investment and Reserve Growth to Sustain Kibali’s Production Profile • GlobeNewswire Inc. • 07/02/2024 04:00:00 PM
- Barrick and Zijin Contribute $1 Million to Support Papua New Guinea Landslide Victims • GlobeNewswire Inc. • 06/07/2024 11:18:39 AM
- Form SD - Specialized disclosure report • Edgar (US Regulatory) • 05/29/2024 08:01:04 PM
- Barrick’s Sustainability Strategy Delivers Real Value to Stakeholders • GlobeNewswire Inc. • 05/15/2024 11:00:00 AM
- Barrick Announces Extensive Exploration Partnership with Geophysx Jamaica • GlobeNewswire Inc. • 05/01/2024 10:15:00 AM
- Barrick to Ramp Up Production As It Remains On Track to Achieve 2024 Targets • GlobeNewswire Inc. • 05/01/2024 10:00:00 AM
- Barrick Declares Q1 Dividend • GlobeNewswire Inc. • 05/01/2024 09:59:00 AM
- Barrick Announces Election of Directors • GlobeNewswire Inc. • 04/30/2024 08:15:55 PM
- Barrick On Track to Achieve 2024 Targets • GlobeNewswire Inc. • 04/16/2024 11:00:00 AM
- Notice of Release of Barrick’s First Quarter 2024 Results • GlobeNewswire Inc. • 04/09/2024 11:00:00 AM
- Strategy-Driven Barrick Builds on Value Foundation • GlobeNewswire Inc. • 03/28/2024 09:20:38 PM
- Barrick Hunts New Gold and Copper Prospects in DRC From Kibali Base • GlobeNewswire Inc. • 03/20/2024 02:00:00 PM
- Barrick Opens Academy at Closed Buzwagi Mine • GlobeNewswire Inc. • 03/18/2024 08:00:00 AM
- Barrick to Grow Production and Value on Global Asset Foundation • GlobeNewswire Inc. • 03/15/2024 11:53:01 AM
- Loulo-Gounkoto Delivers Another Value-Creating Performance • GlobeNewswire Inc. • 03/10/2024 10:00:00 AM
- Passing of the Right Honorable Brian Mulroney • GlobeNewswire Inc. • 03/02/2024 01:17:35 AM
VHAI - Vocodia Partners with Leading Political Super PACs to Revolutionize Fundraising Efforts • VHAI • Sep 19, 2024 11:48 AM
Dear Cashmere Group Holding Co. AKA Swifty Global Signs Binding Letter of Intent to be Acquired by Signing Day Sports • DRCR • Sep 19, 2024 10:26 AM
HealthLynked Launches Virtual Urgent Care Through Partnership with Lyric Health. • HLYK • Sep 19, 2024 8:00 AM
Element79 Gold Corp. Appoints Kevin Arias as Advisor to the Board of Directors, Strengthening Strategic Leadership • ELMGF • Sep 18, 2024 10:29 AM
Mawson Finland Limited Further Expands the Known Mineralized Zones at Rajapalot: Palokas step-out drills 7 metres @ 9.1 g/t gold & 706 ppm cobalt • MFL • Sep 17, 2024 9:02 AM
PickleJar Announces Integration With OptCulture to Deliver Holistic Fan Experiences at Venue Point of Sale • PKLE • Sep 17, 2024 8:00 AM

