DP (SPY) Weekly Wrap: Two Indications of a Short-Term Top By: Carl Swenlin | September 21, 2018
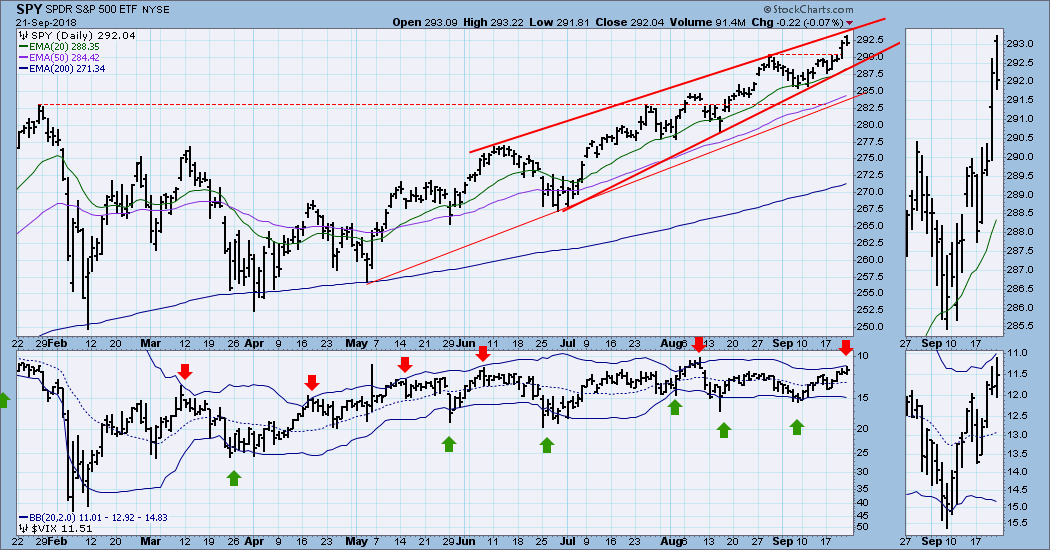
The market (represented by SPY) has nearly reached the top of a rising wedge formation, and the VIX has reached the top Bollinger Band on our reverse scale display. There is no guarantee, but there is a pretty good chance that a short-term top is very near. There is also the technical expectation that price will eventually break down from the rising wedge, but not necessarily on the next pullback.
SECTORS
Each S&P 500 Index component stock is assigned to one, and only one, of 10 major sectors. This is a snapshot of the Intermediate-Term and Long-Term Trend Model signal status for those sectors.
STOCKS
IT Trend Model: BUY as of 5/11/2018
LT Trend Model: BUY as of 4/1/2016
SPY Daily Chart: End of quarter options expiration brought the expected high volume on Friday, and, even though there was a bit of a price advance, the week's range was less than 2% wide. OBV confirms the price advance, and the daily PMO reflects the persistent strength of the extended rally.
SPY Weekly Chart: The parabolic advance remains intact, and price is challenging the top of the rising trend channel. The parabolic is in early stages. It reflects high confidence, but no buying frenzy yet.
Short-Term Market Indicators: These indicators are somewhat overbought, but there is plenty of room for them to become even more overbought.
Intermediate-Term Market Indicators: For weeks I have been emphasizing the negative divergences on these indicators, but in this case I think that was a mistake. Certainly, we can see cases on the chart where divergences seem to have telegraphed a certain outcome, but for several months indicators have been well above the zero line and running sideways. This is an expression of the persistent strength that has been driving the market higher.
CONCLUSION: This week the thing that stands out most to me is the short-term overbought condition visible on the first chart in this article. The rising wedge and VIX are telling us to look for a short pullback, but our experience over several months tells us that a pullback probably won't amount to much.
Longer term, there is evidence of narrowing participation. The Bullish Percent Index (BPI) for the S&P 500 is currently at 68. In January it was 83. What this tells us is that fewer of the smaller-cap stocks in the index are helping to push the market higher, and that the largest-cap stocks are doing more of the work. This is probably not of immediate concern -- back at the 2000 top the BPI was around 60. Nevertheless, it is less than ideal to have the market making new highs with a fading BPI.
 News
News  Market Data
  Discover