DP (SPY) Weekly Wrap: Gap Cleared. What's Next? By: Carl Swenlin | September 14, 2018
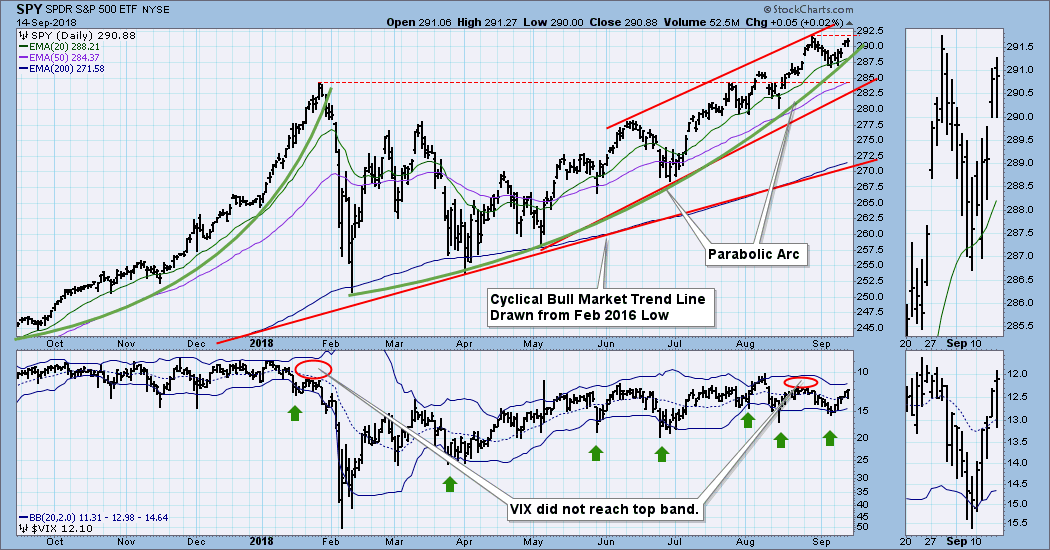
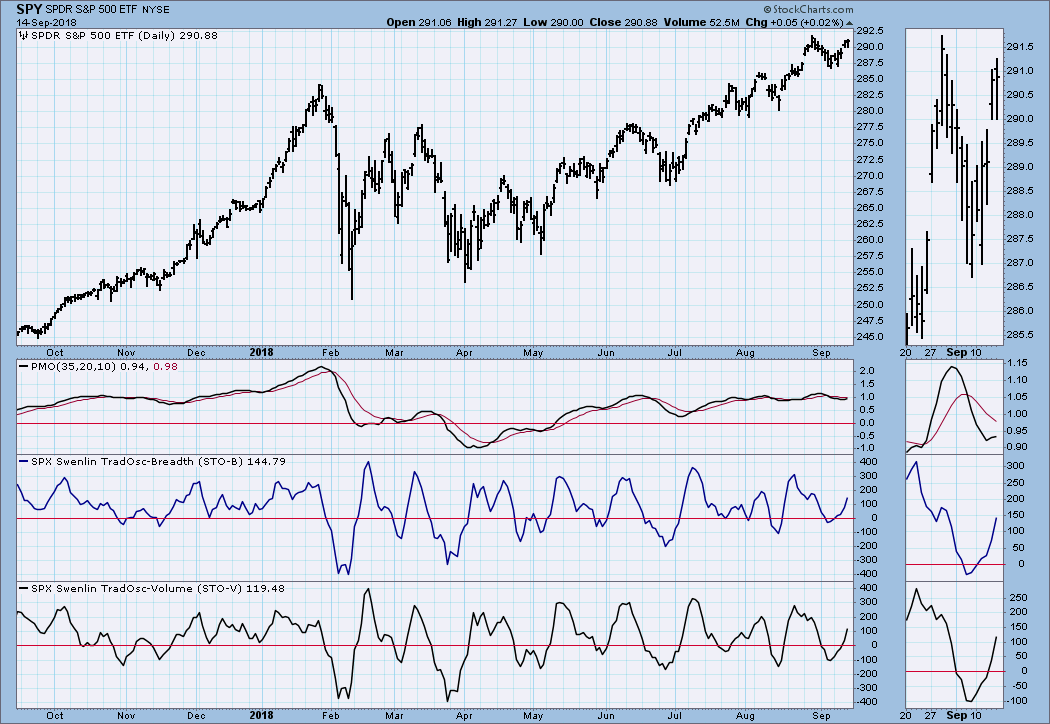
Last week I was concerned that the VIX had topped but had failed reach the top band on the chart -- a similar configuration occurred in January before the crash. This week the VIX moved close to the top of the channel, so I think we can consider that the 'gap' problem has cleared. (To clarify, I use an inverted scale for the VIX to make interpretation more intuitive, and my references are to that display.) The market is near all-time highs again, as it continues to walk up a parabolic arc.
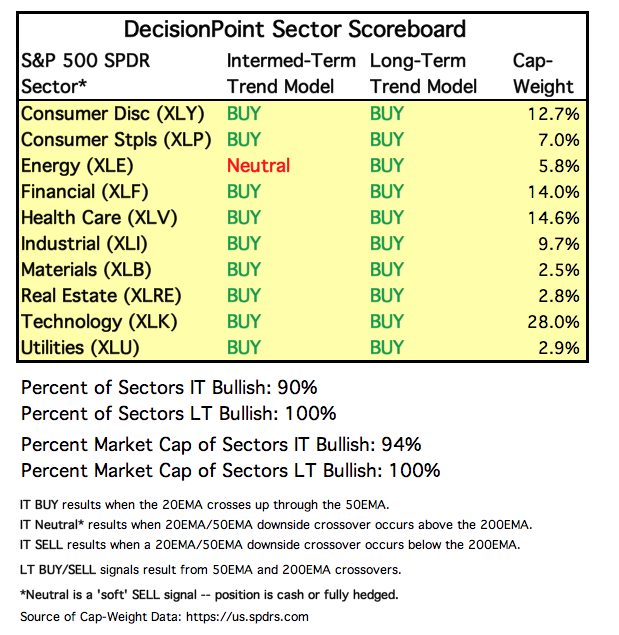
SECTORS
Each S&P 500 Index component stock is assigned to one, and only one, of 10 major sectors. This is a snapshot of the Intermediate-Term and Long-Term Trend Model signal status for those sectors.
STOCKS
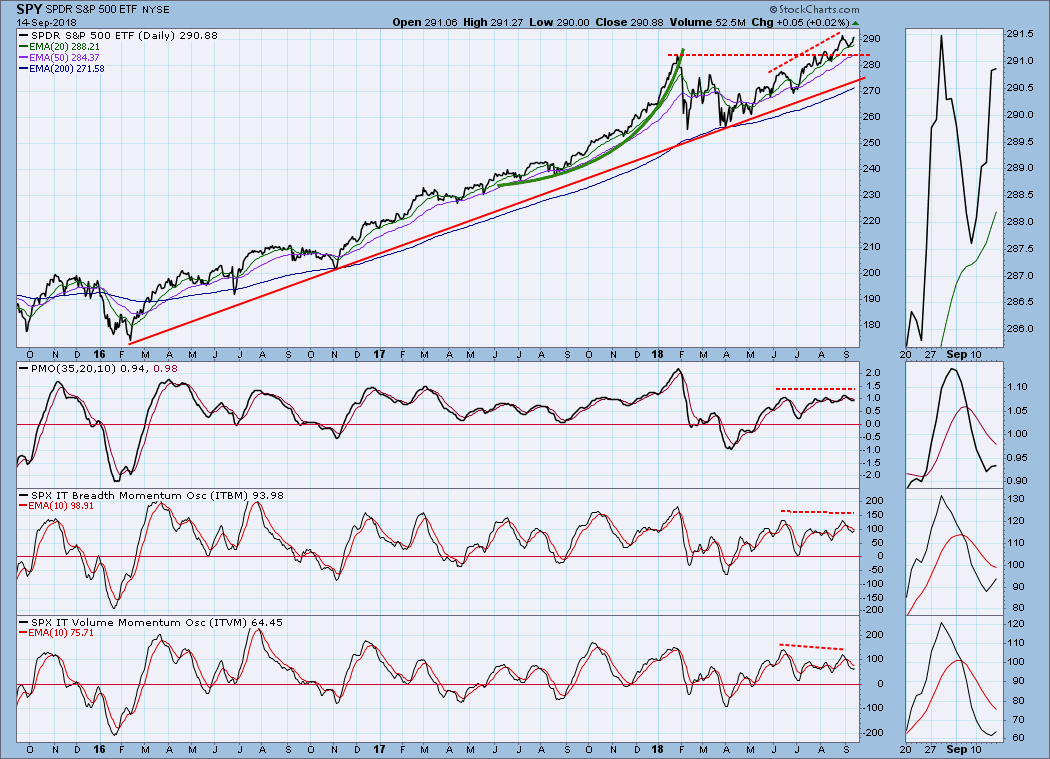
IT Trend Model: BUY as of 5/11/2018
LT Trend Model: BUY as of 4/1/2016
SPY Daily Chart: Price is being squeezed between a rising trend channel and a parabolic arc. To be clear, I don't really think of the arc as 'support,' rather it is just an expression of increasing investor abandon. As I have said, the arc is in early stages, and it could soon be lost to corrective action. The flat, but positive, daily PMO indicates that there is steady upward pressure on price. The VIX is near the upper band, so a short-term top could develop soon.
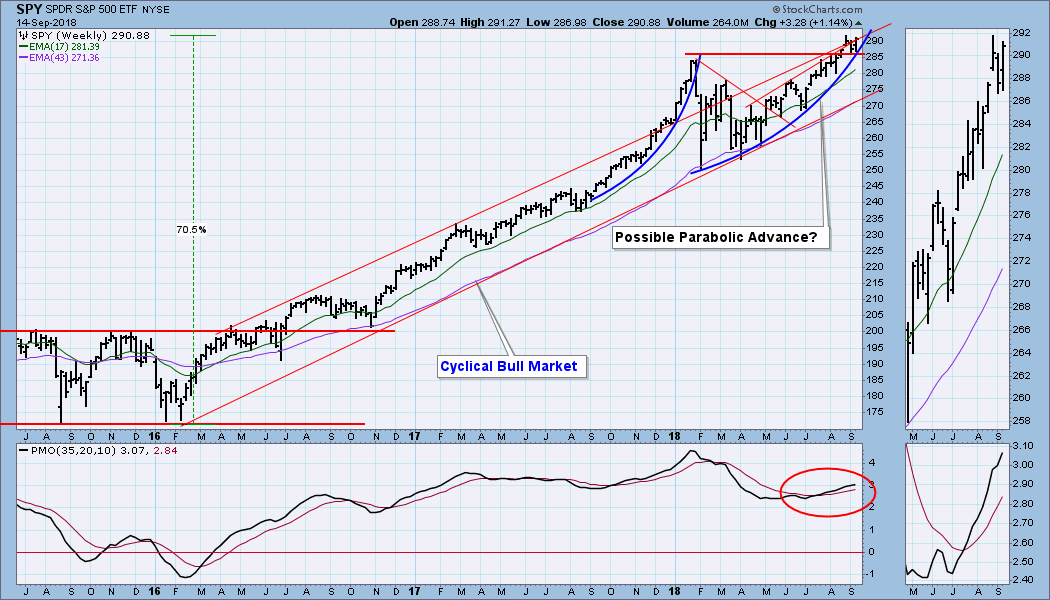
SPY Weekly Chart: My note on this chart indicates that I am still a bit tentative regarding the developing parabolic, but the cyclical bull market is certainly healthy with price being at the top of the rising trend channel.
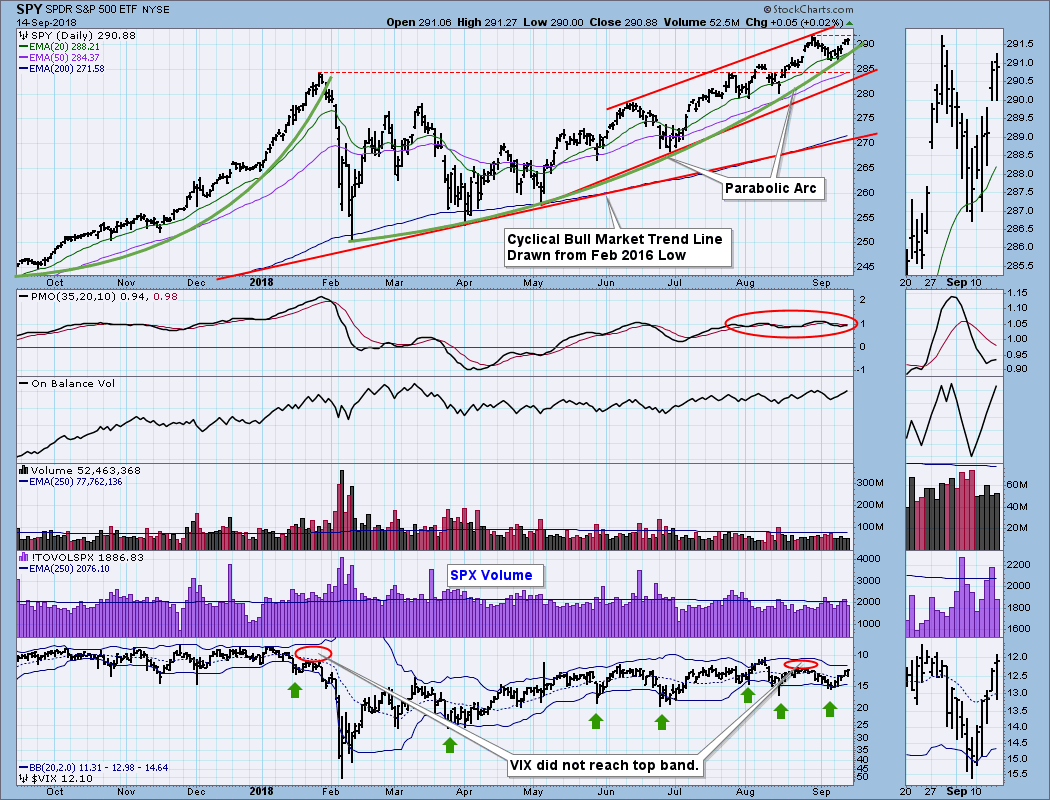
Short-Term Market Indicators: The STO-B and STO-V are confirming the recent price advance. They could reach overbought levels next week.
Intermediate-Term Market Indicators: Modestly overbought with negative divergences continuing.
Conclusion: The market is somewhat overbought intermediate-term, but this is more or less the condition the market has been in since June, and it hasn't stopped upward progress. Price is reaching the resistance line drawn across the August high, but we'll probably see new highs next week in spite of that. After the new highs, the VIX and short-term indicators will be overbought, and a small correction will be in order.
Next week is end of quarter options expiration, so expect very high volume on Friday and a narrow price range toward the end of the week. That is not guaranteed, but it is what we usually see.
Click on "In reply to", for Authors past commentaries
Information posted to this board is not meant to suggest any specific action, but to point out the technical signs that can help our readers make their own specific decisions. Your Due Dilegence is a must! • DiscoverGold
Register for free to join our community of investors and share your ideas. You will also get access to streaming quotes, interactive charts, trades, portfolio, live options flow and more tools.


 News
News  Market Data
  Discover