DP (SPY) Weekly/Monthly Wrap: Failure to Thrive By: Carl Swenlin | September 28, 2018
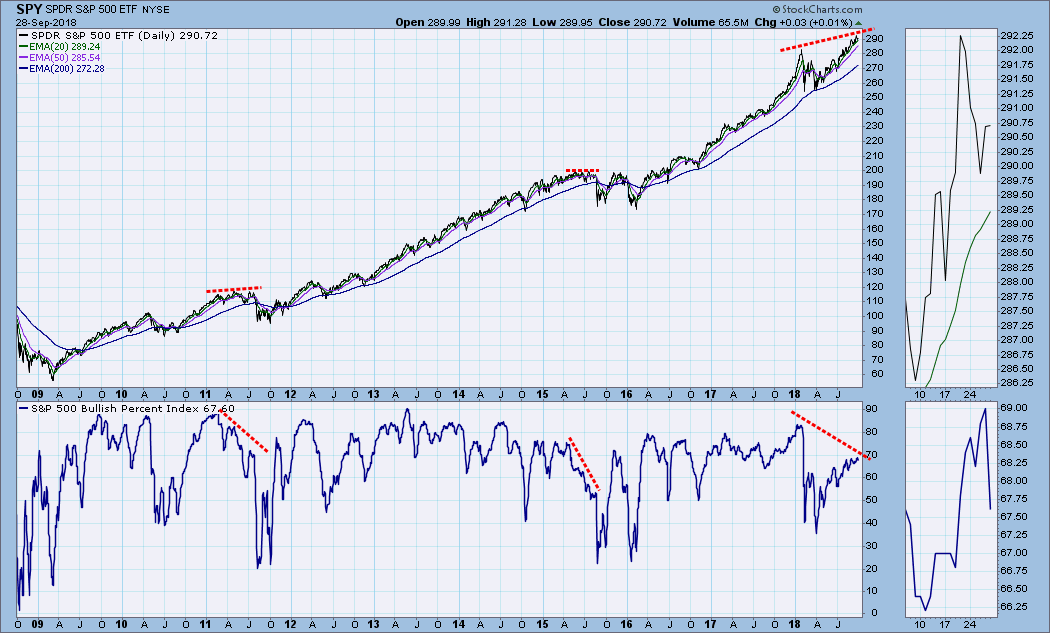
This chart was added almost as an afterthought in last Friday's DP Weekly Wrap, but throughout the week I kept thinking that it should elevated to the lead chart this week. The Bullish Percent Index (BPI) shows the percentage of S&P 500 stocks with point and figure (PnF) BUY signals. I have annotated three significant negative divergences. The first two show the BPI dropping while prices rise or remain flat. This undermining eventually results in sharp price pullbacks. The current divergence is different but still significant. Here prices are pushing to record highs, but the BPI, struggling to reach 68, falls far short of the BPI of 83 back in January, hence, my description Failure to Thrive.
What the BPI is telling us is that fewer stocks are helping to push the index higher, and that the larger-cap stocks are probably doing more of the work. As I said last week, this may not be of immediate concern -- the BPI was at about 60 at the 2000 market highs -- but there is enough of a divergence to discourage complacency in the face of a seemingly bulletproof market.
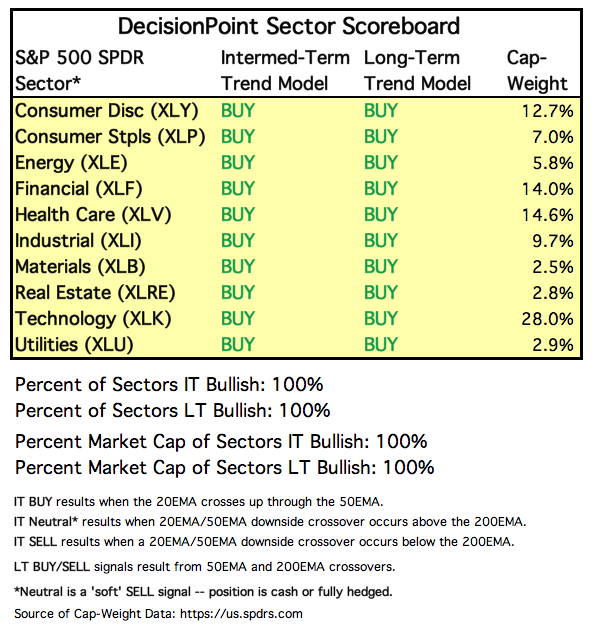
SECTORS
Each S&P 500 Index component stock is assigned to one, and only one, of 10 major sectors. This is a snapshot of the Intermediate-Term and Long-Term Trend Model signal status for those sectors.
STOCKS
IT Trend Model: BUY as of 5/11/2018
LT Trend Model: BUY as of 4/1/2016
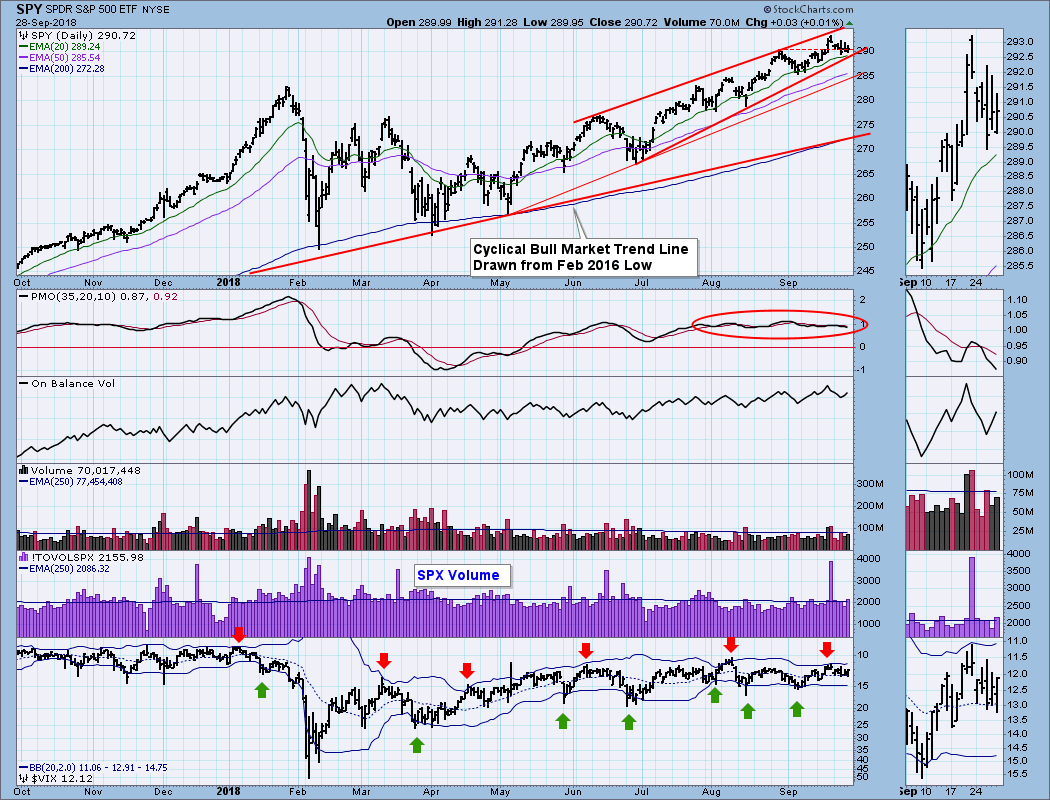
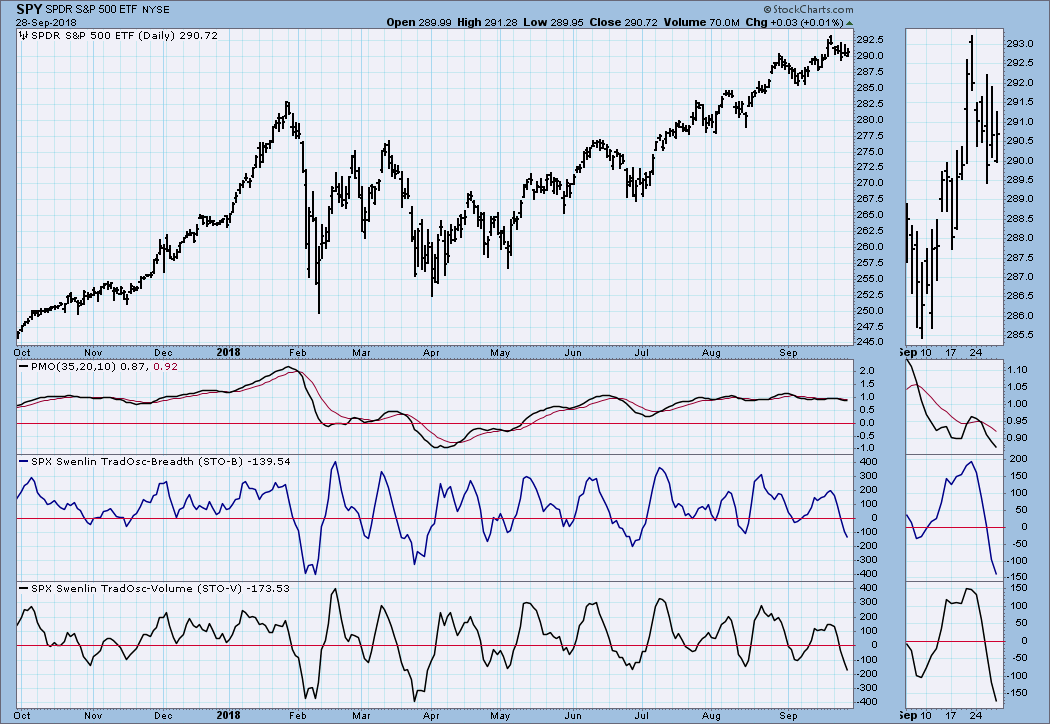
SPY Daily Chart: Last week I observed that price had reached the top of a rising wedge formation, and that the VIX had reached the top Bollinger Band. My conclusion was that there would probably be a short pullback, but that it was unlikely to amount to much. So far that projection has been correct. Now price has nearly reached the bottom of the wedge, and the VIX has reached its 20SMA, which often proves to be support. At this point, I find myself more or less neutral regarding what will happen next in the short term.
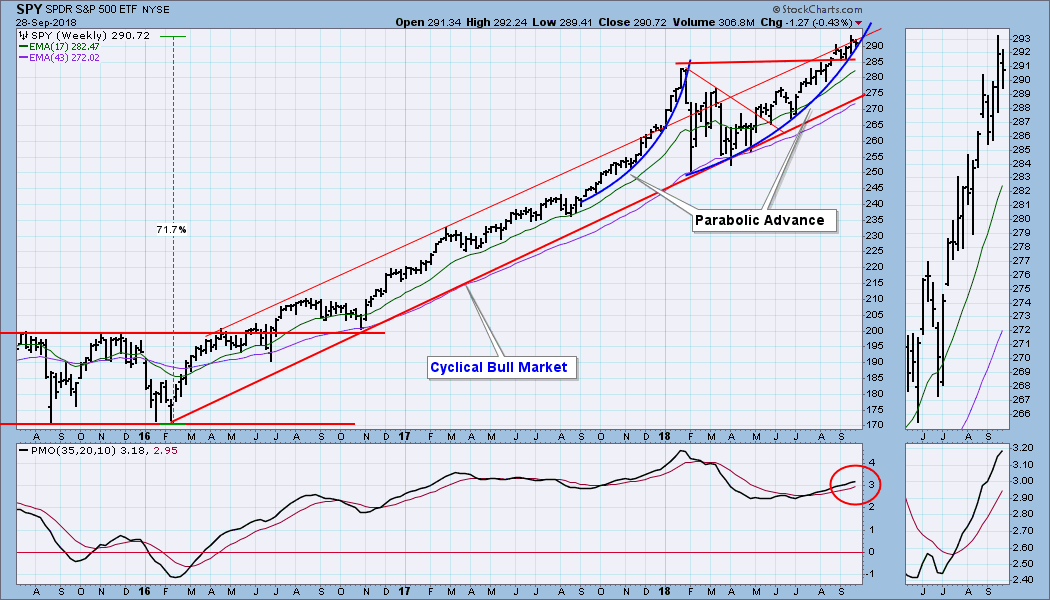
SPY Weekly Chart: Price is pressing the top of the rising trend channel, and it will take less than a -10% decline for price to reach the bottom of the channel; however, the nascent parabolic arc is still forcing price higher.
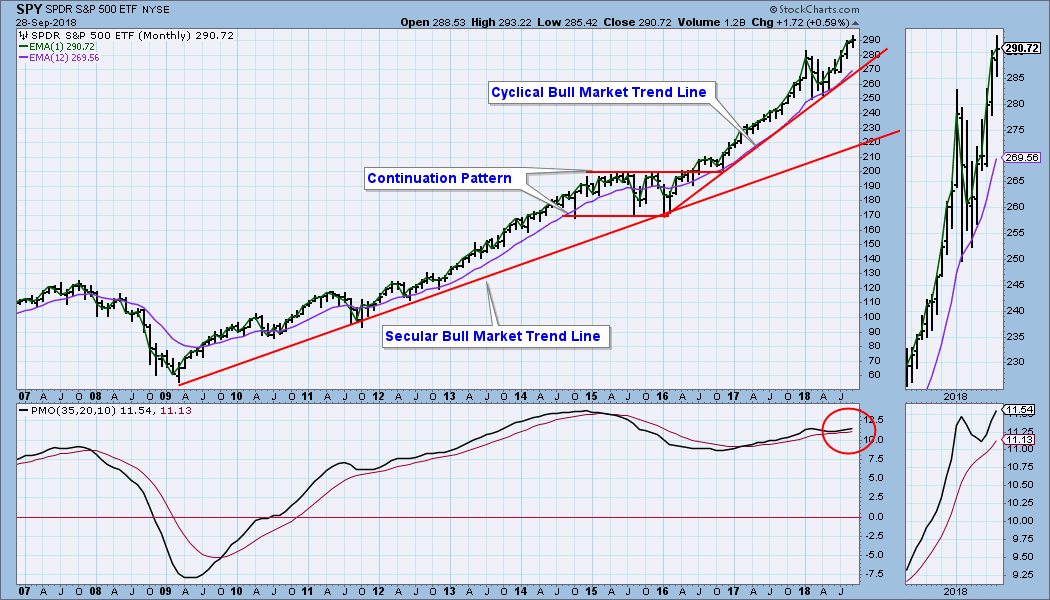
SPY Monthly Chart: This chart is super bullish. Price is well above the secular and cyclical bull market rising trend lines, and the monthly PMO is rising and reflects strong positive momentum. Something of which to make note, price is about 25% above the secular rising trend line. Such a large departure demands a correction eventually, but the positive aspect is that a cyclical bear market of a healthy -20% would still leave price above the secular trend line.
Short-Term Market Indicators: Based upon their range for the last six months, the STO-B and STO-V are both oversold. This fact favors a short-term rally.
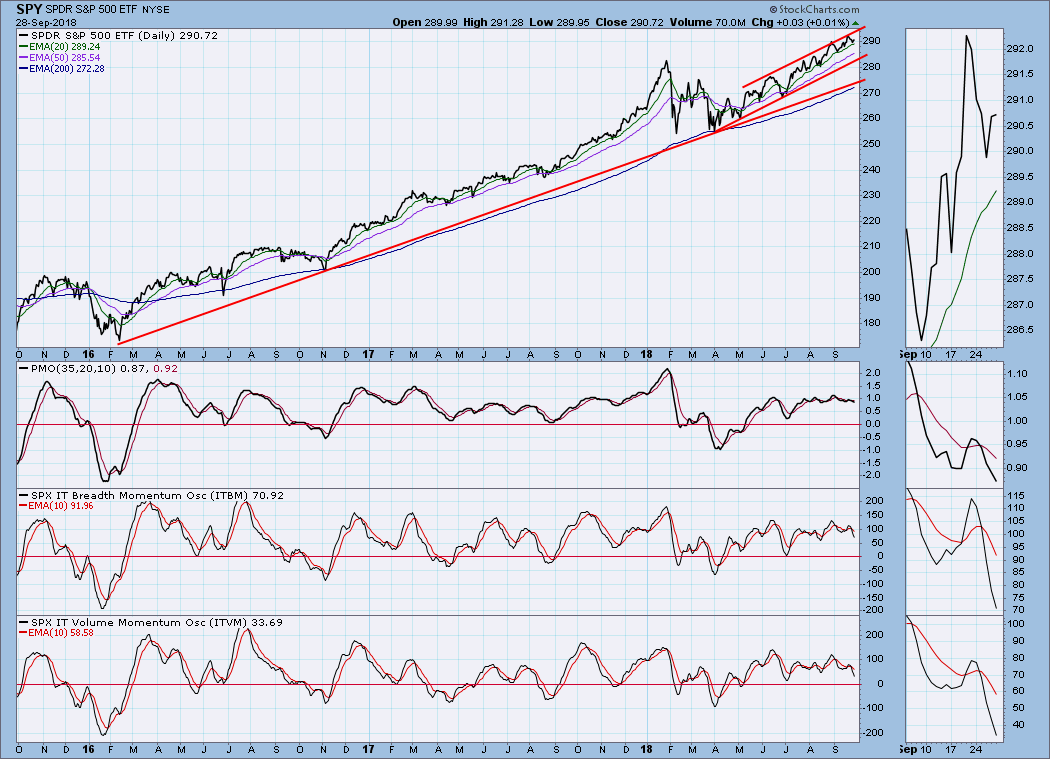
Intermediate-Term Market Indicators: These indicators range from slightly overbought to neutral. They are all headed lower toward the zero line, but I'm not getting any red flares from what I see.
CONCLUSION: The parabolic advance on the SPY chart that I have been tracking looks to be on the verge of resolution -- arcing higher or breaking down. Maybe next week we'll get the answer. The BPI issue discussed above jumped out at me last week, and, after a week of contemplation, it still seems important. It may not be a signal to take any specific action, but it could confirm other bearish indications. For example, if the market begins to show weakness and you're looking for a technical reason why it is, this is it.
 News
News  Market Data
  Discover