(Gold) Weekly/Monthly Wrap: Daily, Weekly & Monthly Charts By: Carl Swenlin | December 28, 2018
IT Trend Model: BUY as of 10/19/2018
LT Trend Model: SELL as of 6/22/2018
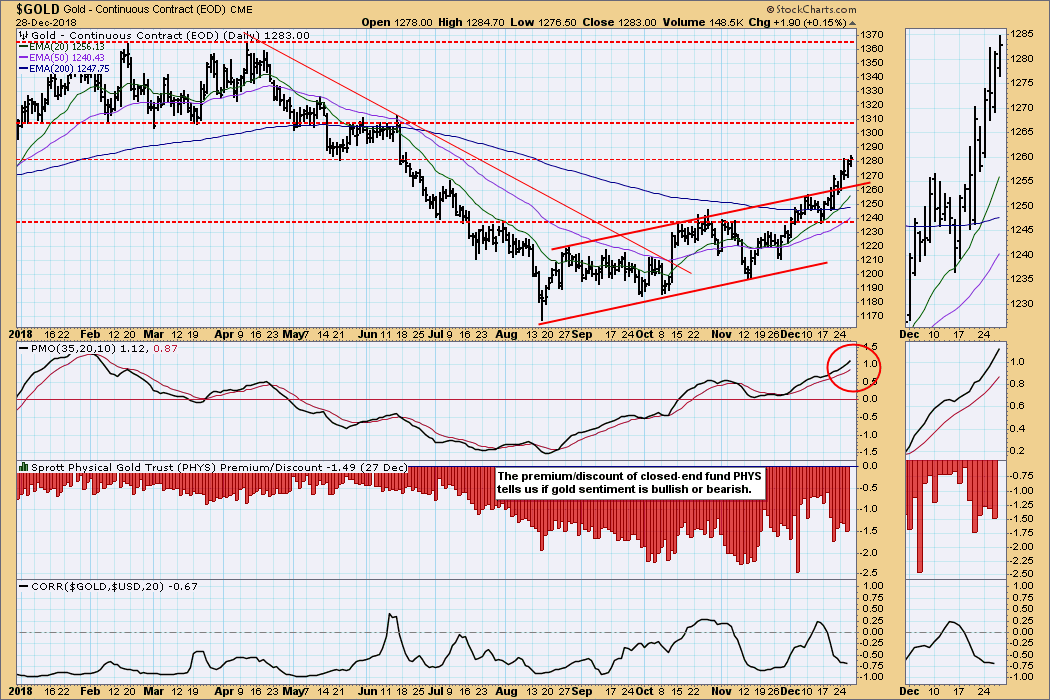
GOLD Daily Chart: Gold has broken out of a rising trend channel, and the daily PMO is positive in every way. The advance from the November low is a bit steeper than that to which we have become accustomed, so a small correction may be in the cards. However, the dollar is looking weak, and we can expect gold to benefit.
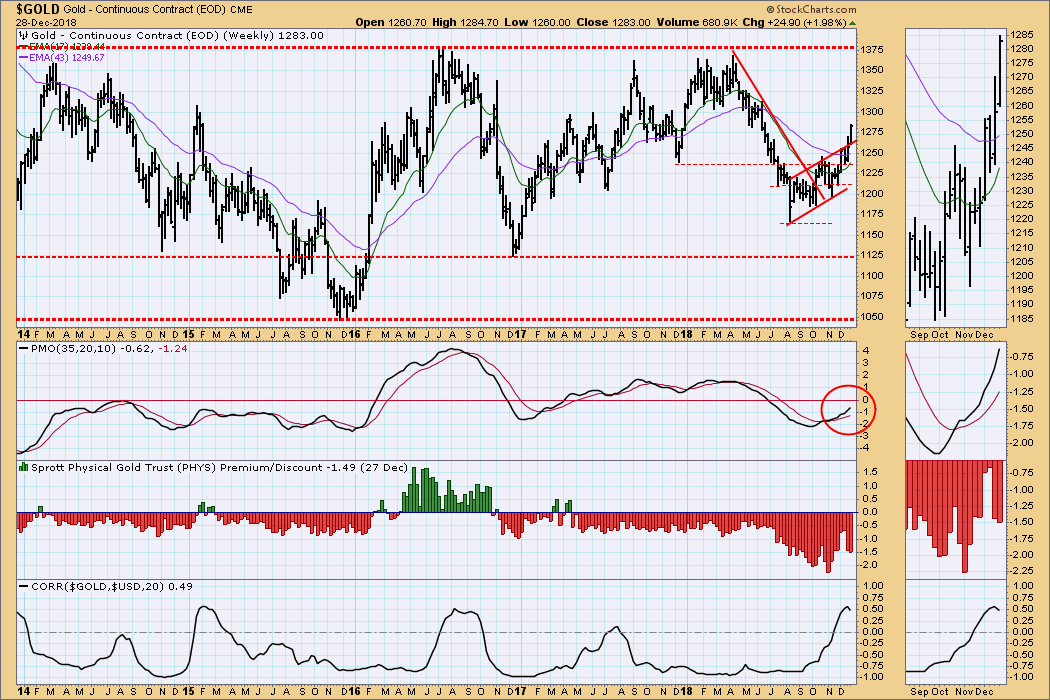
GOLD Weekly Chart: I have been tentatively interpreting the rising trend formation (from the August low) as a bearish reverse flag, but this week's breakout is quite bullish.
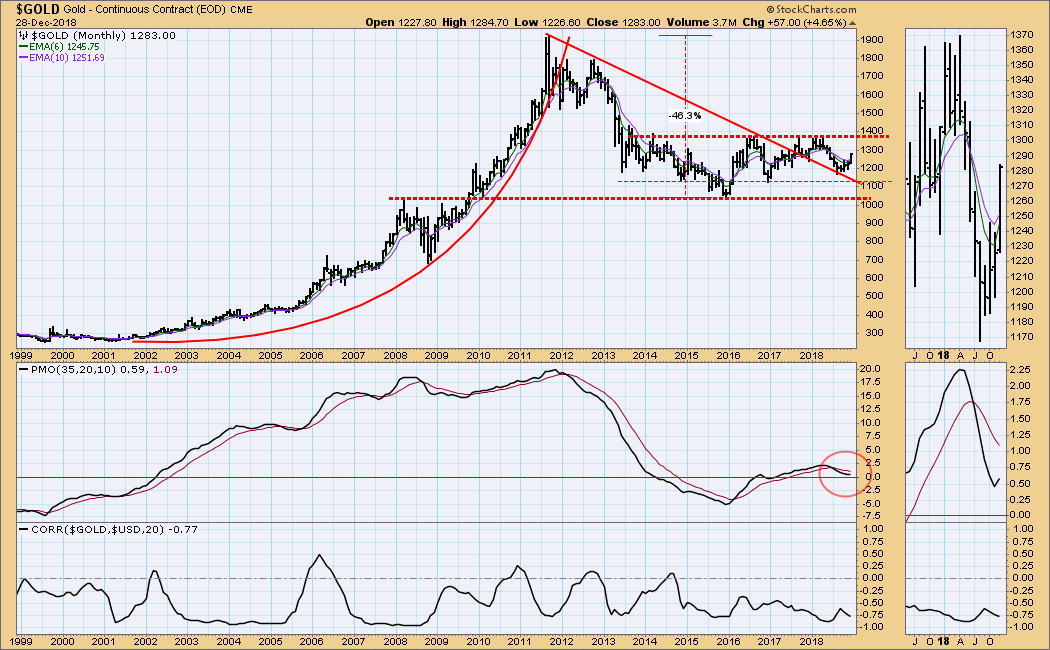
$GOLD Monthly Chart: Gold remains in a five year trading range. Note that it turned up before it reached the bottom of the range, which is bullish. The monthly PMO turned up this month, and that is a very good sign.
 News
News  Market Data
  Discover