


| Followers | 679 |
| Posts | 140715 |
| Boards Moderated | 37 |
| Alias Born | 03/10/2004 |
Saturday, January 13, 2018 10:10:37 AM
By: Carl Swenlin | January 12, 2018
IT Trend Model: BUY as of 1/2/2018
LT Trend Model: BUY as of 4/12/2017
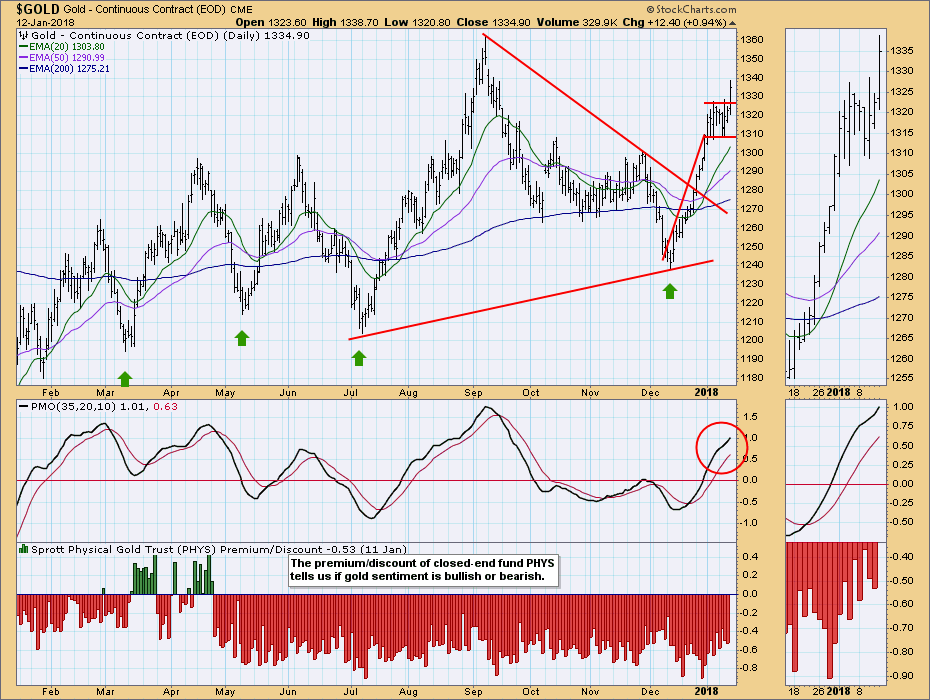
Daily Chart: Gold broke out of a flag formation on Friday, which projects a 70 point move from the top of the flag -- to about 1395.
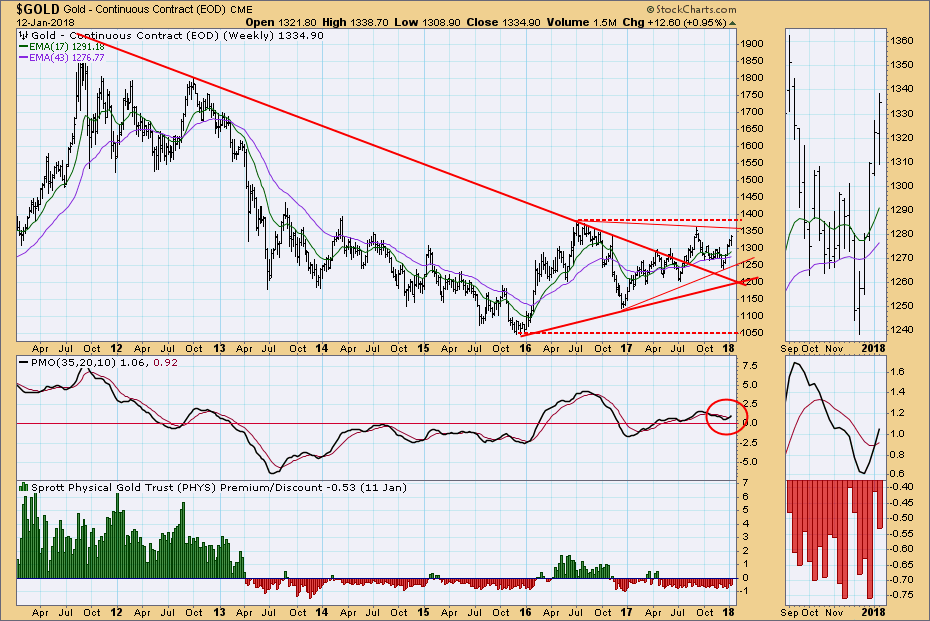
Weekly Chart: The weekly PMO is above the signal line and rising. Overhead resistance will come into play at about 1350 and 1380. A break above 1380 will exceed the 2016 top, and that action will establish a long-term rising trend off the bear market low in 2015. . .
* * *
http://stockcharts.com/articles/decisionpoint/2018/01/dp-weekly-wrap-zoom.html
• DiscoverGold
Click on "In reply to", for Authors past commentaries
Information posted to this board is not meant to suggest any specific action, but to point out the technical signs that can help our readers make their own specific decisions. Your Due Dilegence is a must!
• DiscoverGold
Recent GDX News
- YieldMax GDXY Name Change • GlobeNewswire Inc. • 01/25/2024 04:22:00 PM
- Surging S&P 500 Breadth • ValueWalk • 07/19/2023 03:16:37 PM
- S&P 500 Corrects In Breadth • ValueWalk • 07/18/2023 03:08:49 PM
- If The USDX Fell So Much, Why Didn’t Gold Truly Soar? • ValueWalk • 07/17/2023 05:16:20 PM
- USD’s Decline That’s… Bearish For Gold?! • ValueWalk • 07/12/2023 02:38:08 PM
- S&P 500 Late Day Reversal Worry • ValueWalk • 07/10/2023 03:17:34 PM
- Massive Gaming Celebrates Global Launch of House of Blackjack with USDC Earning Race • ValueWalk • 07/10/2023 02:44:17 PM
- Breathers In Mining Stocks Are Not Real Rallies • ValueWalk • 07/06/2023 05:20:55 PM
- S&P 500 Character Changes • ValueWalk • 07/06/2023 03:10:06 PM
- S&P 500 – As Bullish As It Gets • ValueWalk • 07/03/2023 04:01:21 PM
- The Great Gold Migration: How Asia Is Dominating The Global Gold Landscape • ValueWalk • 06/30/2023 05:07:35 PM
- S&P 500 Dip Buying And Tame PCE • ValueWalk • 06/30/2023 03:34:13 PM
- The Bullish Reversal In Gold Is Coming • ValueWalk • 06/29/2023 04:00:44 PM
- Insufficient S&P 500 Rotations • ValueWalk • 06/27/2023 02:41:42 PM
- Failing S&P 500 Rotations • ValueWalk • 06/23/2023 03:09:19 PM
- Countdown to S&P 500 Downleg • ValueWalk • 06/19/2023 01:49:20 PM
- Now THAT Was The Game-Changer For The Price Of Gold! • ValueWalk • 06/15/2023 04:40:35 PM
- S&P 500 Manages To Recover Initial Decline • ValueWalk • 06/15/2023 03:30:07 PM
- S&P 500 Manages To Recover From Tech-Driven Decline • ValueWalk • 06/15/2023 03:30:07 PM
- S&P 500 Withstands The Initial Selling – No Hike Tomorrow • ValueWalk • 06/13/2023 03:15:19 PM
- Roadmap For Mining Stocks – Courtesy Of The Stock Market • ValueWalk • 06/06/2023 03:17:49 PM
- Stocks To Still Extend S&P 500 Upswing • ValueWalk • 06/05/2023 03:31:02 PM
- AI, Stocks, And Gold Stocks – Connected After All • ValueWalk • 05/31/2023 03:29:15 PM
- Could Gold Miners Finally Stop Sliding?! • ValueWalk • 05/26/2023 08:42:37 PM
- S&P 500 Fine Selling Initiative • ValueWalk • 05/24/2023 03:06:00 PM
VPR Brands LP Reports Record Annual Financial Performance for Fiscal Year 2023 • VPRB • Apr 19, 2024 11:24 AM
Coinllectibles' Subsidiary, Grand Town Development Limited, Acquires Rare Song Dynasty Ceramics Worth Over USD28million • COSG • Apr 18, 2024 8:03 AM
ILUS Provides Form 10-K Filing Update • ILUS • Apr 17, 2024 9:54 AM
Glucotrack Announces Expansion of Its Continuous Glucose Monitoring Technology to Epidural Glucose Monitoring • GCTK • Apr 17, 2024 8:00 AM
Maybacks Global Entertainment To Fire Up 24 New Stations in Louisiana • AHRO • Apr 16, 2024 1:30 PM
Cannabix Technologies Begins Certification of Contactless Alcohol Breathalyzer, Re-Brands product series to Breath Logix • BLOZF • Apr 16, 2024 8:52 AM

