GOLD - Weekly Wrap • • • By Carl Swenlin | August 4, 2017
GOLD
IT Trend Model: BUY as of 7/31/2017
LT Trend Model: BUY as of 4/12/2017
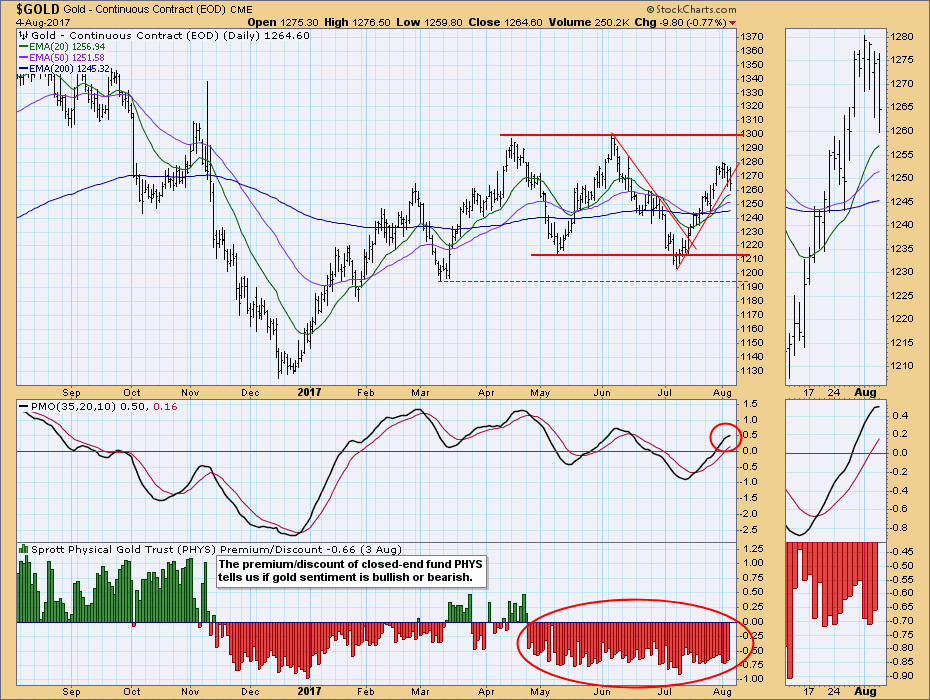
Gold has violated the rising trend line drawn from the July low, and it has topped below the top of the trading range. The reason for this will become apparent when the weekly chart is reviewed, but on this daily chart it is starting to look as if a rounded top is forming. Friday's breakdown was caused by the dollar (UUP) getting a strong bounce. If that continues next week, gold will be in trouble.
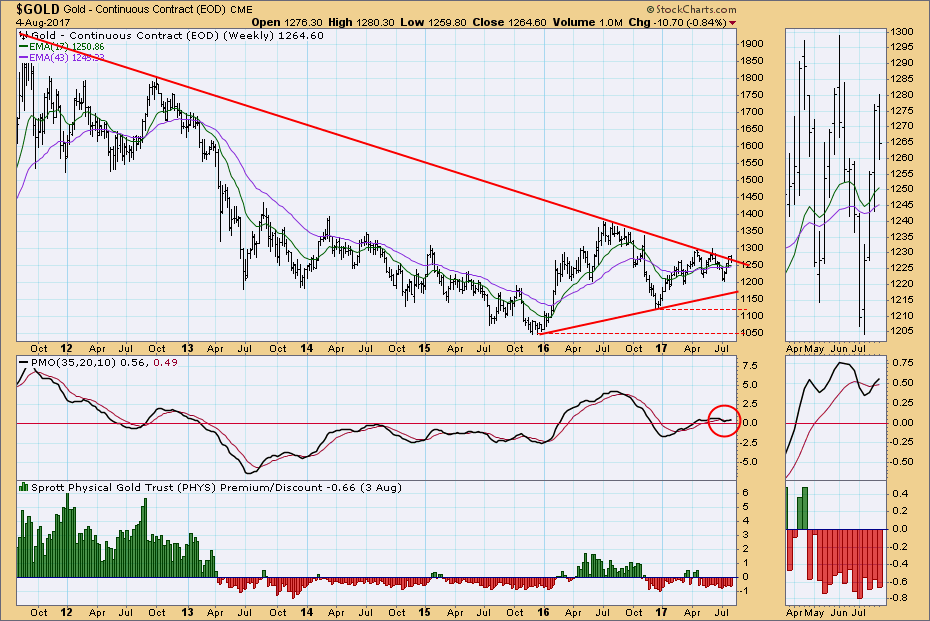
For the third time this year gold failed to break above the long-term declining tops line. The weekly PMO is rising above the signal line, but in the bigger picture it has been flat for four months. This chart is neutral to slightly bullish.
 News
News  Market Data
  Discover