DP Alert: All-Time Highs Create New Support Level for SPY By Erin Heim | July 18, 2017
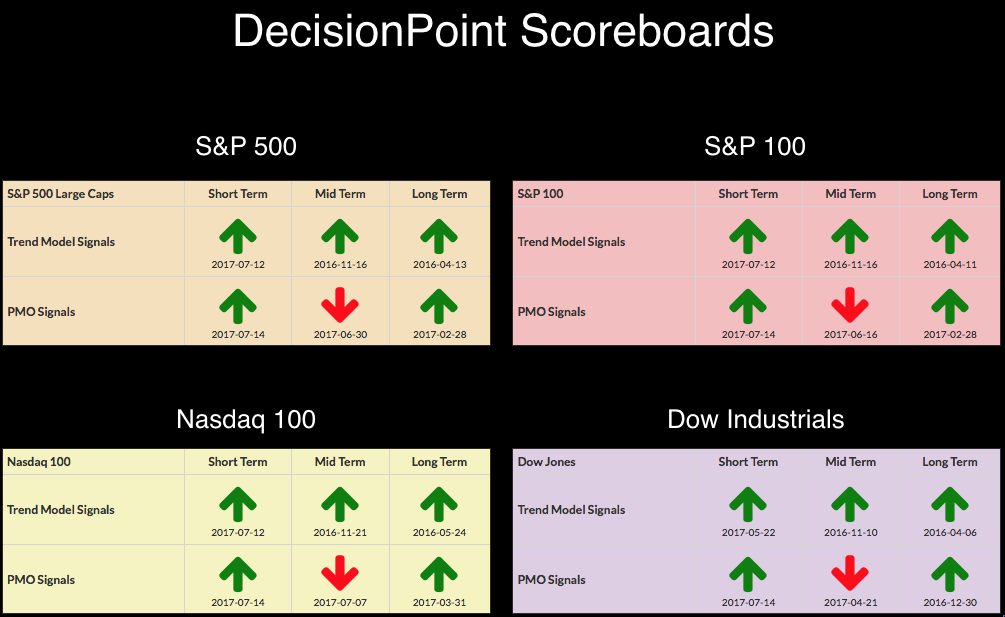
No new changes to report on the DecisionPoint Scoreboards, although if you didn't read about it last Friday, we did see FOUR new PMO BUY signals on all four indexes. The only "red" on the Scoreboards are on the IT PMO signals which are found on the weekly charts. You can take a look at all of the Scoreboard weekly charts annotated in the DecisionPoint ChartList.
SIGNALS: Here we include charts of any important signal changes triggered today by our Intermediate-Term Trend Model.
NO NEW SIGNALS TO REPORT.
STOCKS
IT Trend Model: BUY as of 11/15/2016
LT Trend Model: BUY as of 4/1/2016
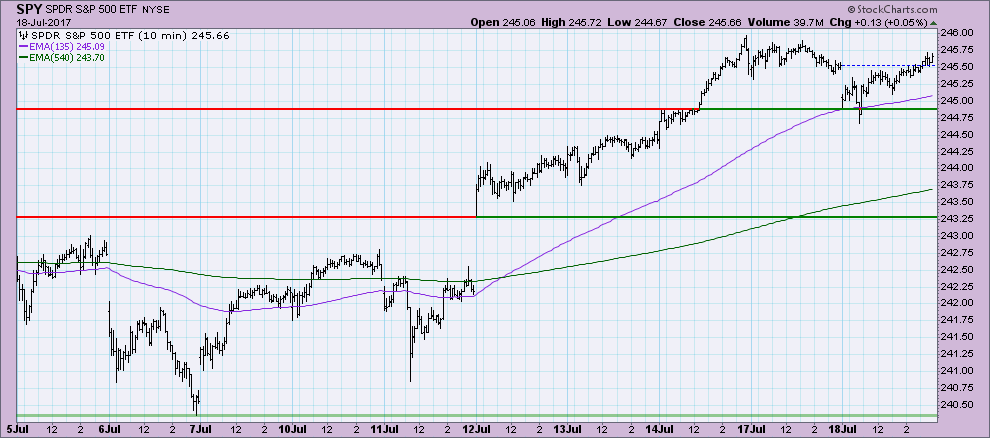
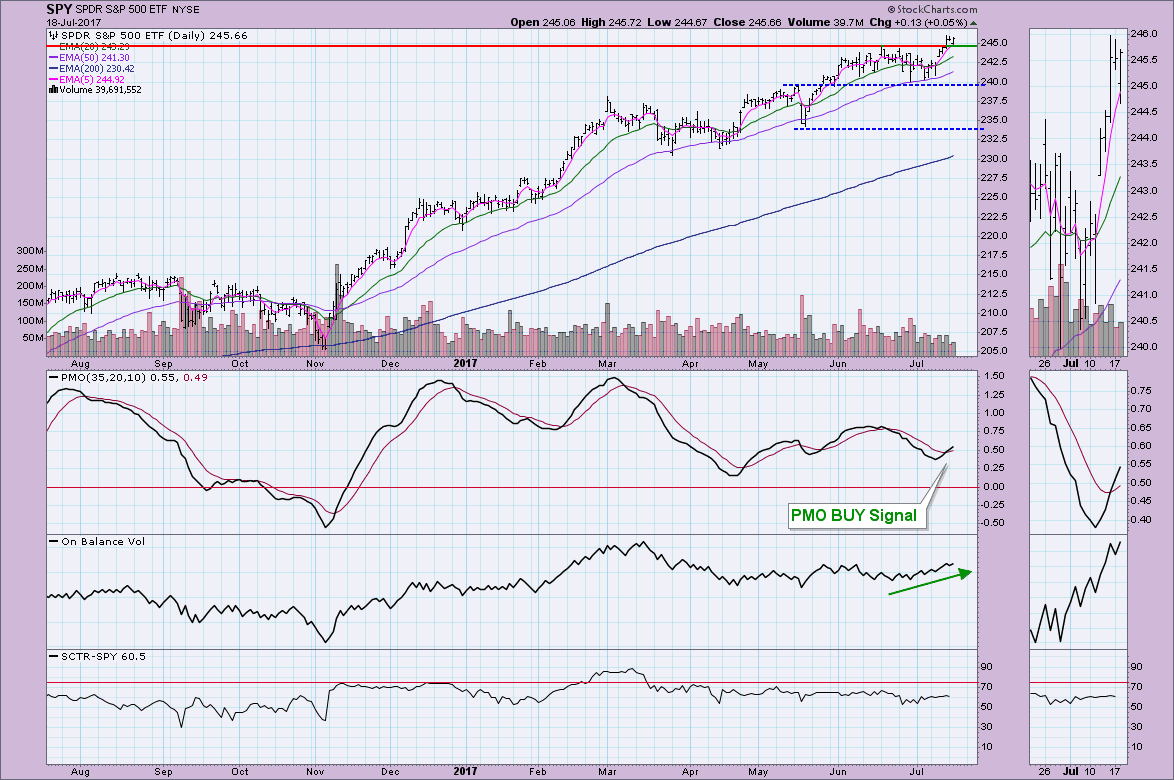
Price broke through previous all-time highs and established a new one at around $245 for the SPY.
So far that new support level is holding. As noted on the Scoreboards, we can see a new PMO BUY signal for the SPY that aligns with the SPX PMO BUY signal. The OBV is showing a bullish confirmation of the current rally.
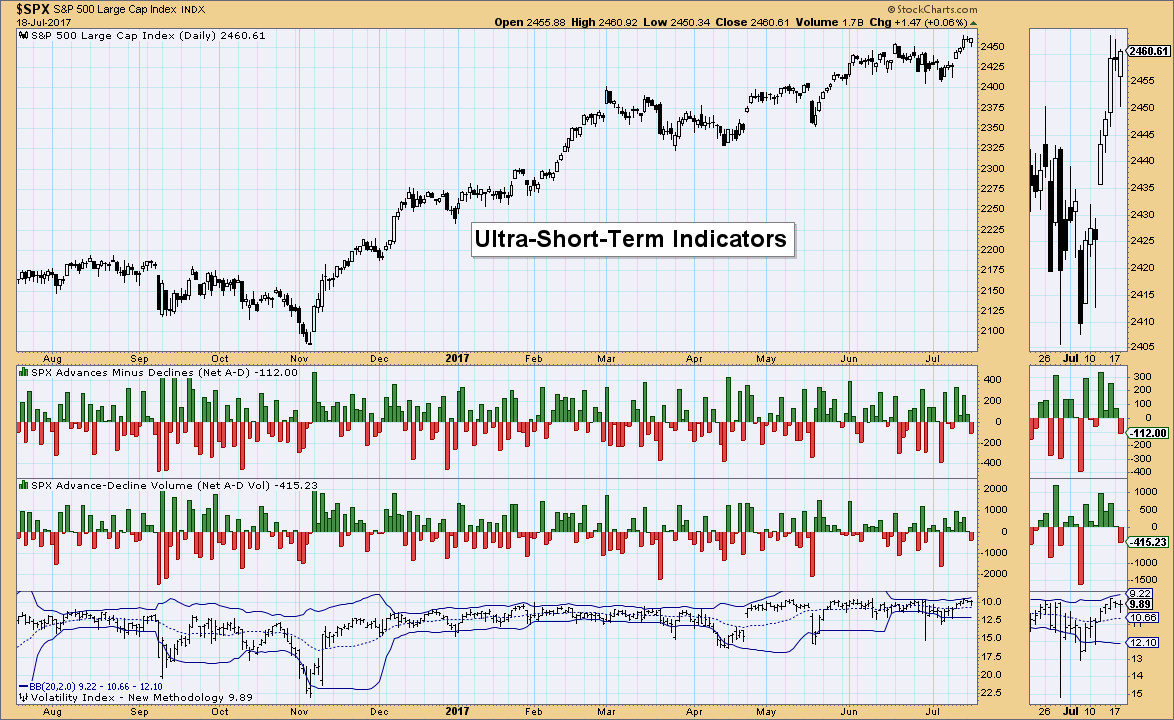
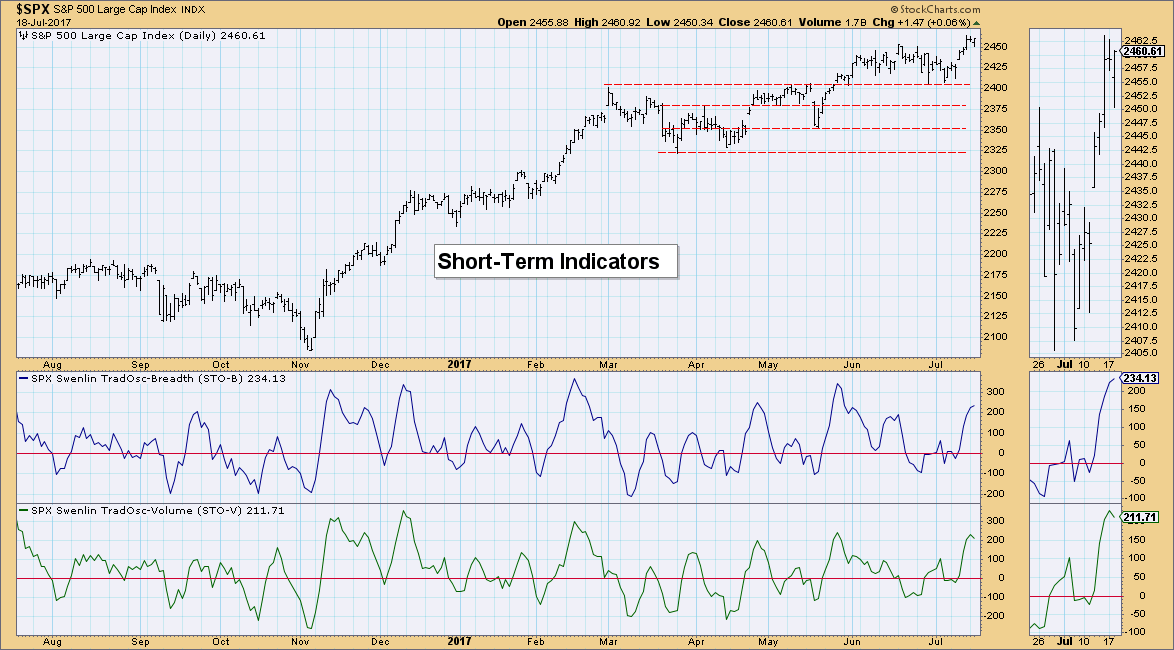
Ultra-Short-Term Indicators: We saw some elevated readings last week, but so far breadth is quiet this week. I like to see climactic readings and with the VIX in a compressed Bollinger Band and breadth not very one-sided and hence don't provide much information, at least right now.
Short-Term Indicators: I was actually somewhat surprised to see that our short-term indicators are beginning to turn over in somewhat overbought territory. This is bearish short term.
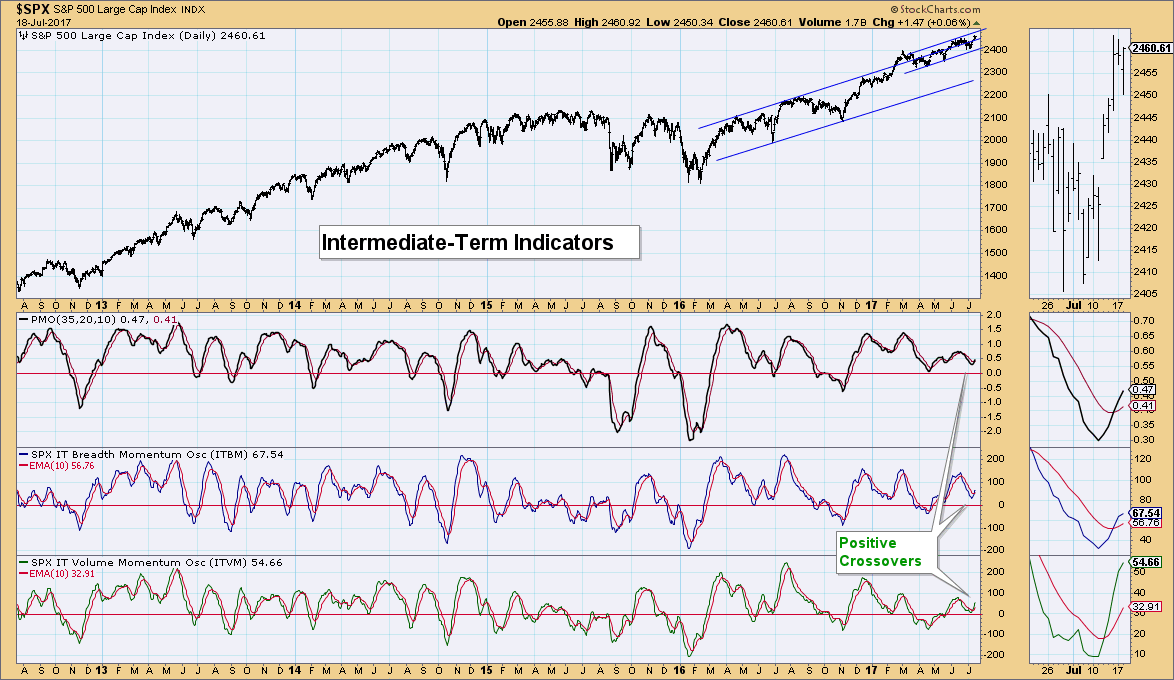
Intermediate-Term Indicators: On the other hand, intermediate-term indicators are looking pretty good. We've now seen a positive crossover for both (including the PMO) and it has happened above the zero line which is bullish.
Conclusion: The market has made new highs and seems to be holding above support at about $245. Short-term indicators are somewhat overbought and turning over. Yet, intermediate-term indicators are looking bullish. I suspect this means a pullback or consolidation in the short term, followed by a resumption of the rally based on the intermediate-term indicators.
DOLLAR
IT Trend Model: NEUTRAL as of 3/21/2016
LT Trend Model: SELL as of 05/24/2017
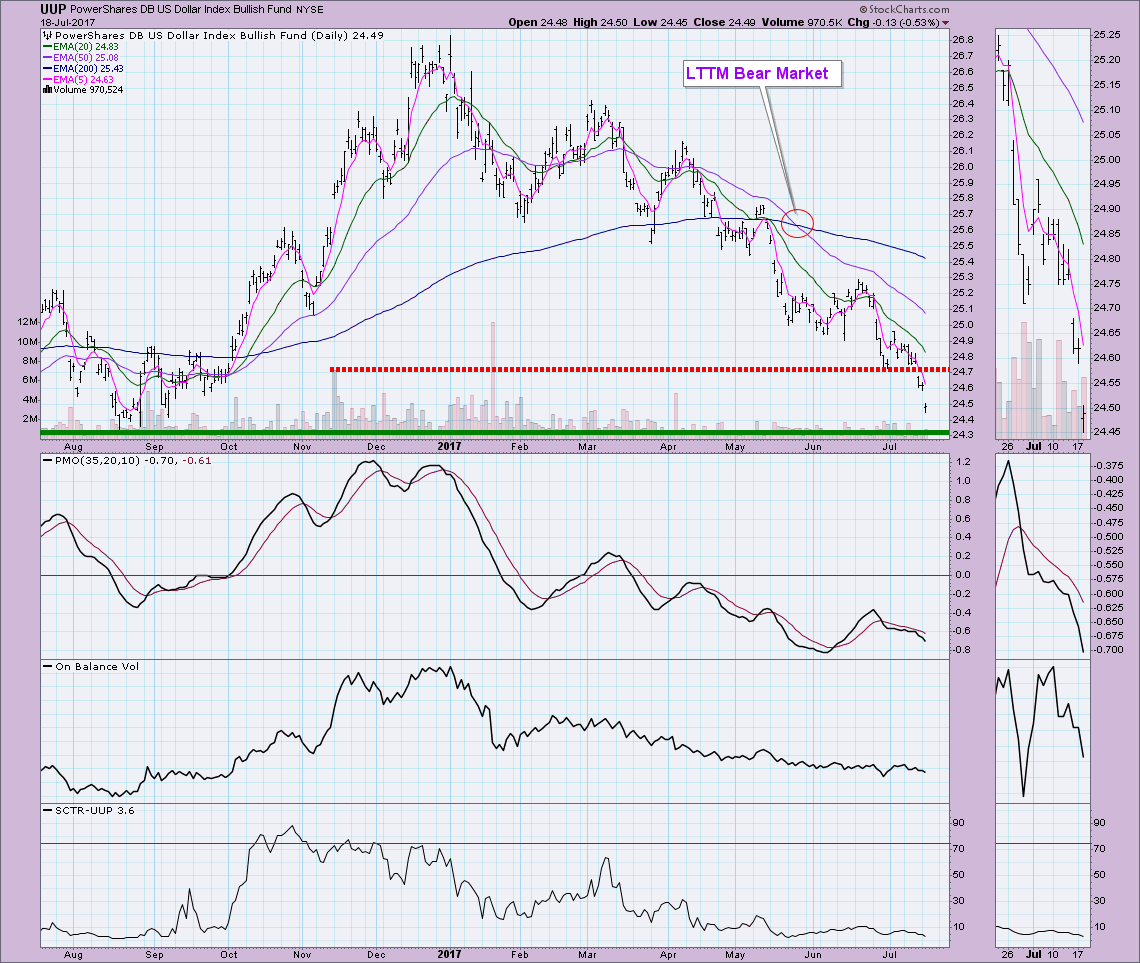
I've been bearish on the Dollar for quite some time and I don't think it is yet time to get bullish. We are nearing support which could mean a bottom is arriving soon. However, the PMO is quite ugly and the OBV is showing a bearish confirmation right now. I think this is as good a place as we've seen in some time to provide support. When the PMO starts to turn, that will probably be the time to get into USO. . .
 News
News  Market Data
  Discover