DP Alert: Rounded Top Concerning - Gold Breaks Through Neckline By Erin Heim | July 11, 2017
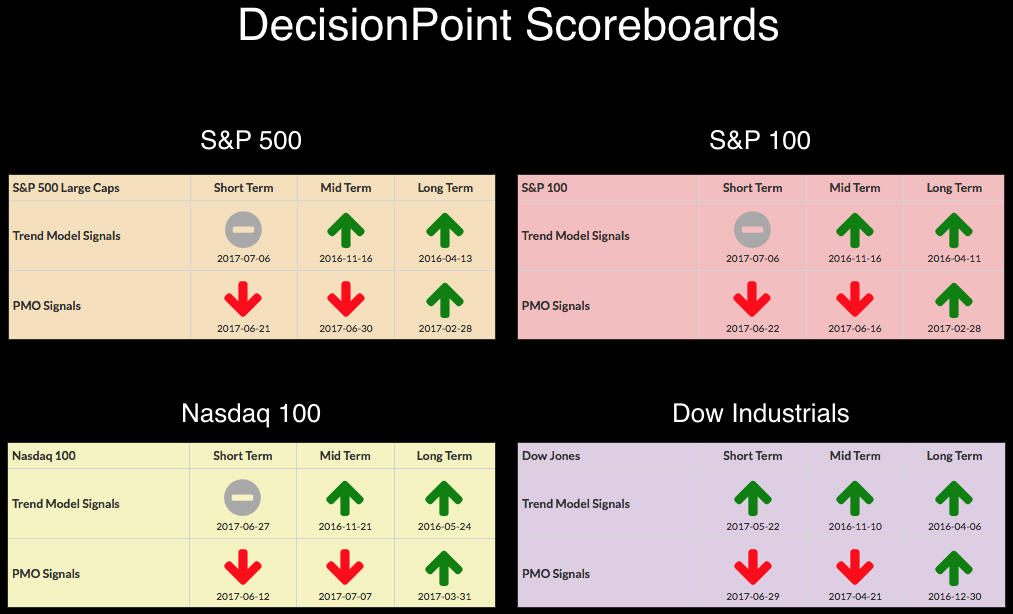
No new signal changes on the DecisionPoint Scoreboards, but we did see three new Intermediate-Term Trend Model (ITTM) Neutral signals generate on three different sectors. Utilities, Consumer Discretionary and Consumer Staples. It's odd to see both Consumer Staples and Discretionary hitting bearish signals, but I think that is a symptom of the rotation of money throughout the various sectors.
SIGNALS: Here we include charts of any important signal changes triggered today by our Intermediate-Term Trend Model.
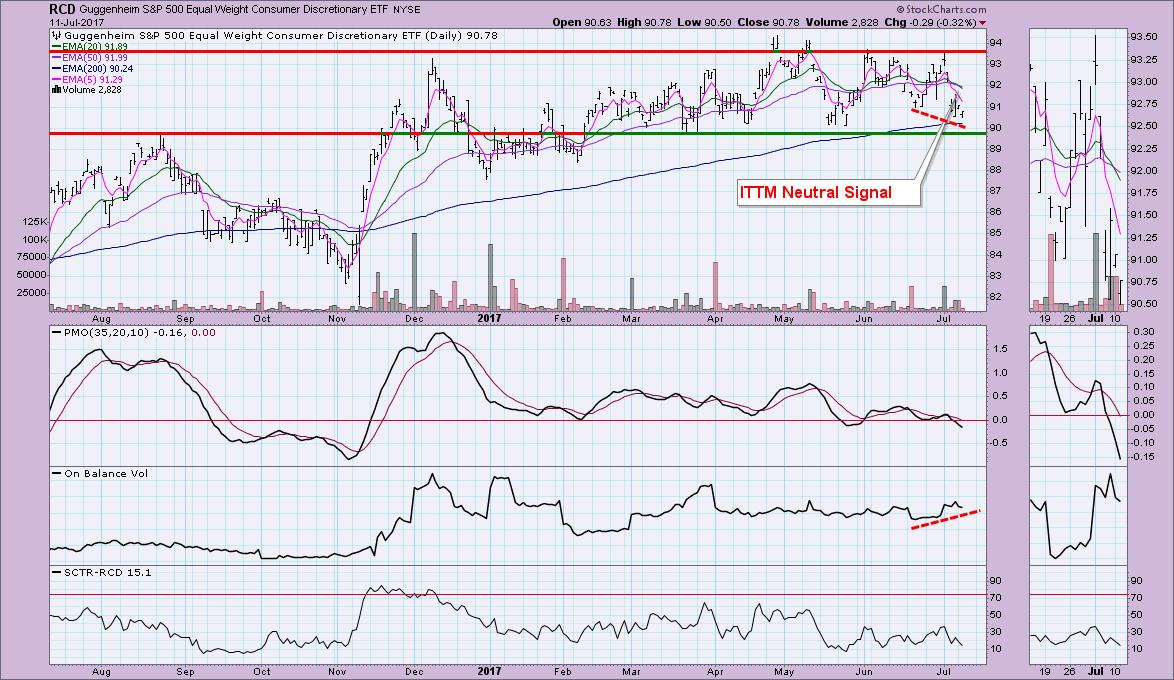
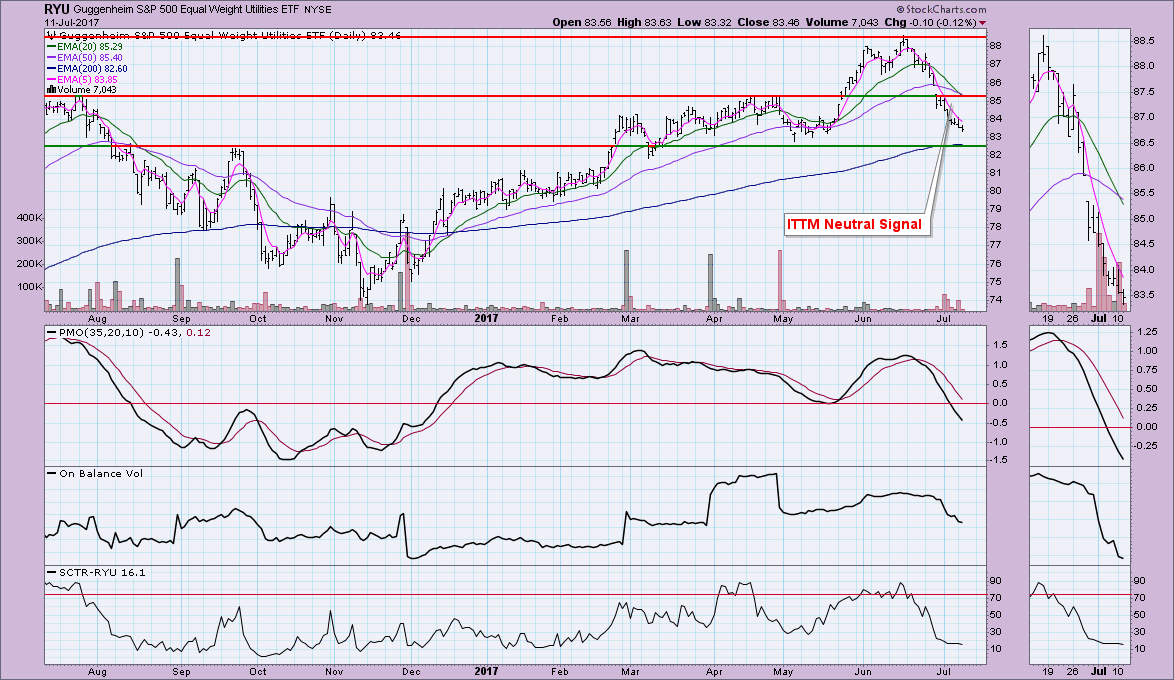
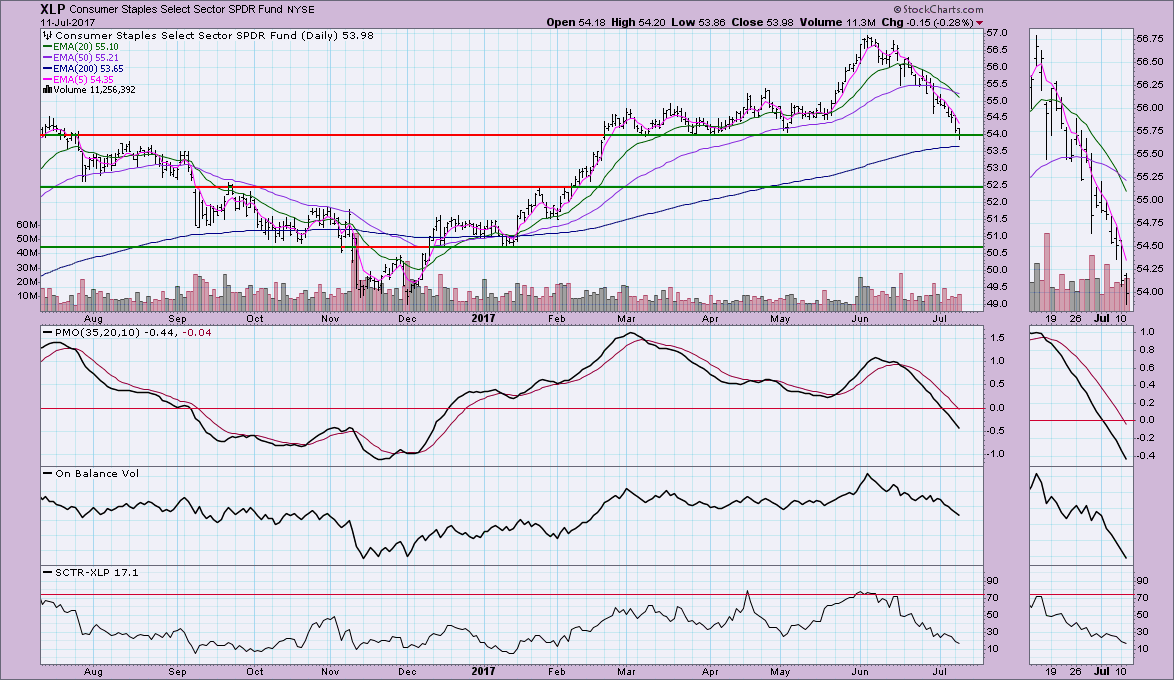
There were three new Intermediate-Term Trend Model signal changes to report from the last two days. The equal-weight Utilities ETF (RYU), the equal-weight Consumer Discretionary ETF (RCD) and the Consumer Staples SPDR (XLP) all logged ITTM Neutral signals today.
RCD probably has the most opportunity to wiggle its way out of this Neutral signal. The 20-EMA is very close to the 50-EMA, so another crossover is certainly possible. However, I like that price is now at very strong support and I see a positive divergence between OBV bottoms and price bottoms.
Neither RYU or XLP look favorable. At least RYU is nearing important support that could possibly hold. You can see the negative 20/50-EMA crossover that generated the ITTM Neutral signal.
Like RYU, there's nothing very positive about this chart. It appears that strong support at $54 is about to be broken. The indicators are all very negative.
STOCKS
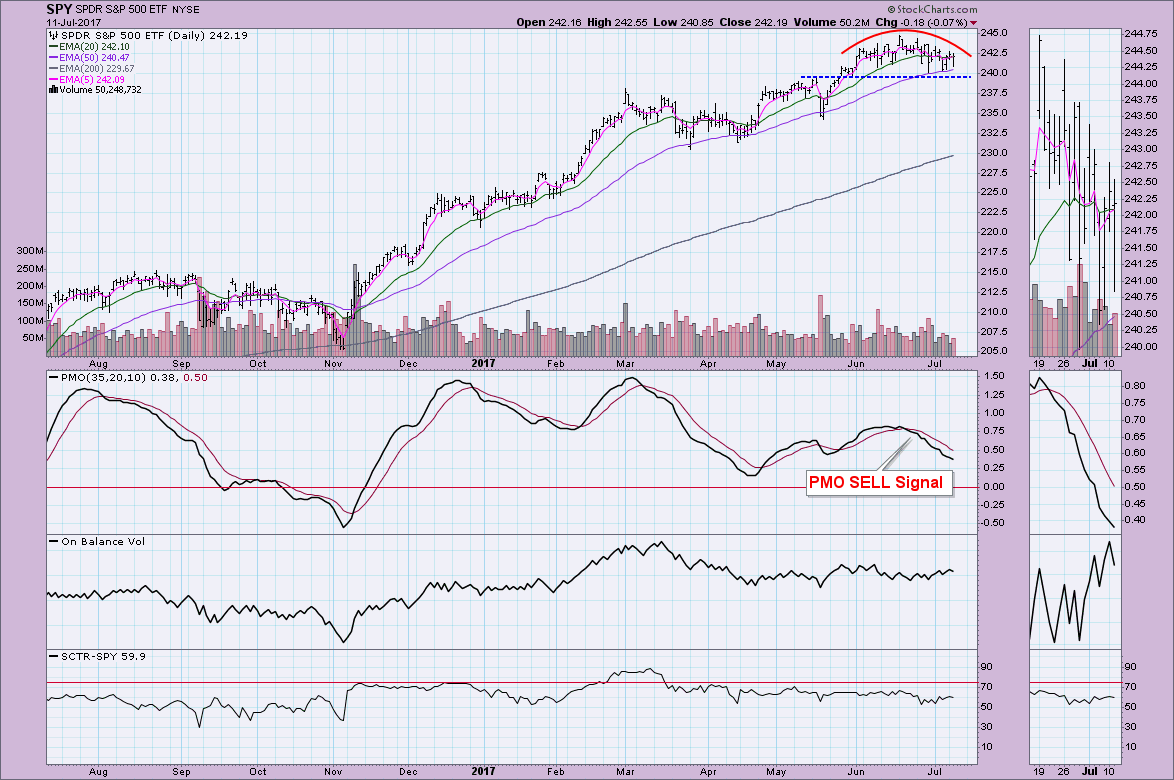
IT Trend Model: BUY as of 11/15/2016
LT Trend Model: BUY as of 4/1/2016
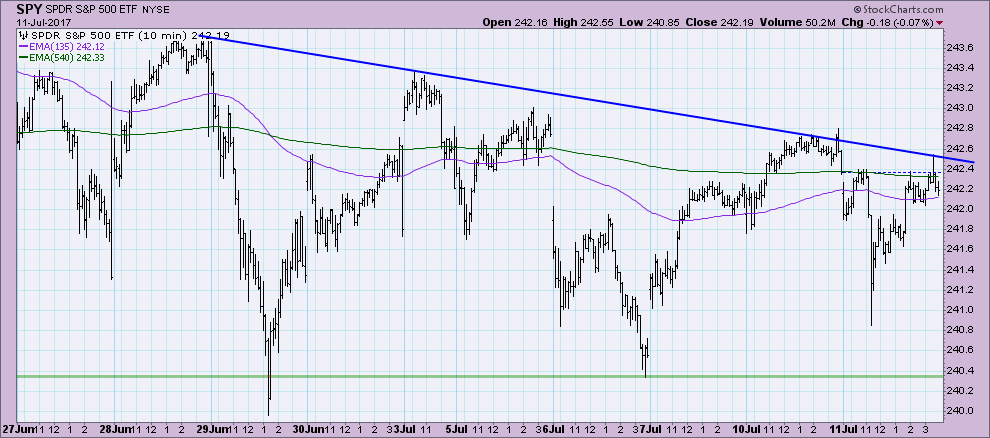
The 10-minute bar charts shows a steady declining tops line that is forming strong resistance.
There is a rounded top on the SPY right now that suggests we will see support at $240 broken. The PMO has now traveled past its previous bottom which will set up a negative divergence when it turns back up.
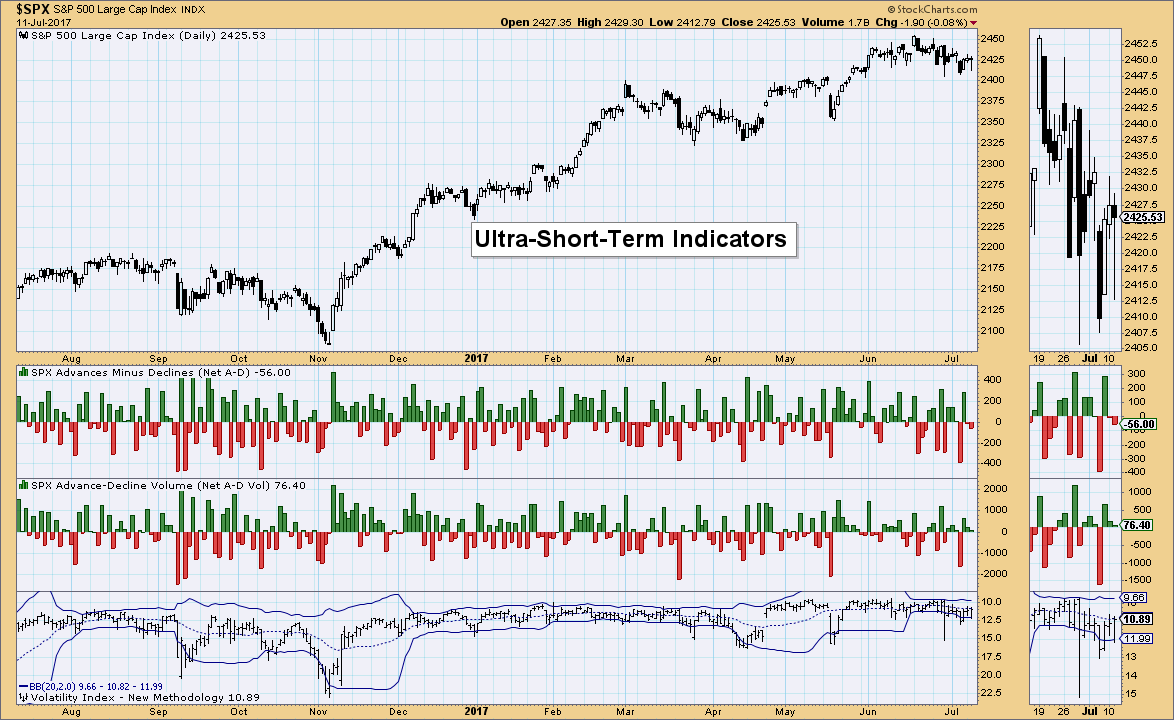
Ultra-Short-Term Indicators: No climactic readings to talk about, although the VIX did penetrate the lower Bollinger Band intraday which could speak to higher prices for part of tomorrow's trading. What we want to see is comparable climactic breadth readings like we had last Thursday. Since we don't see that, I don't think we will see a sustained bounce.
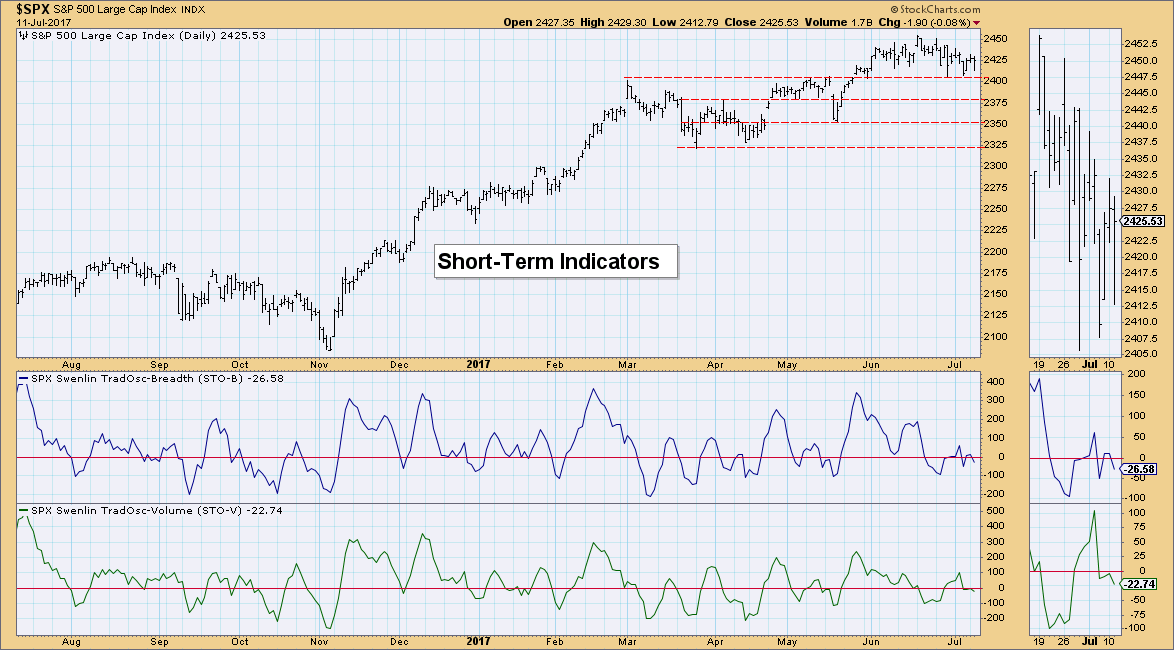
Short-Term Indicators: The market is consolidating so the short-term indicators are replicating that as they wiggle and twitch sideways. We've seen in mid-April and mid-May similar consolidation which concluded with a rally. They're pointed down right now, so I wouldn't be looking for much of a rally just yet.
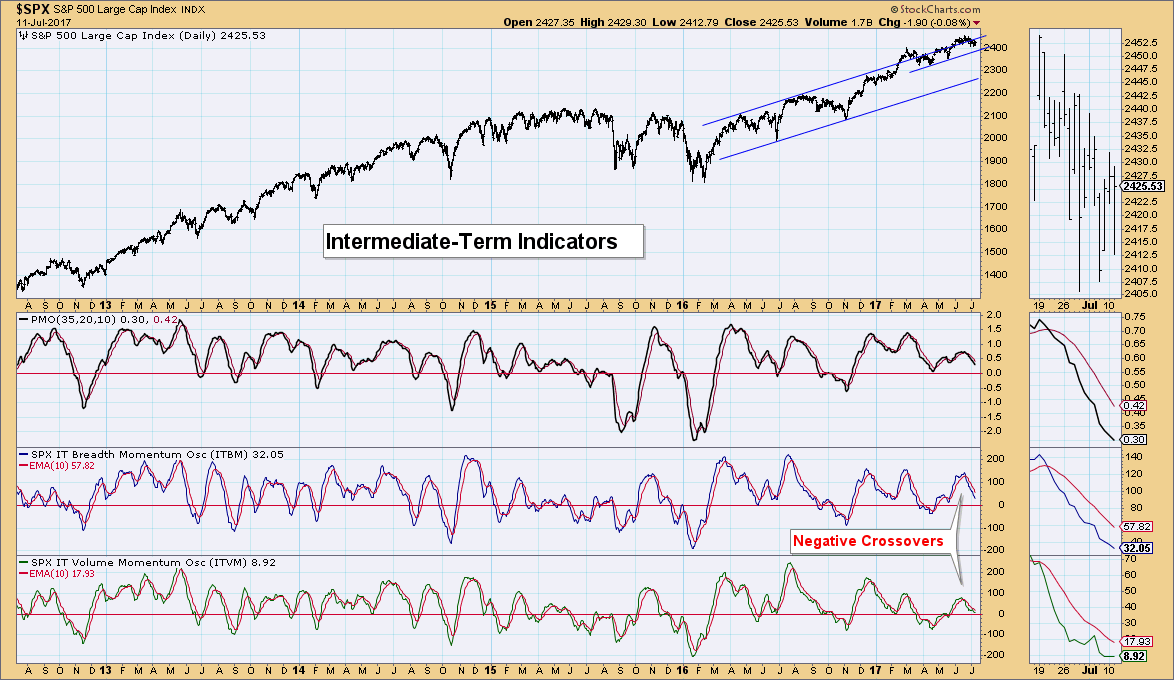
Intermediate-Term Indicators: Although the ITVM is trying to turn up, the overall trend is down. I suspect it will continue to fall until we see readings reach somewhat oversold territory. Until then, I view these as bearish.
Conclusion: Indicators are mixed. Short-term indicators are consolidating which suggests more of the same by price. However, the IT indicators are quite bearish as they sit in neutral and continue to fall. I think best case right now is more consolidation, but the indicators are worrisome, enough so that I am expecting a breakdown below $240 very soon. . .
 News
News  Market Data
  Discover