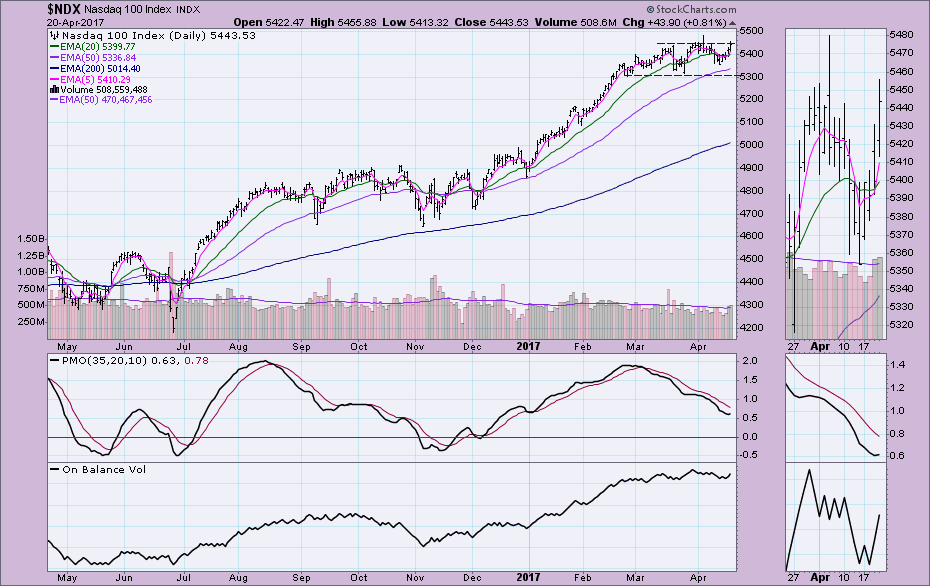
• • •New ST Trend Model BUY for NDX By Erin Heim | April 20, 2017
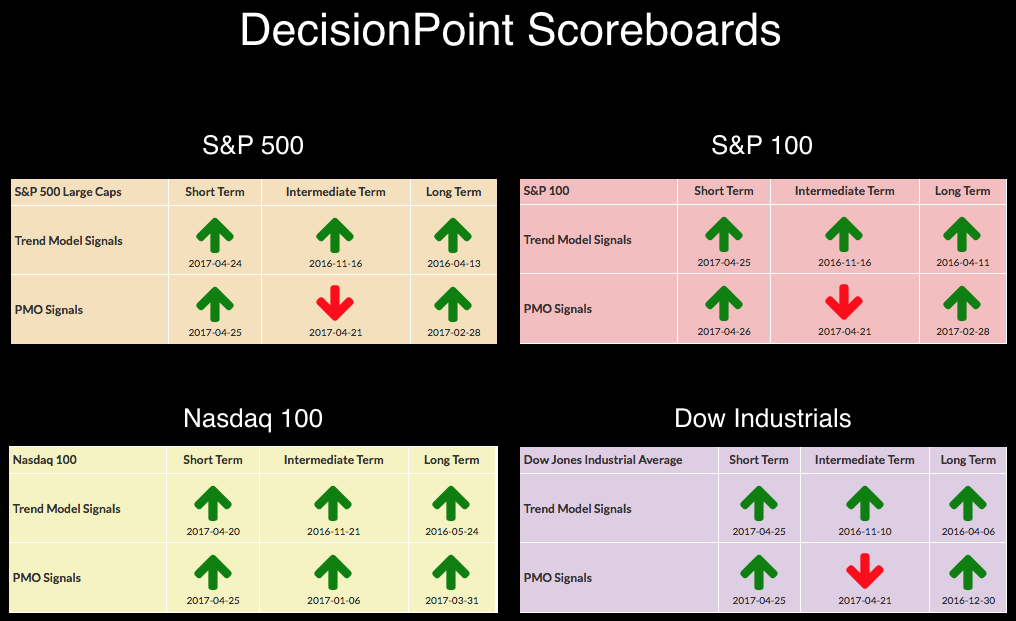
Today the Nasdaq 100 triggered a new Short-Term Trend Model (STTM) BUY signal. This replaces a Neutral signal from exactly one week ago. In the thumbnail of the chart below the DecisionPoint Scoreboards, you can that the Neutral signal was the victim of whipsaw. I've been bearish on the market of late, but looking at NDX price movement, I like the last bottom forming above the previous and a breakout attempt being made to new all-time highs. Note also that the Price Momentum Oscillator (PMO) has now turned up.
The purpose of the DecisionPoint Alert Daily Update is to quickly review the day's action, internal condition, and Trend Model status of the broad market (S&P 500), the nine SPDR Sectors, the U.S. Dollar, Gold, Crude Oil, and Bonds. To ensure that using this daily reference will be quick and painless, we are as brief as possible, and sometimes we let a chart speak for itself.
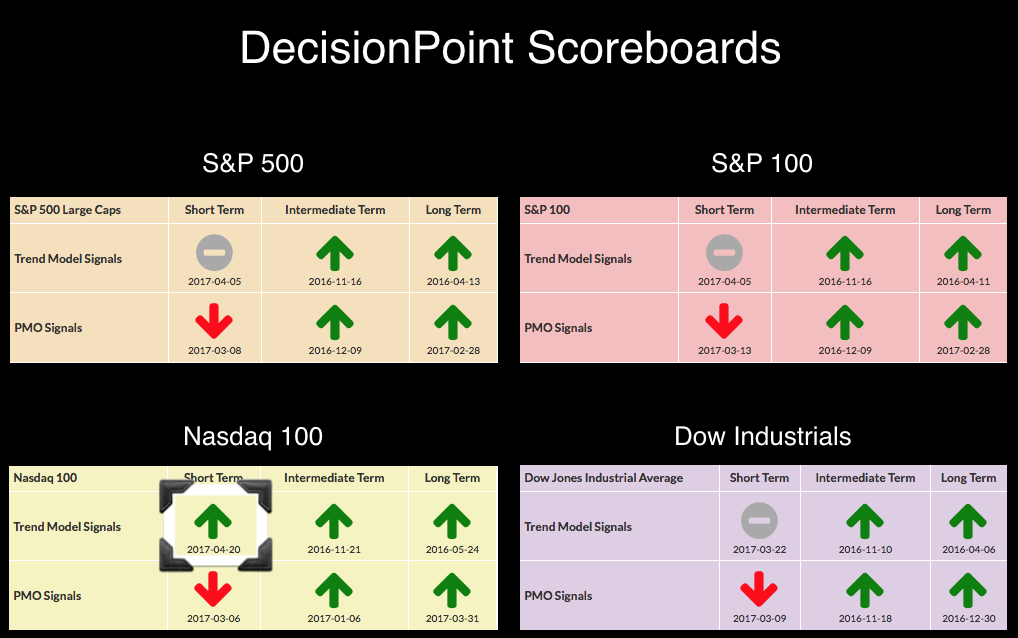
STOCKS: Based upon a 11/15/2016 Intermediate-Term Trend Model BUY signal, our current intermediate-term market posture for the S&P 500 (SPY) is bullish. The Long-Term Trend Model, which informs our long-term outlook, is on a BUY signal as of 4/1/2016 so our long-term posture is bullish.
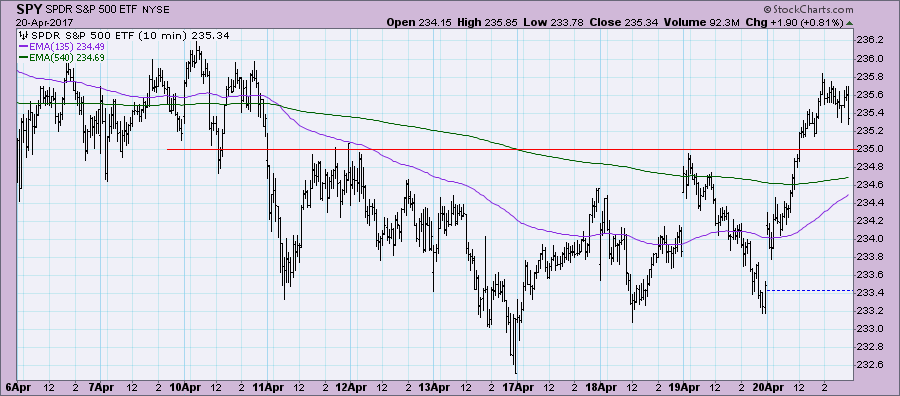
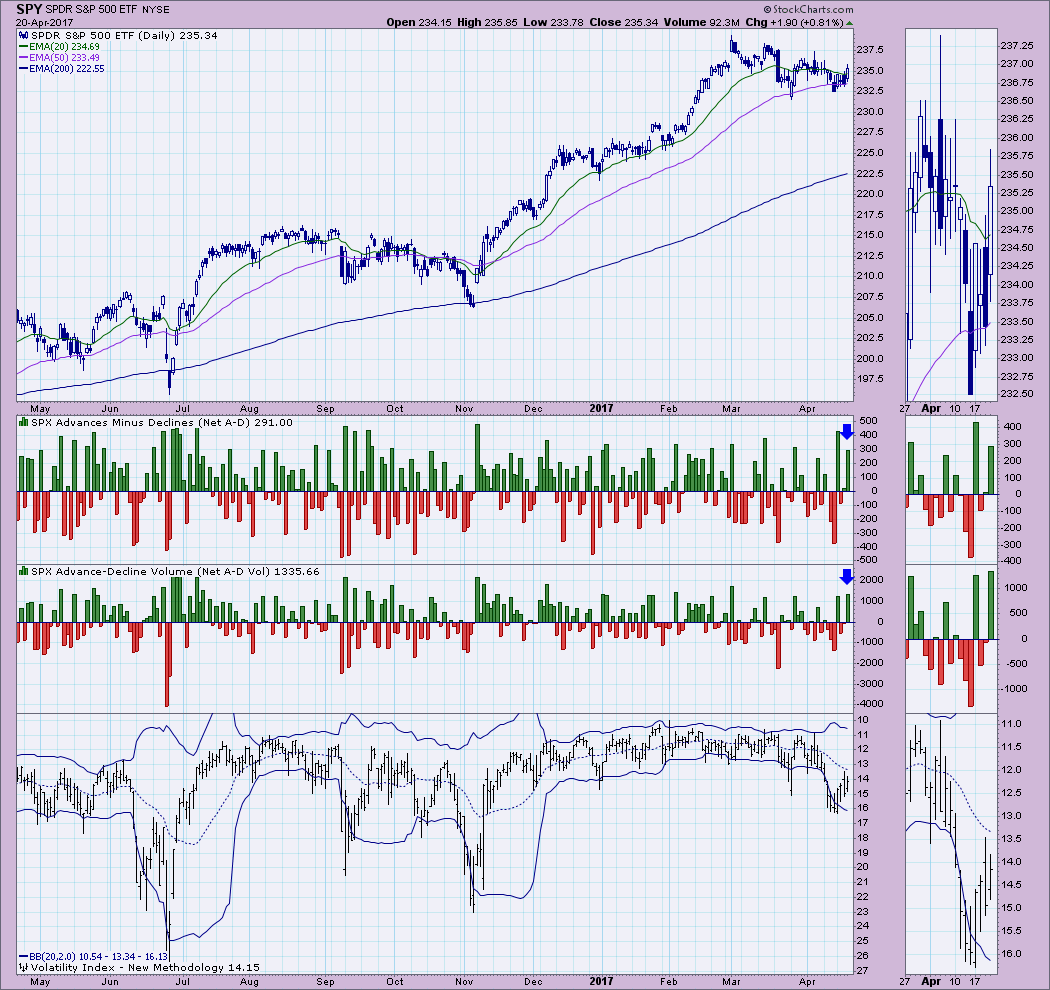
Today price broke above recent resistance and consolidating by the end of the day. Looks like a possible bull flag.
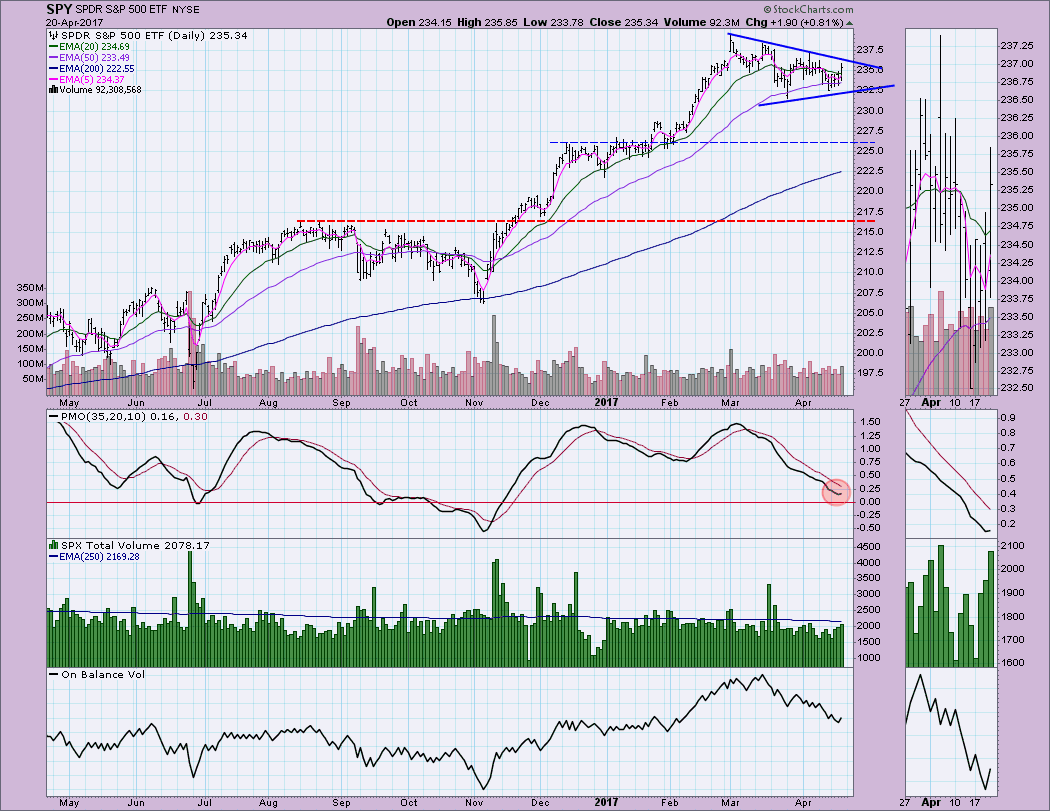
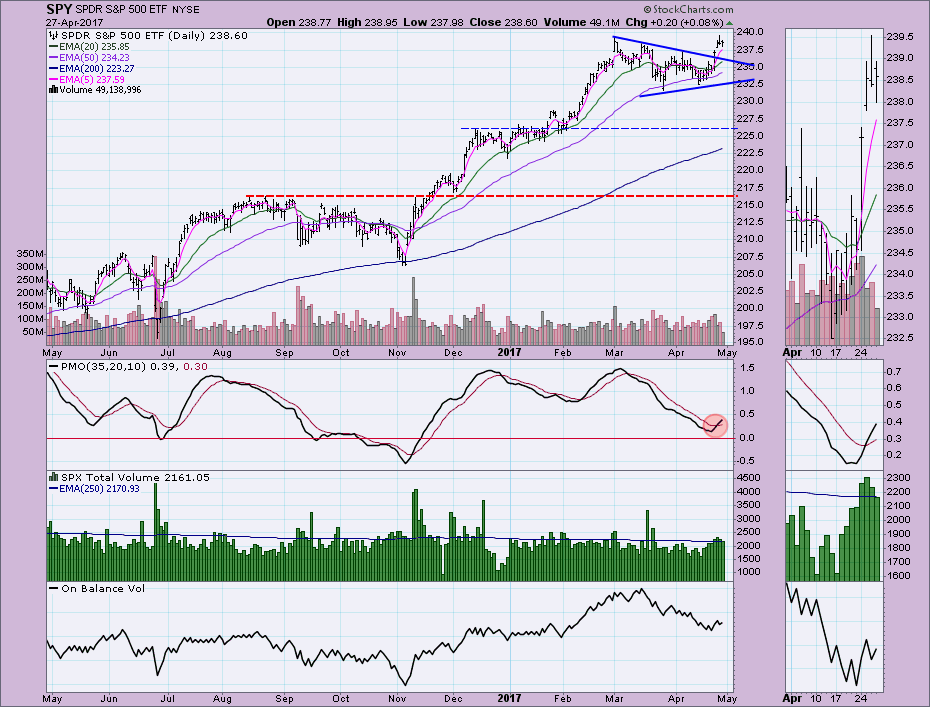
Price is traveling within a symmetrical triangle on the SPY. These patterns are typically continuation patterns which would suggest price should breakout this time around. The PMO is turning up which also increases optimism. It was a sustained rally on increasing volume which is positive. The OBV is not showing us a bullish divergence or confirmation at this time.
Ultra-Short-Term Indicators: Today saw somewhat climactic breadth readings. However, the VIX didn't really confirm this as a buying initiation. The VIX readings are declining which does suggest more bullishness in the market place, but I like to see band penetrations as confirmation.
Short-Term Indicators: It appears these indicators have picked a direction and that is 'higher'. Readings are in neutral, but they are rising which is bullish for the short term.
Intermediate-Term Indicators: It's hard to interpret whether this is going to be a reliable bottom on these indicators so it's best to simply wait for the positive crossovers before getting bullish. The readings are sitting in neutral and appear to be rising, I'd call that somewhat bullish.
Conclusion: Price is spiraling into the apex of a symmetrical triangle. It is now testing the top of the triangle. With indicators beginning to look up including a PMO bottom and new BUY signal on the NDX, I'll have to readjust my short-term position to cautiously bullish. . .
:::: DP Alert: Market Pausing - Calm Before the Storm? :::: By Erin Heim | April 27, 2017
The short term remains bullish in terms of the DecisionPoint Scoreboards. The long term also is showing all bullish BUY signals. Momentum looks to be a problem in the intermediate term. The SELL signals on all but the NDX come from the Price Momentum Oscillator (PMO) on the weekly chart. You can go look at them with annotations in the DP LIVE shared ChartList right here.
STOCKS: Based upon a 11/15/2016 Intermediate-Term Trend Model BUY signal, our current intermediate-term market posture for the S&P 500 (SPY) is bullish. The Long-Term Trend Model, which informs our long-term outlook, is on a BUY signal as of 4/1/2016 so our long-term posture is bullish.
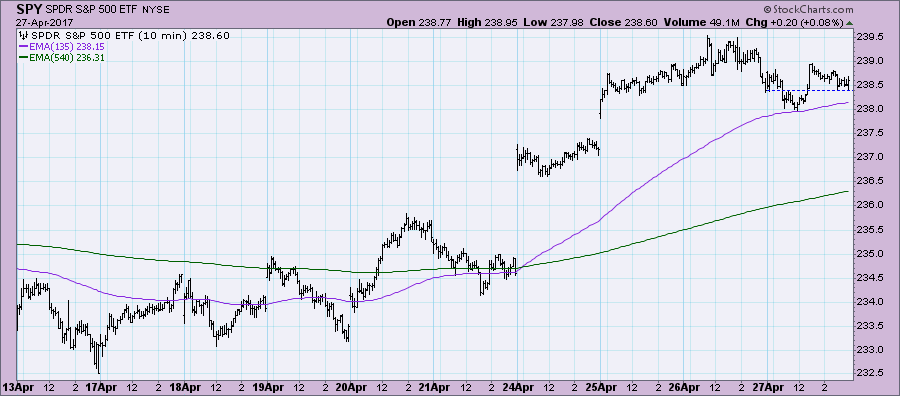
The market traveled mostly sideways to finish nearly unchanged. A new top was put in yesterday.
I like the possible breakaway gap we saw on Tuesday that pushed price above declining tops line resistance and executed the symmetrical triangle continuation pattern. I was originally concerned about a possible island reversal, it wouldn't take much to close the recent gap and it would provide price an opportunity to bounce off support. I'm not worried about a correction. The new PMO BUY signal is intact.
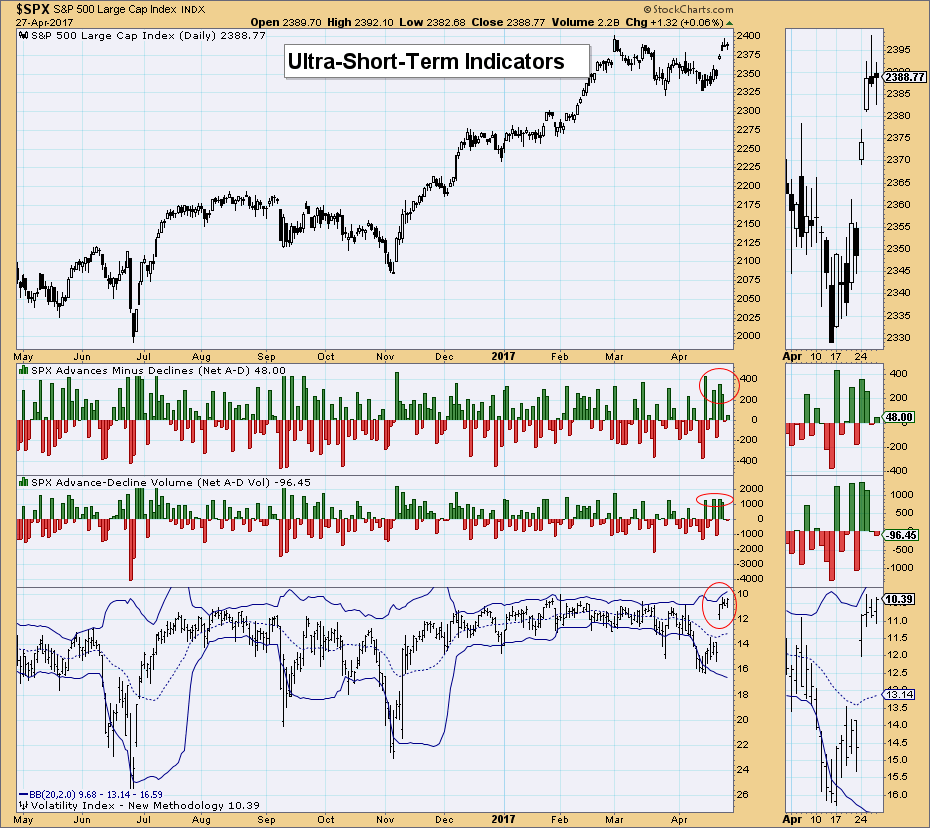
Ultra-Short-Term Indicators: Today the readings were nearly non-existent on breadth. The VIX continues to flirt with the upper Bollinger Band, but hasn't penetrated it. With price backing off today, I would say the buying exhaustion noted by climactic breadth readings, may have concluded with today's small decline. However, I am keeping alert to the movement of the VIX and possible breakouts/breakdowns on Bollinger Bands.
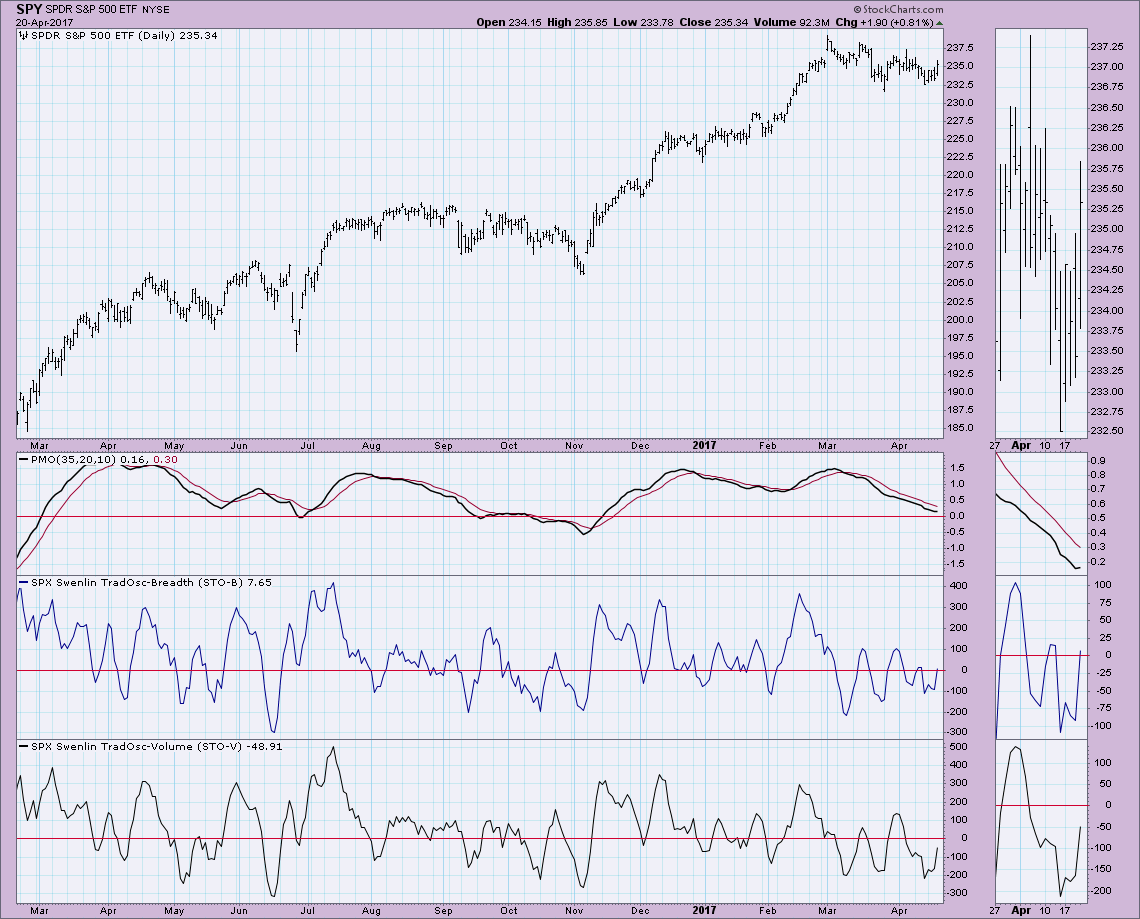
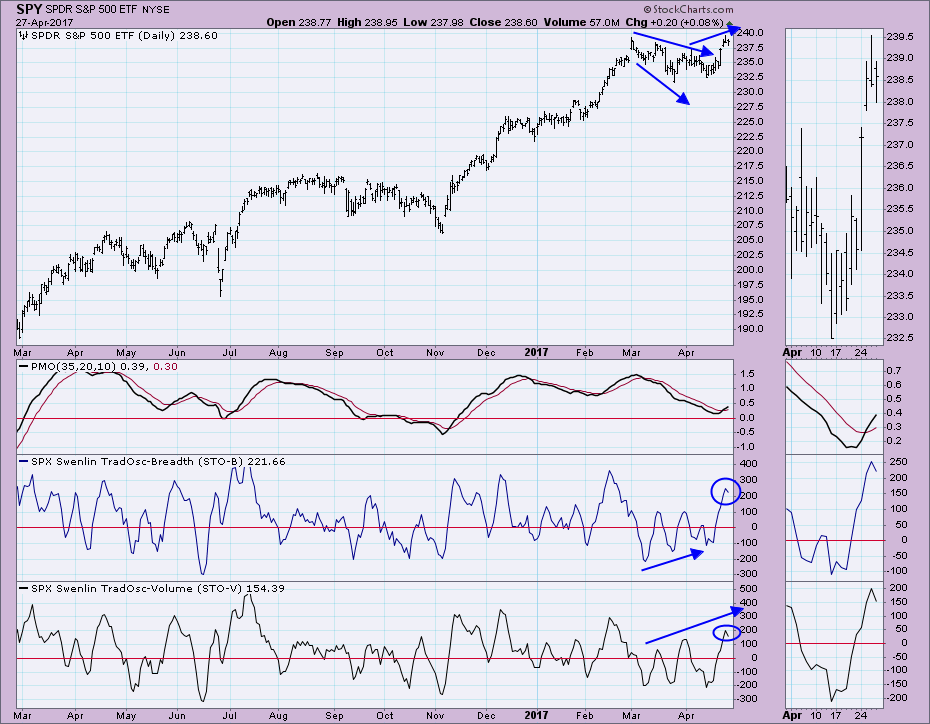
Short-Term Indicators: A lot of annotations here. First, note that both indicators have turned down. I'm not overly concerned about this yet. The STO-B bottoms showed a nice positive divergence, signaling the upcoming rally. The STO-V had a positive divergence at that same time and now is showing a bullish confirmation of the rally.
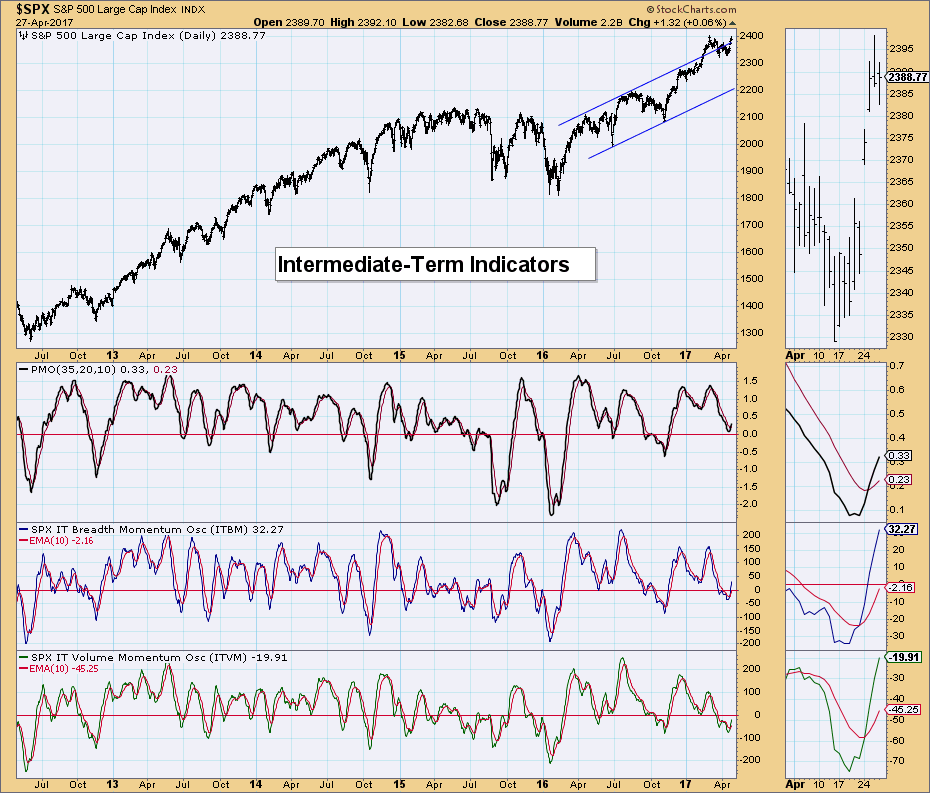
Intermediate-Term Indicators: They are both rising bullishly in neutral territory.
Conclusion: Although ST indicators have turned down, IT indicators are looking quite bullish. I suspect after this pause, we will see a small pullback to test support around 235 before another rally higher in the next week. . .
 News
News  Market Data
  Discover