:::: DP Alert: Market Pausing - Calm Before the Storm? :::: By Erin Heim | April 27, 2017
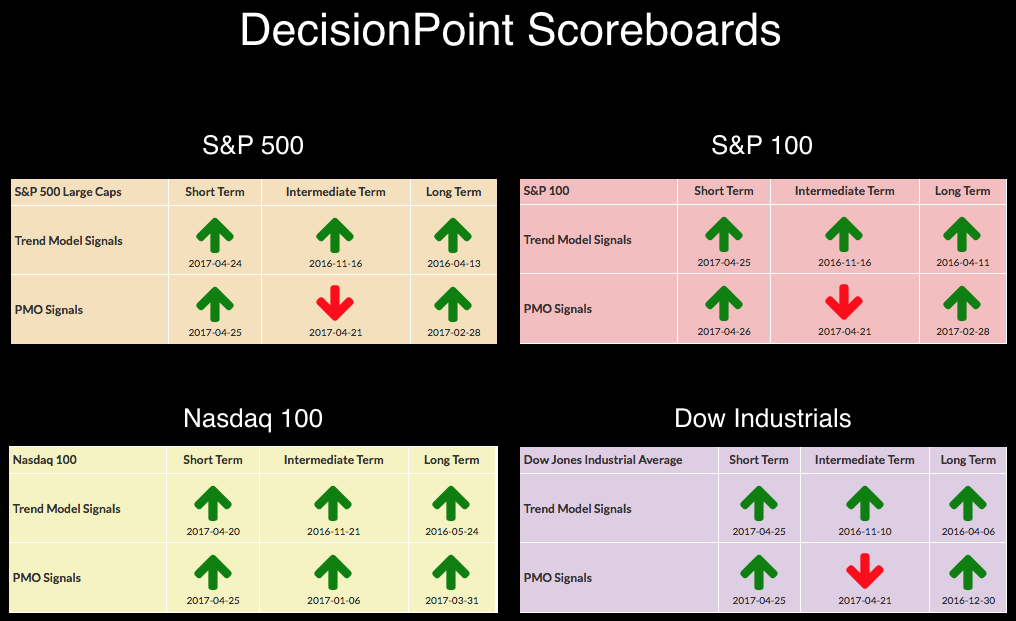
The short term remains bullish in terms of the DecisionPoint Scoreboards. The long term also is showing all bullish BUY signals. Momentum looks to be a problem in the intermediate term. The SELL signals on all but the NDX come from the Price Momentum Oscillator (PMO) on the weekly chart. You can go look at them with annotations in the DP LIVE shared ChartList right here.
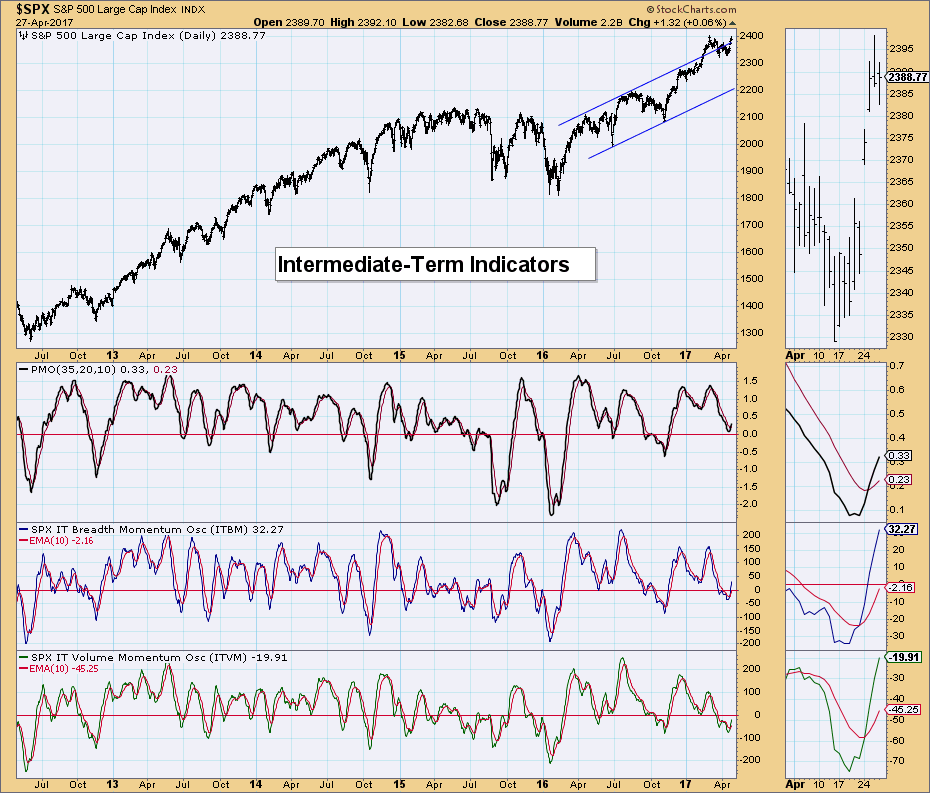
STOCKS: Based upon a 11/15/2016 Intermediate-Term Trend Model BUY signal, our current intermediate-term market posture for the S&P 500 (SPY) is bullish. The Long-Term Trend Model, which informs our long-term outlook, is on a BUY signal as of 4/1/2016 so our long-term posture is bullish.
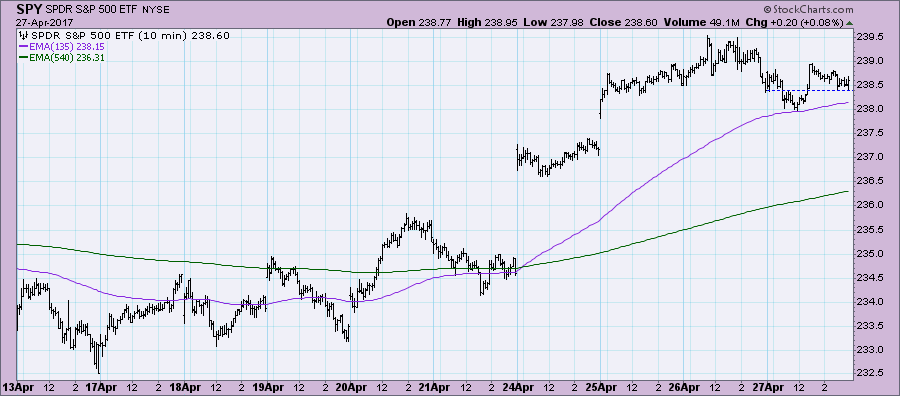
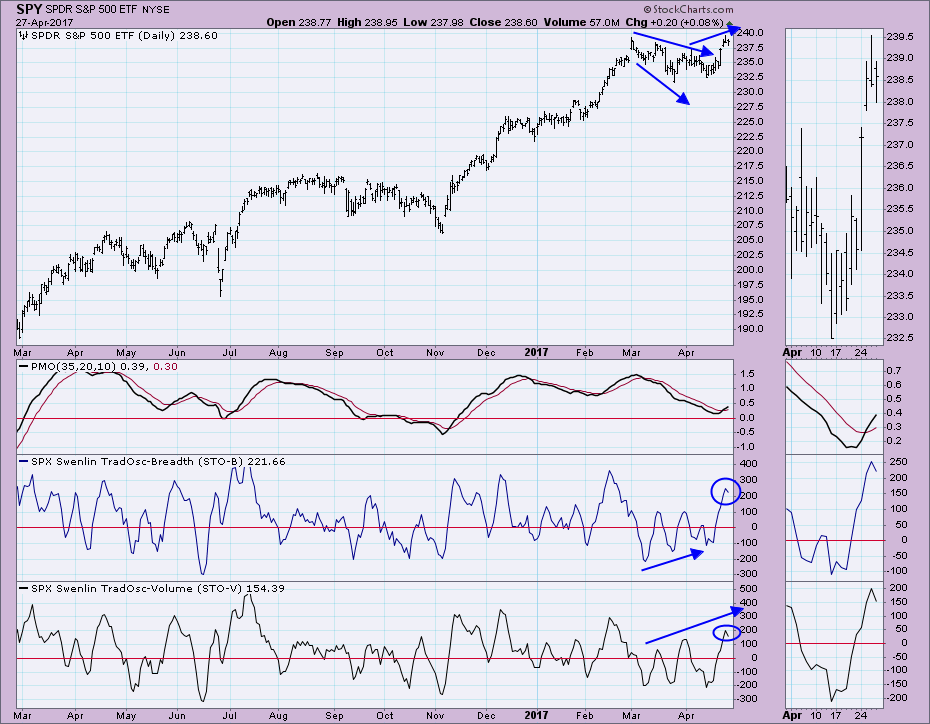
The market traveled mostly sideways to finish nearly unchanged. A new top was put in yesterday.
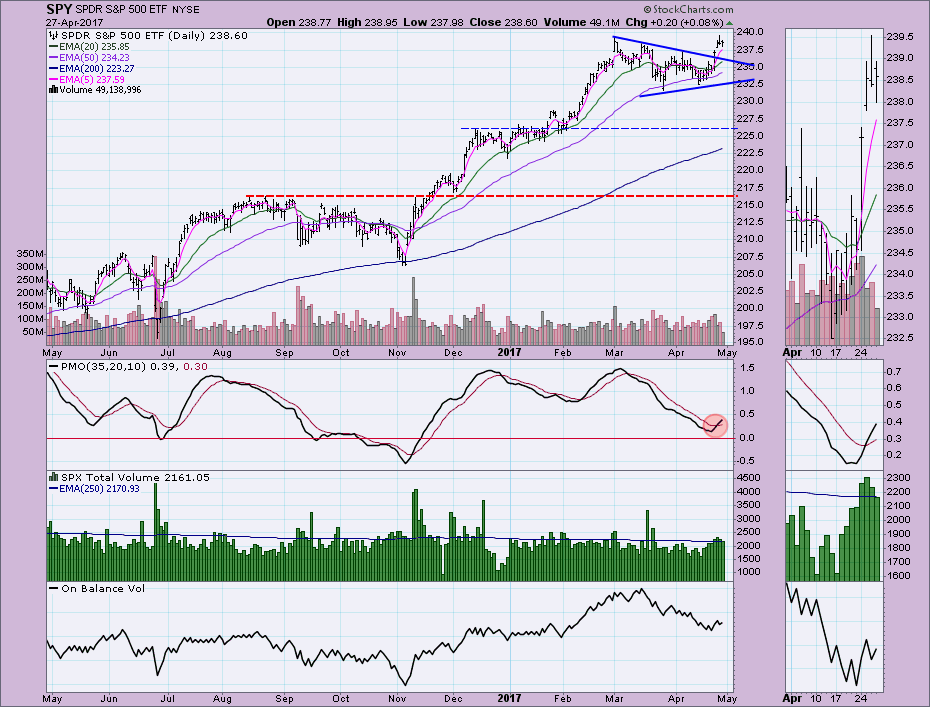
I like the possible breakaway gap we saw on Tuesday that pushed price above declining tops line resistance and executed the symmetrical triangle continuation pattern. I was originally concerned about a possible island reversal, it wouldn't take much to close the recent gap and it would provide price an opportunity to bounce off support. I'm not worried about a correction. The new PMO BUY signal is intact.
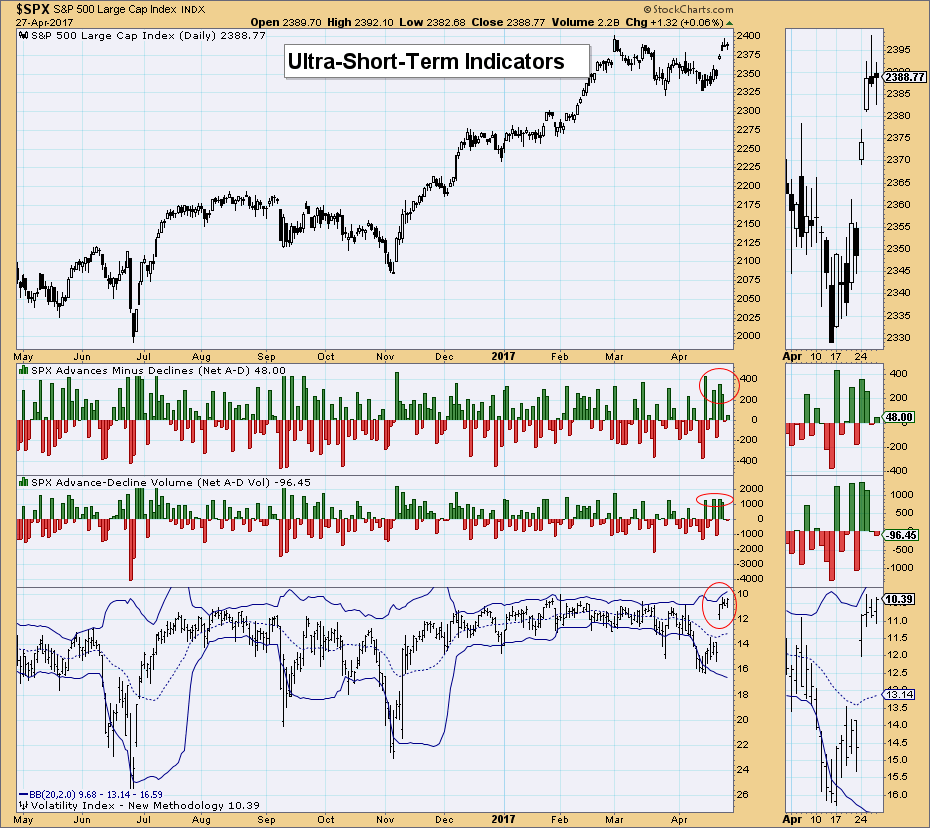
Ultra-Short-Term Indicators: Today the readings were nearly non-existent on breadth. The VIX continues to flirt with the upper Bollinger Band, but hasn't penetrated it. With price backing off today, I would say the buying exhaustion noted by climactic breadth readings, may have concluded with today's small decline. However, I am keeping alert to the movement of the VIX and possible breakouts/breakdowns on Bollinger Bands.
Short-Term Indicators: A lot of annotations here. First, note that both indicators have turned down. I'm not overly concerned about this yet. The STO-B bottoms showed a nice positive divergence, signaling the upcoming rally. The STO-V had a positive divergence at that same time and now is showing a bullish confirmation of the rally.
Intermediate-Term Indicators: They are both rising bullishly in neutral territory.
Conclusion: Although ST indicators have turned down, IT indicators are looking quite bullish. I suspect after this pause, we will see a small pullback to test support around 235 before another rally higher in the next week. . .
Click on "In reply to", for Authors past commentaries
Information posted to this board is not meant to suggest any specific action, but to point out the technical signs that can help our readers make their own specific decisions. Your Due Dilegence is a must! • DiscoverGold
Register for free to join our community of investors and share your ideas. You will also get access to streaming quotes, interactive charts, trades, portfolio, live options flow and more tools.


 News
News  Market Data
  Discover