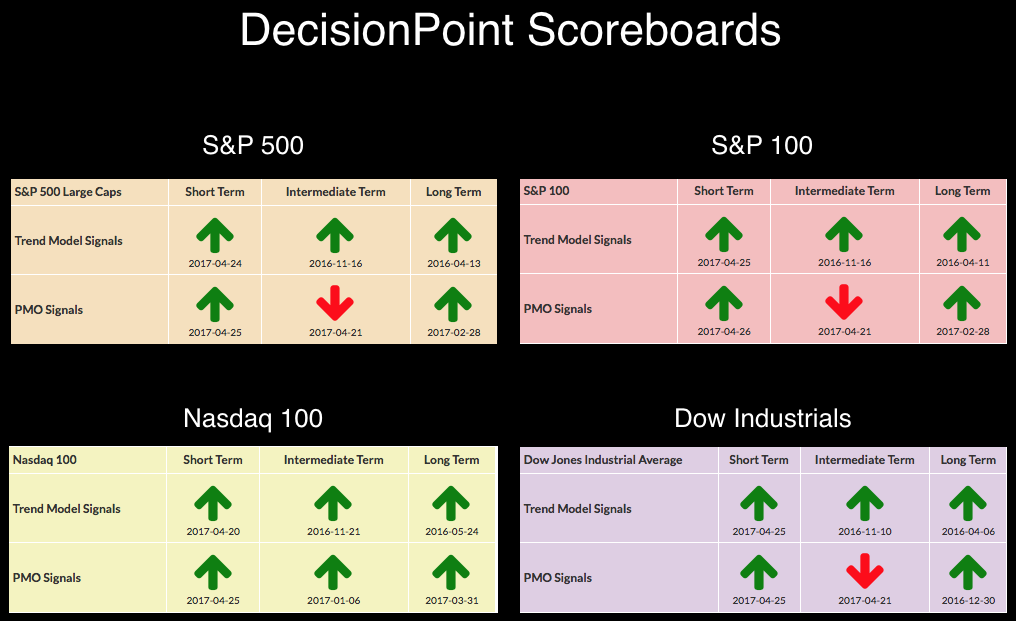
The market hasn't really done much this week which is keeping the DP Scoreboards in a holding pattern. I've been getting regular 'technical alerts' that the OEX IT Price Momentum Oscillator (PMO) signal has changed, meaning that whipsaw is happening daily. We won't know the actual signal until the weekly chart goes final tomorrow afternoon. I'll keep you apprised.
SIGNALS: Here we include charts of any important signal changes triggered today by our Intermediate-Term Trend Model.
NO SIGNAL CHANGES TO REPORT.
STOCKS: Based upon a 11/15/2016 Intermediate-Term Trend Model BUY signal, our current intermediate-term market posture for the S&P 500 (SPY) is bullish. The Long-Term Trend Model, which informs our long-term outlook, is on a BUY signal as of 4/1/2016 so our long-term posture is bullish.
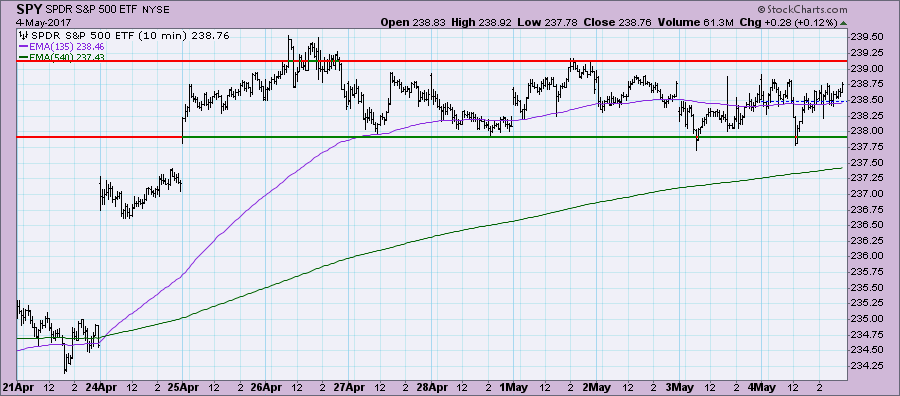
The market's holding pattern is quite clear on the 10-minute bar chart.
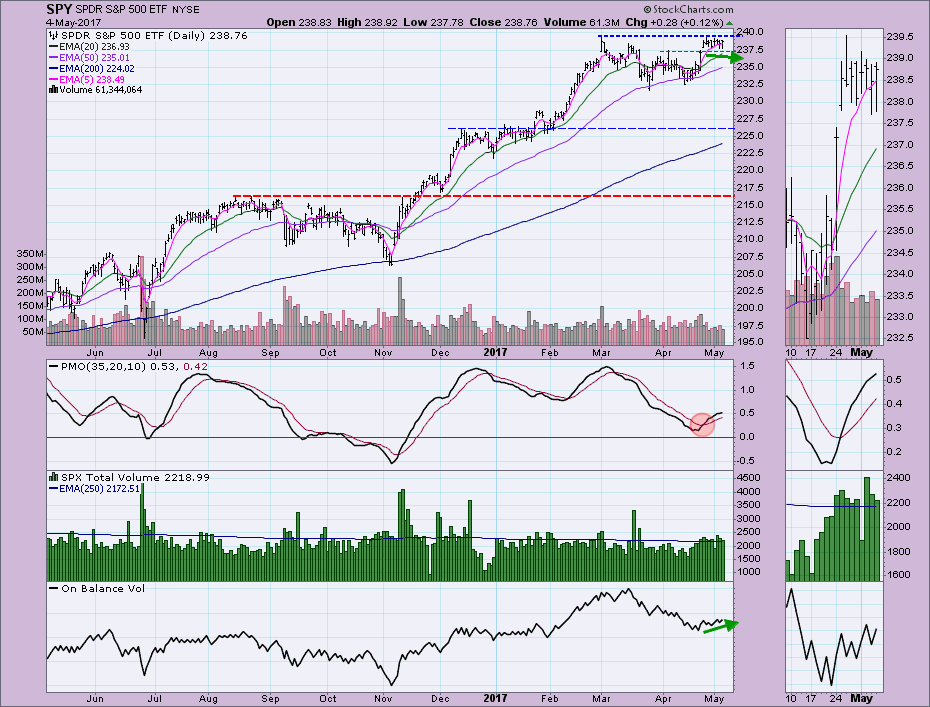
This is actually adding a positive spin. If the market is moving sideways, yet the PMO and OBV are rising in a positive divergence. I don't like that the PMO is decelerating, but it is naturally going to happen if price isn't moving higher. The OBV bottoms have been rising even as price bottoms have been sinking.
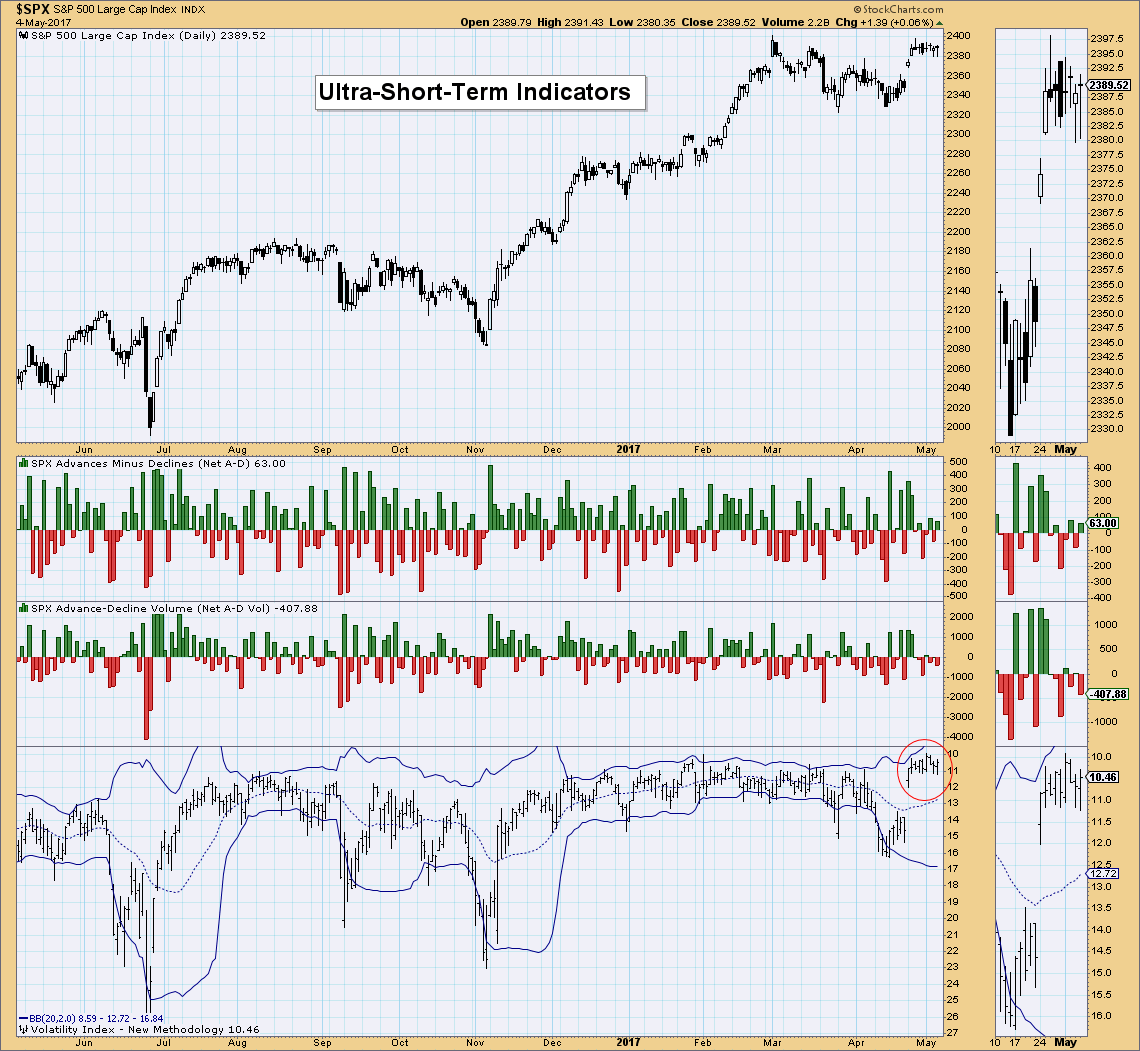
Ultra-Short-Term Indicators: No climactic breadth readings today. The VIX continues to hover above its moving average (inverted scale) which means that investors are complacent and somewhat bullish. If exuberance pushes high enough (an upper band penetration), that would be considered bearish. When headlines on magazines, news items and investor psychology turns extra bullish, that is generally the time to look for a decline or correction. I don't see these readings as a problem yet.
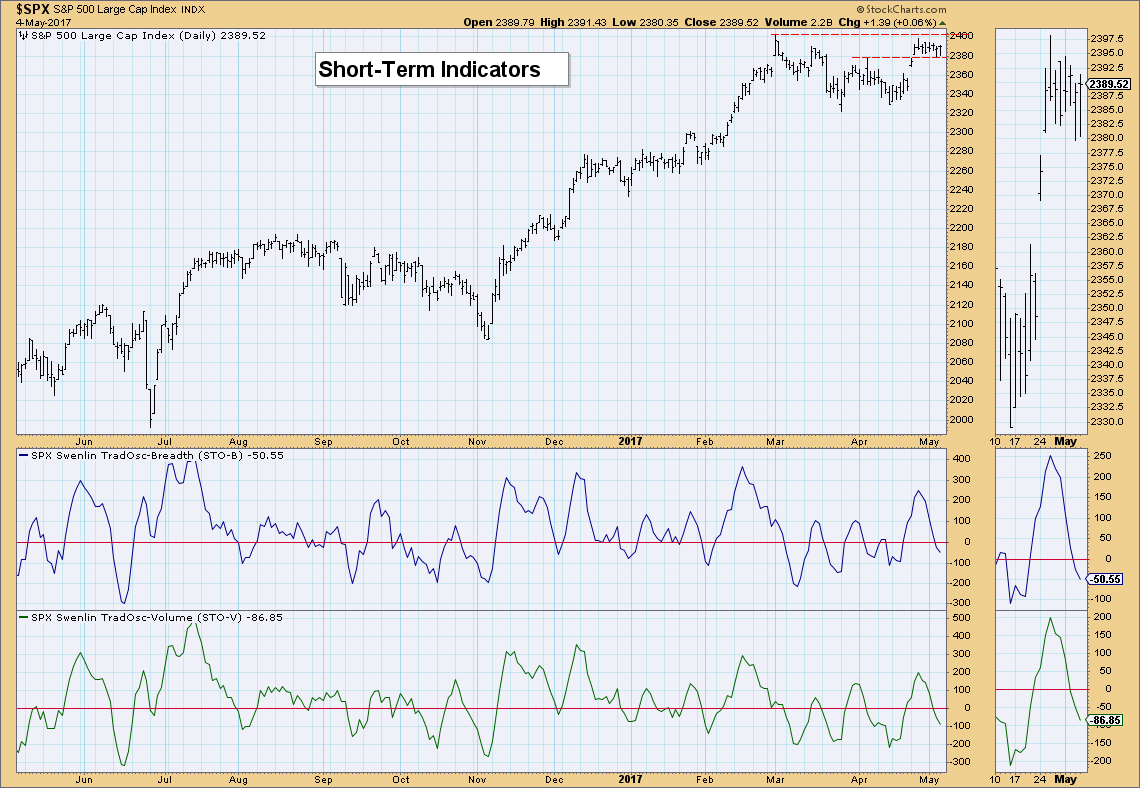
Short-Term Indicators: The market has complied with declining short-term indicators with sideways movement rather than a drop. This suggests internal strength or at least protection from a surprise correction. They are getting oversold, likely preparing for the next push higher.
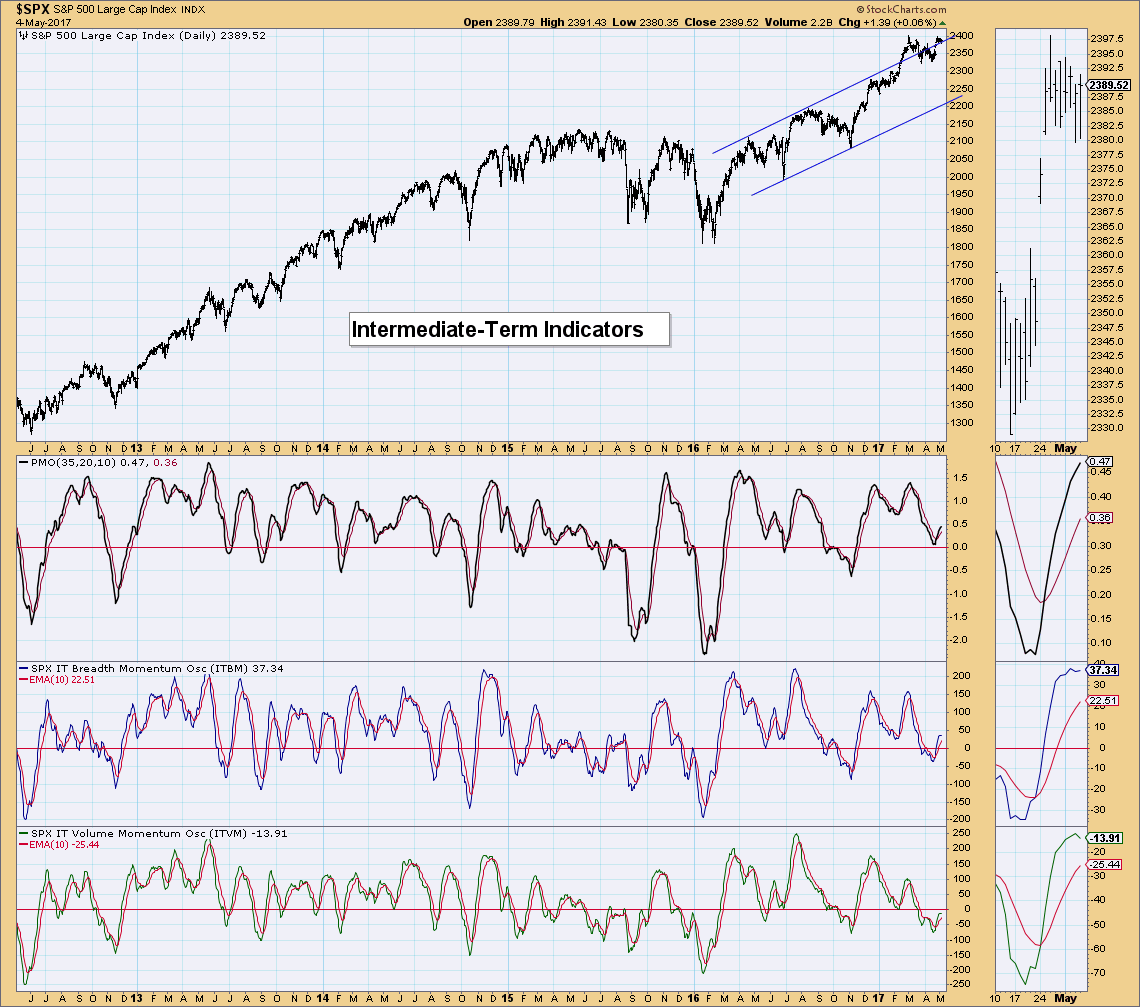
Intermediate-Term Indicators: These indicators have looked very bullish since the positive crossovers their signal lines. Today we are now seeing some hesitation in their advance. The ITVM has actually turned lower. I am not that concerned about this just yet. If we see a negative crossover, that will be the time to reassess.
Conclusion: The market has been consolidating sideways. Indicators are neutral in my estimation. ST indicators are nearly oversold and IT indicators haven't really succumbed to a decline. Tom and I will likely be discussing implications of fading commodities and Gold, but a Dollar that is also struggling right now. . .
 News
News  Market Data
  Discover