New Long-Term PMO BUY Signal for $TSX By Erin Heim
* September 30, 2016
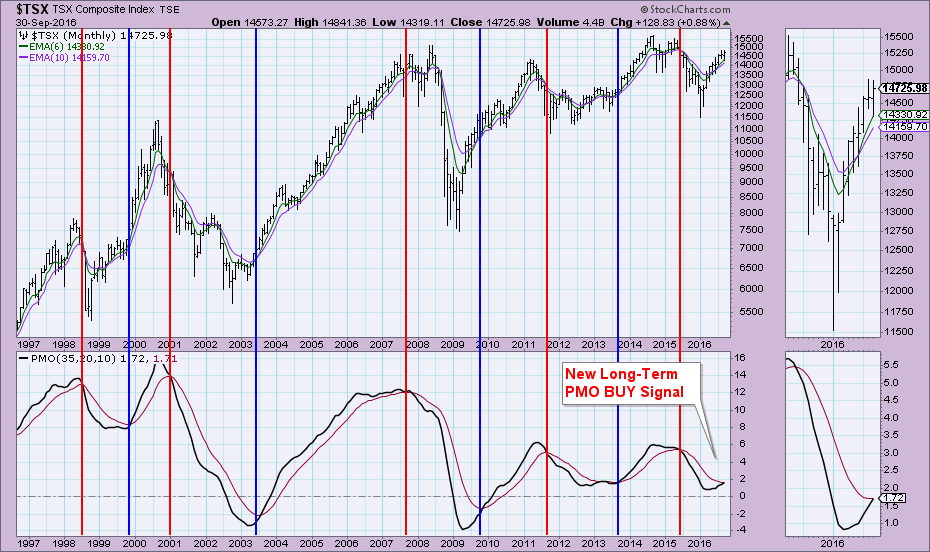
Hopefully I won't be stepping on Greg Schnell's Canadian toes, but as I was going through charts from last Wednesday's webinar, I saw that $TSX just had a new LONG-TERM Price Momentum Oscillator (PMO) BUY Signal. These are incredibly infrequent; for the last twenty years, we've only had nine long-term PMO crossover signals...that's BUY and SELL signals combined.
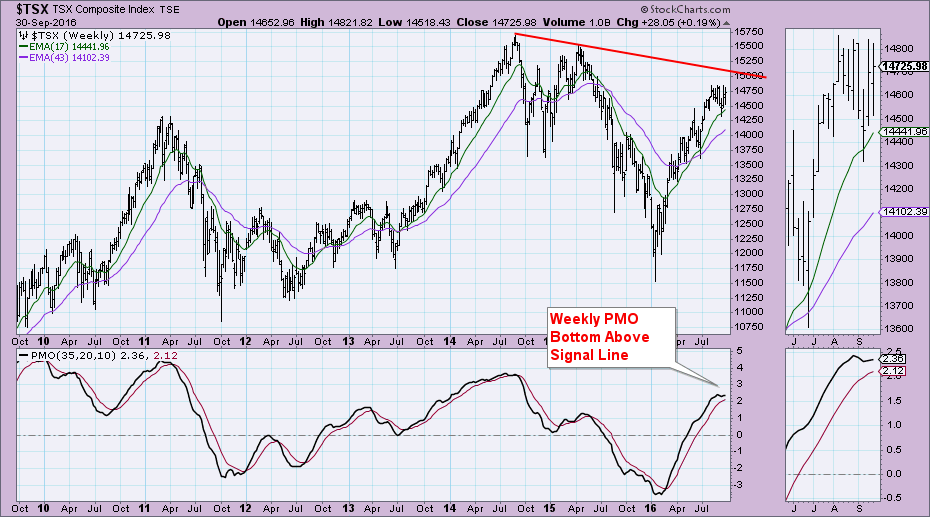
I've annotated in the chart below with red vertical lines at PMO SELL signals and blue vertical lines for PMO BUY signals. Today's BUY signal is very promising when you review the weekly and daily charts as well.
All-time highs are very far away. I'm not suggesting that this long-term PMO BUY signal is implying a move to all-time highs next month, but the bearish bias in the long term is falling away. Notice on the weekly chart below that the PMO has turned up above its signal line which is very bullish. It's somewhat overbought, but the weekly (and monthly) PMOs move slowly. There is also more territory above current readings to accommodate more upside.
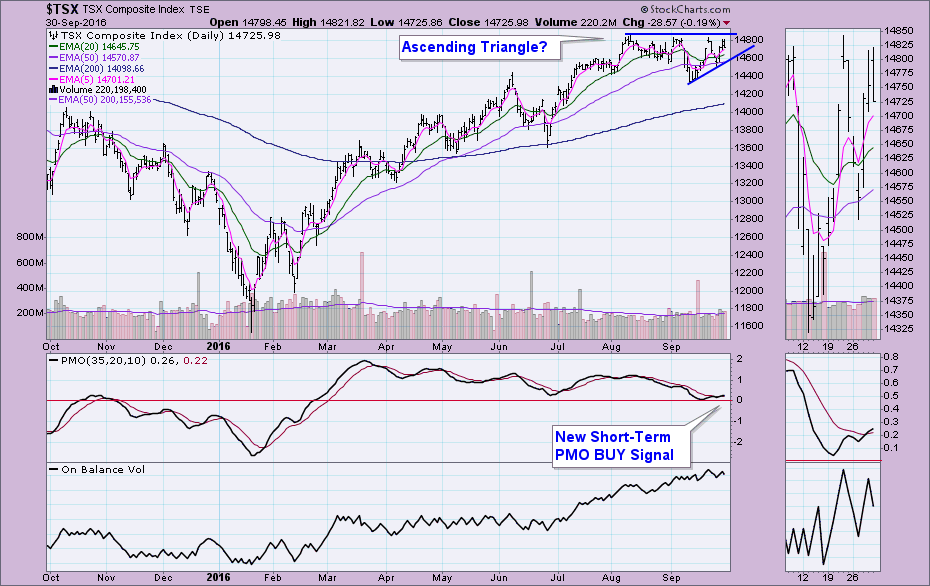
The daily chart suggests a breakout isn't out of the question. The PMO just generated a new PMO BUY signal on the daily chart. I'm also seeing a fairly "textbook" ascending triangle. The pattern suggests an upside breakout.
Conclusion: There are many fundamental forces at work behind the scenes that could sabotage $TSX, but technically speaking it's looking quite bullish in all three timeframes.
Technical Analysis is a windsock, not a crystal ball.
 News
News  Market Data
  Discover