New Intermediate-Term Trend Model Neutral Signal Triggers on SPX By Erin Heim
* October 13, 2016
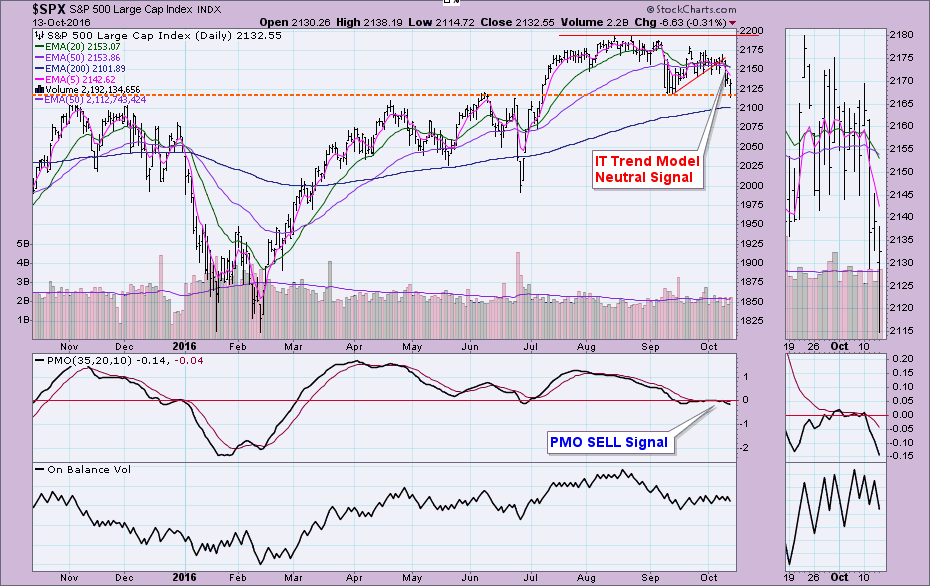
The DecisionPoint Scoreboards have been flipping out. Whipsaw has wreaked havoc on the Short-Term Trend Models (STTMs) and Price Momentum Oscillator (PMO). However, today's signal change is from the Intermediate-Term Trend Model (ITTM). Whipsaw isn't out of the question, but typically it doesn't happen as much with intermediate-term indicators. The STTM is based on 5/20-EMA crossovers, but the ITTM is based on 20/50-EMA crossovers; hence, less whipsaw and more importance.
Today the SPX tumbled and tested longer-term support. It was a successful test as price reached support and rallied back off it rather than continue the breakdown. Given the new ITTM Neutral signal and combined with the current STTM Neutral signal and PMO SELL signal, I doubt that will hold up. Where does that put price next? Likely to test the 2000 level near the May/June lows.
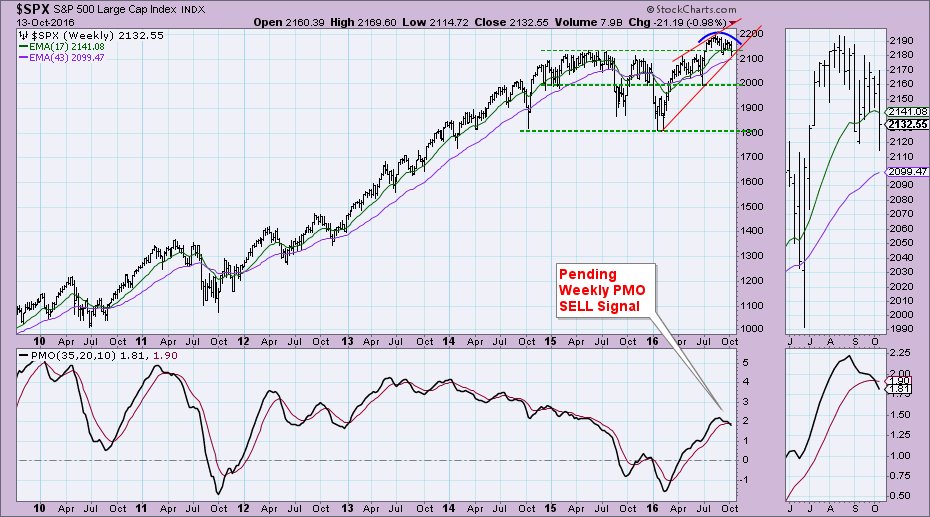
The weekly chart isn't encouraging regarding this current support level at the September low holding. There are two bearish patterns on the weekly chart. First a rounded top that implies lower prices, and a rising wedge. The Intermediate-Term (weekly) PMO is on a SELL signal; however, the SPX Scoreboard still shows the IT PMO on a BUY signal. Weekly signals do not go "final" until the last trading day of the week, so they shouldn't be counted on to happen. In fact, last week the PMO generated a mid-week SELL signal on the weekly chart, but on Friday, it had crossed back above its signal line and remained on a BUY signal. It came within hundredths of a point of a new SELL signal. This crossover looks like it will hold through tomorrow (Friday). It is a deliberate crossover, where the PMO began to accelerate its decline into the crossover rather than "drift" through the signal line.
Conclusion: The SPX generated a new ITTM Neutral signal. It appears to be a 'good' one as chart patterns and indicators are suggesting further decline.
Technical Analysis is a windsock, not a crystal ball.
 News
News  Market Data
  Discover