Thrust/Trend Model Chart Warns of More Decline By Erin Heim
* September 16, 2016
A comment on a recent DecisionPoint Alert blog article prompted me to review the Thrust/Trend Model indicator chart. During Friday's webinar I brushed over it as time was quickly disappearing. I promised to go over it in more detail in my ChartWatchers article. So here we go!
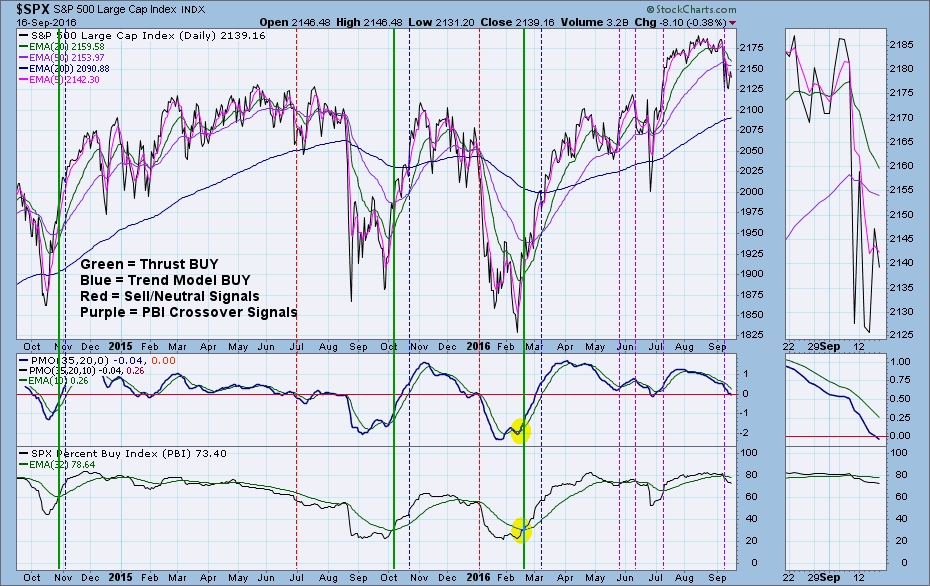
First, here's a quick refresher on the signal generation of the Thrust/Trend Model. When Sell or Neutral signals are generated by the trend component (basically the Intermediate-Term Trend Model) of the Thrust/Trend Model , the next buy signal is dependent on the "thrust" component--dual positive crossovers by Price Momentum Oscillator (PMO) and Percent Buy Index (PBI) (green lines). After that original signal, the trend component needs to confirm it by having a positive 20/50-EMA crossover (blue lines). Once the Trend Model confirms, the BUY signal will remain intact until a negative 20/50-EMA crossover (red lines). After the negative crossover, the PMO and PBI are in charge again.
As you can see on the chart, we are currently on a Thrust/Trend Model BUY signal that first generated in February. In the meantime, the PMO and PBI have been having crossovers of their own. Those I've highlighted in purple. Although we have a BUY signal right now, we can see how using the dual PMO/PBI crossovers do add an extra screen. The PBI had its negative crossover on Friday, so it would've missed the correction, but it implies their is more downside approaching. Most importantly, note that the 20-EMA is approaching a negative crossover the 50-EMA. That would generate a Neutral signal on both the Intermediate-Term Trend Model and the Thrust/Trend Model. Once that happens, we'll be watching the PMO and PBI closely for positive crossovers to generate the next Thrust/Trend Model BUY signal.
Conclusion: Although we're still on Intermediate-Term Trend Model and Thrust/Trend Model BUY signals, they are closing. The PBI likely gave us serious warning of an impending intermediate-term decline.
Technical Analysis is a windsock, not a crystal ball.
Click on "In reply to", for Authors past commentaries.
Information posted to this board is not meant to suggest any specific action, but to point out the technical signs that can help our readers make their own specific decisions. Your Due Dilegence is a must! • DiscoverGold
Register for free to join our community of investors and share your ideas. You will also get access to streaming quotes, interactive charts, trades, portfolio, live options flow and more tools.


 News
News  Market Data
  Discover