DP (SPY) Weekly Wrap: A Gap I Don't Like By: Carl Swenlin | September 7, 2018
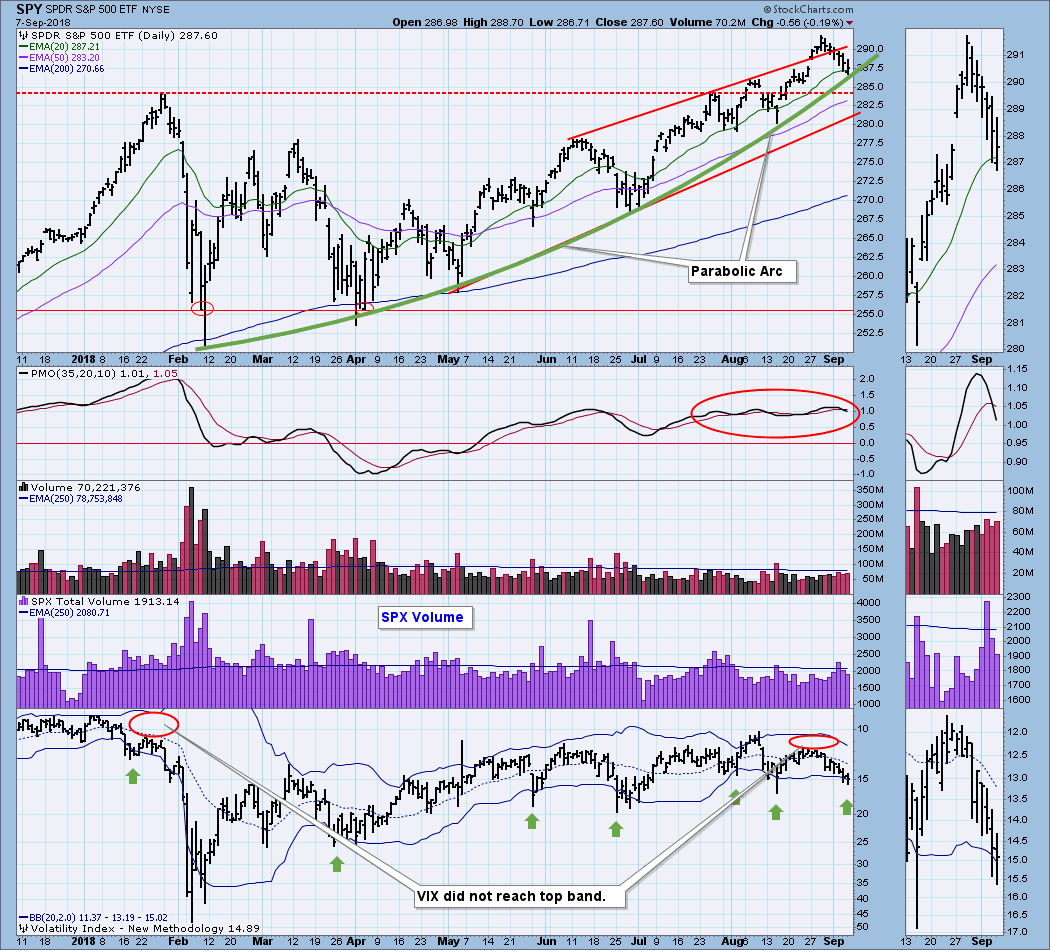
Last week we were looking at a possible bearish island reversal on one hand, and nascent parabolic advance on the other. This week's decline filled the island gap, making the island proposition moot. The decline also reached down to touch the parabolic arc, but so far that 'support' has held. Of more immediate interest is the gap between the most recent VIX top and the top Bollinger Band. More on that to follow.
INTERNATIONAL MARKETS
This section will not become a regular feature in this report, but I thought it was worth covering this week. I don't really pay much attention to non-U.S. markets, but recently I heard a comment they were nearly all doing poorly by comparison. This prompted me to take a stroll through the international charts, and I found that it was true. The chart below is fairly typical of what I found -- a January crash, then sideways meandering, dropping off more recently. This could explain why the U.S. market is doing so well, but I don't think of this as particularly good news, because I don't think the U.S. market can continue to do well with the rest of the world heading into a ditch.
SECTORS
Each S&P 500 Index component stock is assigned to one, and only one, of 10 major sectors. This is a snapshot of the Intermediate-Term and Long-Term Trend Model signal status for those sectors.
STOCKS
IT Trend Model: BUY as of 5/11/2018
LT Trend Model: BUY as of 4/1/2016
SPY Daily Chart: As I said earlier, the parabolic has so far survived the recent pullback; however, the issue with the VIX does make me nervous. Note that the VIX moved up from its August low but failed to reach the top band, topping just above the 20SMA, then falling back to the lower band. The last time the gap was this pronounced was in January just before the crash. I'm not saying the market is about to crash, but I don't like the setup. Of bullish note, SPX volume contracted the last two days, and the daily PMO remains in the narrow positive range.
SPY Weekly Chart: This time frame remains positive, although the weekly PMO is decelerating.
Short-Term Market Indicators: The STO-B and STO-V are at bull market oversold levels, and the STO-B has bottomed.
Intermediate-Term Market Indicators: Negative divergences persist on all three indicators in this time frame.
Conclusion: As usual, the chart immediately above provides the best overview for the intermediate term. The market is in near-record territory, with primary indicators flashing negative divergences. In a bull market such divergences are not usually a problem. They don't say 'sell' as much as they say 'not a good time to buy.' The short-term problem with the VIX I mentioned tells us to really be on our toes until it clears. Background issues are market overvaluation and international market weakness.
Click on "In reply to", for Authors past commentaries
Information posted to this board is not meant to suggest any specific action, but to point out the technical signs that can help our readers make their own specific decisions. Your Due Dilegence is a must! • DiscoverGold
Register for free to join our community of investors and share your ideas. You will also get access to streaming quotes, interactive charts, trades, portfolio, live options flow and more tools.


 News
News  Market Data
  Discover