


| Followers | 680 |
| Posts | 141366 |
| Boards Moderated | 36 |
| Alias Born | 03/10/2004 |
Thursday, December 14, 2017 9:17:31 AM
By: Tim Ord | December 13, 2017
SPX Monitoring purposes; Sold long 12/11/17 at 2659.99 = gain 1.17%; Long SPX on 12-6-17 at 2629.27.
Monitoring purposes GOLD: Covered short GDX 12/12/17 at 21.40=gain 5.14%; Short GDX on 11/13/17 at 22.56
Long Term Trend monitor purposes: Neutral.
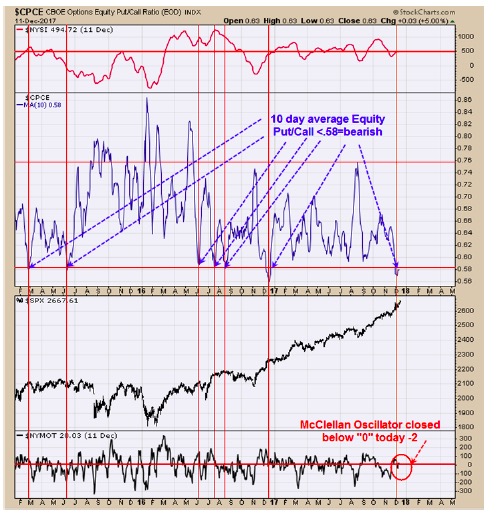
This is option expiration week and option related indicators carry more weight during this time period. The chart above goes back near three years and shows the times when the 10 day average of the Equity Put/Call ratio reached .58 or lower. At best the market went sideways when this ratio reached .58 and at worst produced a decent decline. FOMC is today and tomorrow with the announcement tomorrow at 2:00 Eastern and could be catalysis for a pull back. The bottom window is the McClellan Oscillator which closed at -2 and below “0” and a bearish sign. A possible target for a low is the December low of 260 range on the SPY.
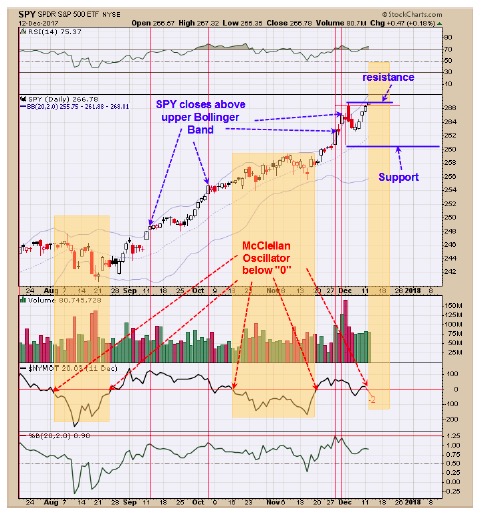
Today’s rally tested the previous high on near half the volume and a bearish sign. Though the market was up today the McClellan Oscillator fell though “0” and closed near -2 and another bearish sign. The tan area shows when the McClellan Oscillator was below “0” and what the market did in that time frame. The rally into the recent highs closed above the upper Bollinger Band twice which can represent exhaustion. The December option expiration (this week) has a 50/50 chance of closing higher where other option expiration weeks have over a 70% chance closing higher. Market has trended higher since September and a trading range is due. The bigger trend is up but a possible pull back to support near 260 on the SPY is possible. Tomorrow’s FOMC meeting announcement could be a catalysis for a pull back. Sold long 12/11/17 at 2659.99 = gain 1.17%; Long SPX on 12-6-17 at 2629.27
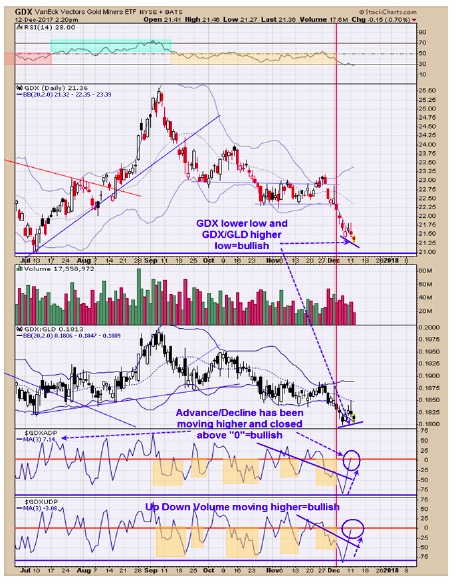
The COT Commercials covered their short position to 190K down from 247K the week before, showing a bullish slant. Bottoms show up in gold when the Commercials are near 100K or less. The bottom window is the Up/Down volume indicator which has been moving higher as GDX moved lower and a positive divergence. The next window up is the Advance/Decline indicator which also has been moving higher showing market is gaining strength; It also closed above “0” and a bullish sign. The middle window is the GDX/GLD ratio which has made higher lows as GDX made lower lows and a bullish sign. There is a horizontal trend that started back in March that comes in near 21.00 on GDX could be where GDX makes its low. It appears a bottom is not far off for GDX and we covered our short position on 12/12/17 at 21.42=gain of 5.14%; short GDX on 11/13/17 at 22.56.
Tim Ord,
Editor
http://stockcharts.com/articles/tac/2017/12/tim-ord-the-ord-oracle-december-13-2017.html
• DiscoverGold
(Disclosure: I do not own GDX shares)
Click on "In reply to", for Authors past commentaries
****************************************
*** For Market Direction and Trends visit our board:
https://investorshub.advfn.com/Market-Direction-and-Trends-26249/
Information posted to this board is not meant to suggest any specific action, but to point out the technical signs that can help our readers make their own specific decisions. Your Due Dilegence is a must!
• DiscoverGold
Recent GDX News
- YieldMax GDXY Name Change • GlobeNewswire Inc. • 01/25/2024 04:22:00 PM
- Surging S&P 500 Breadth • ValueWalk • 07/19/2023 03:16:37 PM
- S&P 500 Corrects In Breadth • ValueWalk • 07/18/2023 03:08:49 PM
- If The USDX Fell So Much, Why Didn’t Gold Truly Soar? • ValueWalk • 07/17/2023 05:16:20 PM
- USD’s Decline That’s… Bearish For Gold?! • ValueWalk • 07/12/2023 02:38:08 PM
- S&P 500 Late Day Reversal Worry • ValueWalk • 07/10/2023 03:17:34 PM
- Massive Gaming Celebrates Global Launch of House of Blackjack with USDC Earning Race • ValueWalk • 07/10/2023 02:44:17 PM
- Breathers In Mining Stocks Are Not Real Rallies • ValueWalk • 07/06/2023 05:20:55 PM
- S&P 500 Character Changes • ValueWalk • 07/06/2023 03:10:06 PM
- S&P 500 – As Bullish As It Gets • ValueWalk • 07/03/2023 04:01:21 PM
- The Great Gold Migration: How Asia Is Dominating The Global Gold Landscape • ValueWalk • 06/30/2023 05:07:35 PM
- S&P 500 Dip Buying And Tame PCE • ValueWalk • 06/30/2023 03:34:13 PM
- The Bullish Reversal In Gold Is Coming • ValueWalk • 06/29/2023 04:00:44 PM
- Insufficient S&P 500 Rotations • ValueWalk • 06/27/2023 02:41:42 PM
- Failing S&P 500 Rotations • ValueWalk • 06/23/2023 03:09:19 PM
- Countdown to S&P 500 Downleg • ValueWalk • 06/19/2023 01:49:20 PM
- Now THAT Was The Game-Changer For The Price Of Gold! • ValueWalk • 06/15/2023 04:40:35 PM
- S&P 500 Manages To Recover Initial Decline • ValueWalk • 06/15/2023 03:30:07 PM
- S&P 500 Manages To Recover From Tech-Driven Decline • ValueWalk • 06/15/2023 03:30:07 PM
- S&P 500 Withstands The Initial Selling – No Hike Tomorrow • ValueWalk • 06/13/2023 03:15:19 PM
- Roadmap For Mining Stocks – Courtesy Of The Stock Market • ValueWalk • 06/06/2023 03:17:49 PM
- Stocks To Still Extend S&P 500 Upswing • ValueWalk • 06/05/2023 03:31:02 PM
- AI, Stocks, And Gold Stocks – Connected After All • ValueWalk • 05/31/2023 03:29:15 PM
- Could Gold Miners Finally Stop Sliding?! • ValueWalk • 05/26/2023 08:42:37 PM
- S&P 500 Fine Selling Initiative • ValueWalk • 05/24/2023 03:06:00 PM
FEATURED Music Licensing, Inc. (OTC: SONG) Subsidiary Pro Music Rights Secures Final Judgment of $114,081.30 USD, Demonstrating Strength of Licensing Agreements • May 17, 2024 11:00 AM
Greenlite Ventures Inks Deal to Acquire No Limit Technology • GRNL • May 17, 2024 3:00 PM
VPR Brands (VPRB) Reports First Quarter 2024 Financial Results • VPRB • May 17, 2024 8:04 AM
ILUS Provides a First Quarter Filing Update • ILUS • May 16, 2024 11:26 AM
Cannabix Technologies and Omega Laboratories Inc. enter Strategic Partnership to Commercialize Marijuana Breathalyzer Technology • BLO • May 16, 2024 8:13 AM
Avant Technologies to Revolutionize Data Center Management with Proprietary AI Software Platform • AVAI • May 16, 2024 8:00 AM

