


| Followers | 689 |
| Posts | 143817 |
| Boards Moderated | 35 |
| Alias Born | 03/10/2004 |
Saturday, June 24, 2017 8:34:30 AM
CoT: Peek Into Future Through Futures – How Hedge Funds Are Positioned
By Hedgopia | June 24, 2017
Following futures positions of non-commercials are as of June 20, 2017.
E-mini S&P 500: Currently net long 8.6k, down 49.2k.
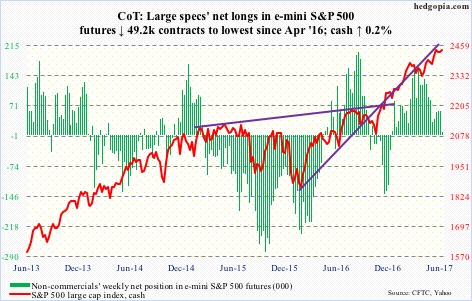
The tug of war continued between bulls and bears around 10- and 20-day moving averages on the cash. The latter – slightly rising – was defended twice this week, and twice last week. If the sideways action continues, a cross-under is possible, which should swing near-term odds in bears’ favor.
Even in this scenario, bulls have support at 2400, which also approximates the 50-day. Flows likely decide what happens next should the support get tested.
In the week to Wednesday, SPY (SPDR S&P 500 ETF) gained $444 million (courtesy of ETF.com). But IVV (iShares core S&P 500 ETF) and VOO (Vanguard S&P 500 ETF) together lost $2.5 billion – $2.3 billion and $178 million, respectively.
In the same week, $2.2 billion was withdrawn from U.S.-based equity funds (courtesy of Lipper).
For whatever it is worth, corporate buybacks continue to decelerate.
Nasdaq 100 index (mini): Currently net long 70.9k, down 30.6k.
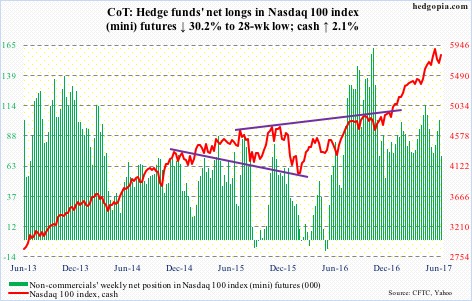
The week produced a little something for both bulls and bears. The former was able to rally the cash (5803.11) off of the 50-day, which was defended last week. As well, the 20-day has been captured.
That said, subtle signs of fatigue are beginning to show up. After seven straight up months, June, with five sessions to go, has produced a long-legged doji. The all-time high of 5897.69 on June 9 stands.
QQQ (PowerShares Nasdaq 100 ETF) in the week ended Wednesday lost $239 million, following redemptions of $486 million in the prior week (courtesy of ETF.com).
Russell 2000 mini-index: Currently net short 15.4k, down 22.9k.
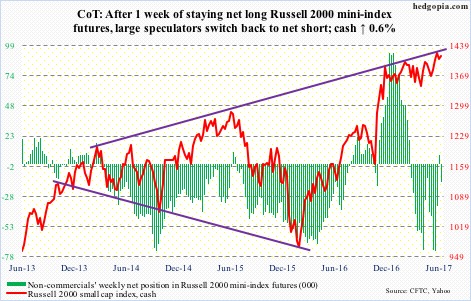
In the week ended Wednesday, IWM, the iShares Russell 2000 ETF, attracted $145 million (courtesy of ETF.com). This was the fourth straight weekly flows totaling $3 billion, $2.4 billion of which came in the last two.
Incidentally, the cash peaked on June 9 at 1433.79. Thus, IWM flows the past couple of weeks have been under water. Remains to be seen if this ends up impacting flows going forward.
Equally important is if longs will be able to forge a successful breakout retest whenever one occurs. Thursday came close. Prior to a breakout three weeks ago, the Russell 2000 went sideways between 1340s and 1390s for six months. The top of the range also approximates the 50-day (1393.03).
So far, so good. Bulls defended the 20-day and reclaimed the 10-day this week.
US Dollar Index: Currently net long 5.6k, down 22.4k.
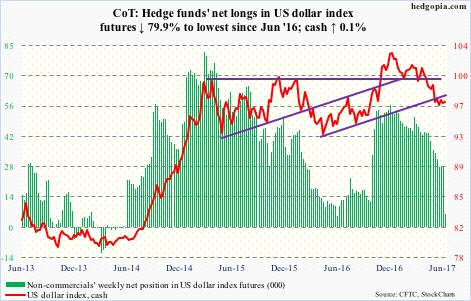
On the weekly chart, there is room for the cash to rally. The daily on the other hand is beginning to look a little stretched, with the cash (96.94) not able to break out of near-term resistance at 97.3. A breakout here would have opened the door for a test of the 50-day at 98.05. Daily Bollinger bands have tightened, which usually precedes a sharp move one way or the other.
Non-commercials continue to show disinterest, with net longs lowest since June 2016.
VIX: Currently net short 143.8k, up 14k.
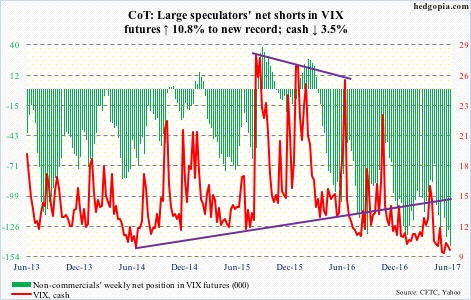
Yet another week and yet another instance of the now-dropping 50-day resisting a rally attempt by the cash. And yet another week of a sub-10 reading, which occurred intraday Friday.
At the same time, bulls are defending the low end of a multi-year range VIX is in.
So the saga continues, with volatility bears staying with their massive net shorts and bulls longing for a squeeze.
Non-commercials are the most net short ever, even as in the week to Wednesday, VXX (iPath S&P 500 VIX short-term futures ETN) took in $40 million. This followed inflows of $98 million in the prior two (courtesy of ETF.com).
http://www.hedgopia.com/cot-peek-into-future-through-futures-how-hedge-funds-are-positioned-6/
• DiscoverGold
Click on "In reply to", for Authors past commentaries
Information posted to this board is not meant to suggest any specific action, but to point out the technical signs that can help our readers make their own specific decisions. Your Due Dilegence is a must!
• DiscoverGold
Join the InvestorsHub Community
Register for free to join our community of investors and share your ideas. You will also get access to streaming quotes, interactive charts, trades, portfolio, live options flow and more tools.

