CoT: Peek Into Future Through Futures – How Hedge Funds Are Positioned By Hedgopia | June 17, 2017
Following futures positions of non-commercials are as of June 13, 2017.
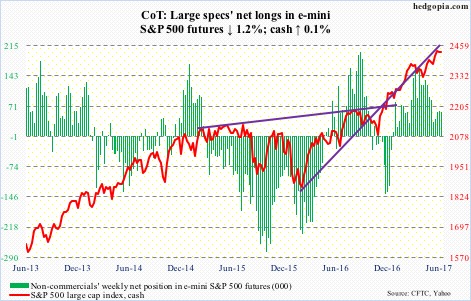
E-mini S&P 500:Currently net long 57.8k, down 710.
Bulls and bears are fighting a tug of war around 10- and 20-day moving averages on the cash. The former was not able to cash in on the inflows. The cash inched up 0.06 percent during the week.
In the week to Wednesday, SPY (SPDR S&P 500 ETF) gained $5.4 billion (courtesy of ETF.com). Another $4.8 billion moved into IVV (iShares core S&P 500 ETF) and VOO (Vanguard S&P 500 ETF) – $4.5 billion and $327 million, respectively.
In the same week, $10.9 billion moved into U.S.-based equity funds (courtesy of Lipper).
The real question is, will the bulls come up with funds when 2400 is tested? The S&P 500 broke out of it three weeks ago. The 50-day is right around there – currently 2393.18 and rising.
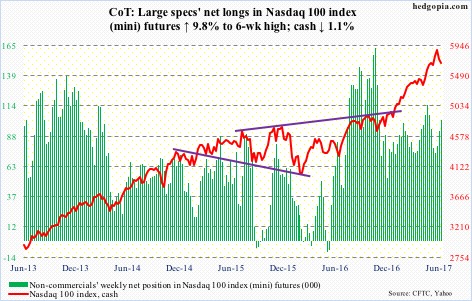
Nasdaq 100 index (mini):Currently net long 101.6k, up 9.1k.
After last Friday’s 2.4-percent rout, the cash (5681.48) began the week by finding support at the 50-day, followed by rejection at the 20-day. The 50-day was defended again Thursday. Bulls cannot afford to lose this as well as horizontal support at 5450.
Flows are not helping.
In the week through Wednesday, QQQ (PowerShares Nasdaq 100 ETF), lost $486 million (courtesy of ETF.com).
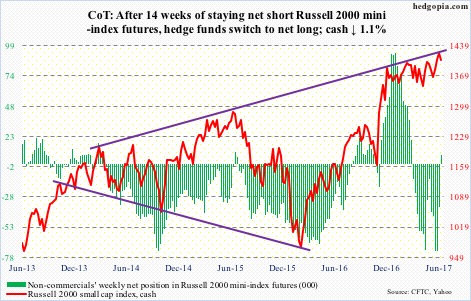
Russell 2000 mini-index:Currently net long 7.5k, up 43.2k.
Early this month, the cash broke out of a six-month rectangle, followed by a new high of 1433.79 on the 9th. Previously, there were two false breakouts – one in February and the other in April. Each of the breakouts brought a new high, thereby helping forge a rising channel.
Last week, the index was rejected at the top of that channel, the bottom of which lies around 1360. The 50-day (1388.88) will be tested before that; right around there lies the top of the afore-mentioned 1340s-1390s box.
The point is, there is support, but it needs to be defended.
In the week ended Wednesday, IWM, the iShares Russell 2000 ETF, attracted $2.2 billion (courtesy of ETF.com). Will flows cooperate when they are needed?
Importantly, in the past couple of weeks, non-commercials’ holdings went from 73k net shorts to 7.5k net longs. Bulls were not able to cash in on this squeeze, as the cash went sideways.
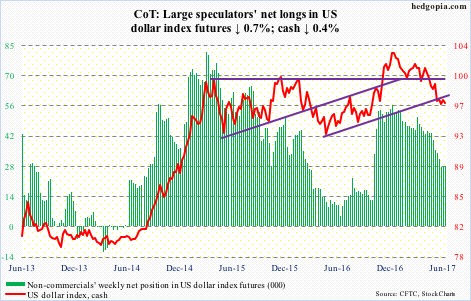
US Dollar Index:Currently net long 28k, down 197.
The cash responded to the Fed’s hawkish language Wednesday by initially dropping 0.7 percent before bids showed up to essentially close the session unchanged. This was followed Thursday by defense of the lower Bollinger band.
On the daily chart, a bullish crossover between 10- and 20-day seems to be in the works, even as the Bollinger bands have tightened.
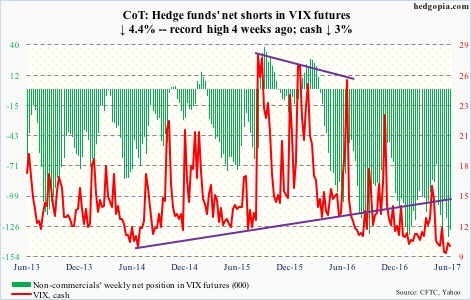
VIX:Currently net short 129.8k, down 6k.
Last week’s intraday high of 12.11 was surpassed Monday when the cash rallied to 12.37, but once again, it failed to hold. Twice in the week, VIX (10.38) rallied past the 50-day intraday, only to close under.
VIX continues to linger around the bottom of a multi-year range, but lifting off of it has proven difficult. That said, when it does, it has shown a tendency to do that in a hurry. In May, intraday it jumped from 9.56 to 15.71 in eight sessions.
Click on "In reply to", for Authors past commentaries
Information posted to this board is not meant to suggest any specific action, but to point out the technical signs that can help our readers make their own specific decisions. Your Due Dilegence is a must! • DiscoverGold
Register for free to join our community of investors and share your ideas. You will also get access to streaming quotes, interactive charts, trades, portfolio, live options flow and more tools.


 News
News  Market Data
  Discover