CoT: Peek Into Future Through Futures – How Hedge Funds Are Positioned By Hedgopia | July 8, 2017
Following futures positions of non-commercials are as of July 3, 2017.
E-mini S&P 500:Currently net long 69.6k, up 44.6k.
Kudos to the bulls for saving the week. Down 0.6 percent at one point, the cash ended up 0.07 percent. The 50-day as well as 2400 was tested for the second straight week, and held – for now. It is longs’ ball to lose, at least near term.
That said, at least until Wednesday, flows were not cooperating.
In the week ended that session, U.S.-based equity funds lost another $3.3 billion – now down $15.2 billion in the past three weeks (courtesy of Lipper).
In the same week, IVV (iShares core S&P 500 ETF) and VOO (Vanguard S&P 500 ETF) together took in $790 million – $609 million and $181 million, respectively. But SPY (SPDR S&P 500 ETF) experienced bigger redemptions – $2.2 billion (courtesy of ETF.com).
Nasdaq 100 index (mini):Currently net long 38.6k, down 12.6k.
The cash is trying to push off of the bottom of a short-term channel – an opportunity for the bulls to step up to the plate. But flows are not cooperating.
In the week through Wednesday, $1.4 billion was withdrawn from QQQ (PowerShares Nasdaq 100 ETF). In the prior four, $1.5 billion came out.
The Nasdaq 100 (5656.47) lost the 50-day last week, as it did the rising trend line from last November. The average is one percent away. Failure to recapture it ultimately exposes the index to breakout retest at 5450.
Russell 2000 mini-index:Currently net short 18k, up 1.4k.
The bulls and bears continue to fight over control of shorter-term averages on the cash, with the former struggling at 1420s for several weeks. Thursday’s 1.4-percent drop also tested the 50-day – now flat to slightly down – and held.
Nonetheless, the weekly chart has produced a back-to-back long-legged doji.
Near-term, the bulls’ real test lies in if they can save 1390s. The Russell 2000 went sideways between 1340s and 1390s for months before a breakout five weeks ago.
At least in the week ended Wednesday, funds were uncooperative, with IWM (iShares Russell 2000 ETF) losing $472 million (courtesy of ETF.com). This followed redemptions of $810 million in the prior week.
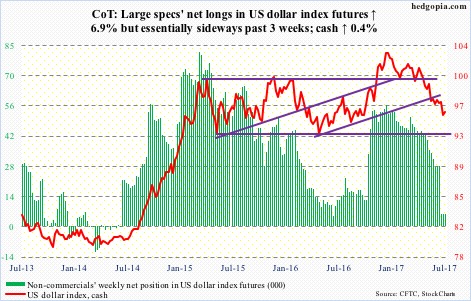
US Dollar Index:Currently net long 5.8k, down 378.
The cash did not even get to test 96.50-ish, as it was rejected at 96.26 just under the 10-day, which, along with the 20-day, need to stabilize for the dollar index to begin to unwind oversold conditions.
Medium term, the path of least resistance is up.
All the better if non-commercials begin to accumulate net longs, which have gone flat the past three weeks.
VIX:Currently net short 123.6k, down 11.4k.
For the second week running, the cash (11.19) went after the 200-day. Unlike last week, it took it out Thursday, only to lose it the next – has room to go lower on the daily chart.
Medium-term, the 50-day (10.75) is now flat to slightly up – potentially important development should it hold.
 News
News  Market Data
  Discover