The following are futures positions of non-commercials as of March 15, 2016. Change is week-over-week.
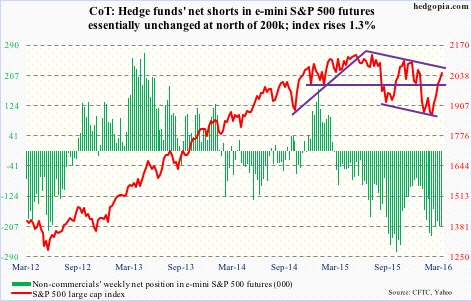
E-mini S&P 500: Some signs of FOMO (fear of missing out) are showing up. Buy-the-dips is persistent, and has worked so far. Most indicators are at extreme complacent readings.
The percent of S&P 500 stocks above 50-day moving average rose to over 93 percent. On January 20th, this dropped below 10, to nine. From one extreme to another! We know how that ended for the bears. And we know how this is going to end for the bulls.
In the week ended Wednesday last week, $4.6 billion moved into U.S.-based equity funds – first inflows in 10 weeks. Turns out it was just a one-hit wonder. This week, there were $2.1 billion in outflows (courtesy of Lipper). With this, since the week ended February 10th, nearly $10 billion has been withdrawn. (The S&P 500 bottomed on February 11th.)
The Lipper data also shows that $35.9 billion left money-market funds this week. This jibes with the ICI data showing a decline of nearly $40 billion in money-market funds in the same week. Not much made it into stocks, as Lipper shows.
That said, SPY, the SPDR S&P 500 ETF, has been attracting funds of late – $3.1 billion in the week ended Wednesday, and $2.4 billion since the S&P 500 broke out of 1950 on March 1st (courtesy of ETF.com).
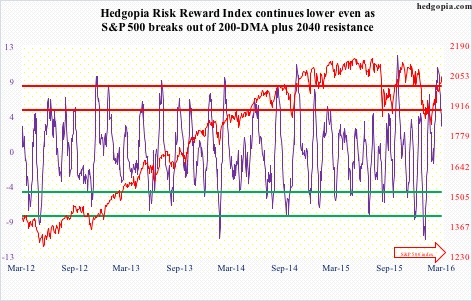
This week, the S&P 500 took care of 200-DMA, as well as 2040. Momentum is intact, but reversal risk is very high.
Currently net short 205.9k, up 290.
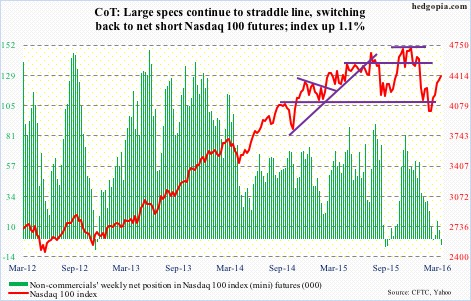
Nasdaq 100 index (mini): Broke out of 4350, but action is lethargic.
On Wednesday through Friday, the index closed right underneath 200-DMA, with a doji on Friday. The $2.3 billion that moved into QQQ, the PowerShares Nasdaq 1000 ETF, in the week ended Wednesday is probably betting that the average will be taken care of. The inflows followed defense of 50-DMA on Thursday last week. Failure to take out 200-DMA risks these inflows leave briskly.
Currently net short 4.4k, down 11.2k.
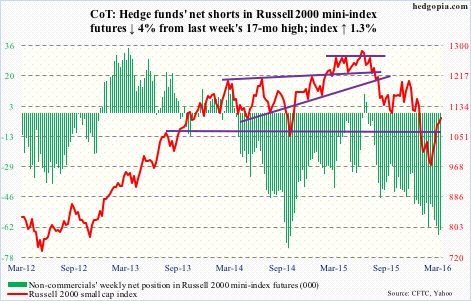
Russell 2000 mini-index: Until Friday, the Russell 2000 went sideways for two weeks. IWM, the iShares Russell 2000 ETF, attracted $1.3 billion during the period (courtesy of ETF.com). These longs are not making much money.
Friday was a saving grace, with the index feebly breaking out of the two-week congestion.
Non-commercials are not convinced this will continue. Net shorts remain very high, with last week at a 17-month high.
Currently net short 63.5k, down 2.7k.
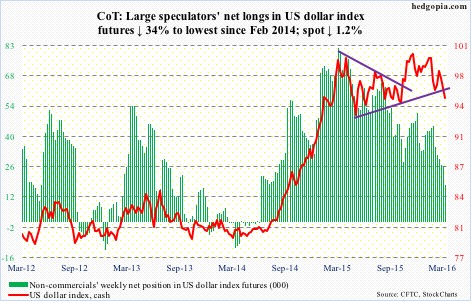
US Dollar Index: In the currency land, what the dollar index experienced on Wednesday and Thursday can be described as shellacking – down two percent.
Support at 97 is gone. In fact, on Wednesday – the FOMC decision day – the index tagged that resistance, which is where 200-DMA lies as well, and was vigorously denied.
Non-commercials continue not to show any love. They cut net longs to the lowest since February 2014.
That said, daily momentum indicators are grossly oversold.
Currently net long 17.5k, down 8.9k.
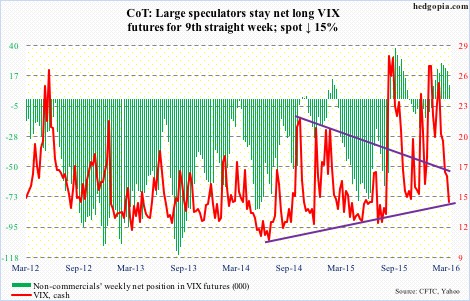
VIX: The August 2015 rising trend line, which otherwise was providing support, was broken on Wednesday, and spot VIX lost three points in a couple of sessions.
Ray of hope for volatility bulls: Friday produced a doji at the lower Bollinger Band.
As well, the VIX-to-VXV ratio closed the week at 0.78, matching the mid-March low last year. Also, this was the first time the ratio dropped into oversold zone in three months. Time to rally!
 Market Data
  Markets