 News
News  Market Data
  Discover
Support: 888-992-3836
Copyright © 2023 InvestorsHub Inc.


No-Quarter
![]()
Register for free to join our community of investors and share your ideas. You will also get access to streaming quotes, interactive charts, trades, portfolio, live options flow and more tools.
Register for free to join our community of investors and share your ideas. You will also get access to streaming quotes, interactive charts, trades, portfolio, live options flow and more tools.
Another day ending with a Doji on the daily. This makes 4 days in a row for SPY and QQQ.
https://stockcharts.com/h-sc/ui?s=SPY&p=D&yr=0&mn=6&dy=1&id=p95039734664
https://stockcharts.com/h-sc/ui?s=QQQ&p=D&yr=0&mn=6&dy=1&id=p95188301295
BOIL too...
https://stockcharts.com/h-sc/ui?s=BOIL&p=D&yr=0&mn=6&dy=1&id=p34461796644
Seems like the market is just waiting for an event to appear...

That made me laugh. Thx
Yup, their was a full candle print above the 9ma on both Sep 5th, and 6th. I bought on the 5th. The following Monday the 9th candle closed below the 9ma. The next day Tuesday the 10th was a Doji. I bailed that Tuesday with a slight loss near EOD.
I am quick to get out of BOIL when the chart hints of turning.
The chart is looking much stronger now. Today, I decided to get back in BOIL again.
Your tenacity to hold on since the 6th is more agressive than I typically am. Well done!
https://stockcharts.com/h-sc/ui?s=BOIL&p=D&yr=0&mn=2&dy=1&id=p18449165271

This will be interesting to follow. Thx
More regarding the Zerohedge article;
Doug Clinton, CEO and founder of Intelligent Alpha
https://www.thedeload.com/p/the-secret-intelligent-alpha-master
BOIL looking interesting again. Showed a buy signal last week Friday, but I chose not to act.
Today looks to be confirmation. I will likely buy before EOD. GLTY
https://stockcharts.com/h-sc/ui?s=BOIL&p=D&yr=0&mn=6&dy=1&id=p12808135353

Thank you for sharing your analysis. I always appreciate it.
I sold SPXL near EOD Thursday. Sold others near EOD Friday.
Looking at the 60min BP's, is market roll-over on the horizon? Like you, I am watching for this. Not here yet though. GLTY
https://stockcharts.com/h-sc/ui?s=%24BPSPX&p=60&yr=0&mn=1&dy=1&id=p24506053613

https://stockcharts.com/h-sc/ui?s=%24BPCOMPQ&p=60&yr=0&mn=1&dy=1&id=p24506053613

EDIT: Pundits and macro analysis are often distractions and crystal ball ramblings. Got to believe (and act on) the charts!!!
Speaking of which, I just scanned through mine and noticed gravestone doji's forming on several as we approach EOD. A change in momentum coming? We will see what tomorrow brings.
I applaud your success today. Being the day after the first rate cut, today could have gone either way. You placed a bet and bet correctly. I chose to wait and ended up chasing one this morning. Did you also ride GUSH starting on Aug12 or 13th? My reading of your chart indicates to me a similar alignment of your signals. Yes?
Edit: I bailed out of SPXL before EOD to capture a gain. Even though the chart shows a inverse head and shoulders that suggests it goes higher, I didn't like the Doji forming. GLTY
https://stockcharts.com/h-sc/ui?s=SPXL&p=D&yr=0&mn=6&dy=1&id=p21587060324

https://stockcharts.com/h-sc/ui?s=SPY&p=D&yr=0&mn=6&dy=1&id=p95039734664

I hadn't thought of that, but YES!
Oil consumption is dropping worldwide due to lower consumer demand. Worldwide oil producers have tanker ships in route to locations that don't have capacity to receive it. This article describes how oil prices are going to go negative again!!!
https://www.zerohedge.com/commodities/traders-are-most-bearish-oil-record-bears-conclude-opec-has-run-out-options
Towards the end is a summary of NatGas that suggests the bottom is now., and upturn expected this winter. GLTY
With the main airconditioning season almost over, inventories will soon start rising faster, and are likely still to be above average when the main winter heating season starts on November 1.
But the surplus will be much smaller than a few months ago, and prices have begun to climb, reflecting the more balanced outlook for winter 2024/25.
Who picked Exploding pagers for September?

How about Exploding walkie talkie's? Anyone?
Unbelievable treachery...
On an unrelated computer/PC topic, I have been hacked twice in the past 10 days.
First, I received an alert from Norton/Lifelock that a Payday loan had been taken out in my name. I contacted Lifelock the same day and disputed it. They are taking actions on my behalf from here.
Second, my rarely used TradingView account was accessed by someone in Finland. They used my credit card info (stored with TradingView!!!) to upgrade my account from a lower level, to an expensive full featured account, change the language to Russian, then started loading an over helming amount of crypto alt coin charts with alerts. I was suddenly seeing chart alerts every few minutes.
My fault. I was not using the two step log in verification option readily available. Like I said, I rarely use this account.
I had never connected TradingView with any brokerage account, so no concern someone would gain access to brokerage/banking information, but they could have tried.
I canceled my credit card, and closed the TradingView account.
Were not in Kansas anymore Toto...
For me, I find it preferable to keep a rather simple laptop to use for trading, banking, and email, and a separate more powerful PC (desktop or laptop) for gaming.
From time to time, I have found it useful to have two separate PC's in my home office too. Just a thought for you.
Might want to consider changing out your C drive for a 1T ssd (or 2T!) before you move from W10 to W11.
I believe the rule of thumb is to keep your boot drive less than half full.
https://www.donemax.com/copy-disk/change-primary-hard-drive.html
Tomorrow 1:00 Eastern, the "You are here" marker moves. GLTY.
https://finance.yahoo.com/news/heres-exactly-investors-buy-stocks-033914143.html

I upgraded from 10 to 11 approx 12 months ago. It was basically a non event for me. No issues.
In case it was not clear, added a 'We Are Here' marker.


EDITED, video added ;)
Are you still wheelin', or back home now?
https://www.youtube.com/shorts/tS5S1xOS3ZE
I agree with your assessment of the current state of AI.
When the internet was first becoming main stream, and being embraced by the masses, many issues appeared that prevented its scalability and wide spread adoption. Useability, scalability, capability, speed, security, integration, and others appeared and were solved over time. Cisco was the main player in the beginning, then its technology was eclipsed by other innovators that were able to identify and solve scalability issues.
I view AI not as an event, but as a wave of technology that is in its infancy, and has a long way to evolve not unlike the internet experience we all had.
Similar to Cisco, I believe Nvidia will peak, fall, and eventually make way for others to follow in its path.
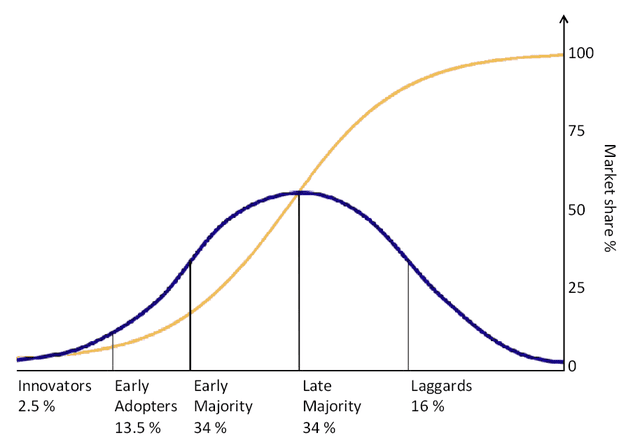
I am thinking we are near the end of the innovators phase, and entering the adaptors phase.
https://whatfix.com/blog/technology-adoption-curve/
https://setandbma.wordpress.com/2012/05/28/technology-adoption-shift/

Yup, Uncle Warren, his insurance company guru Ajit Jain, also Michael Dell, Jenson Huang, and all the executives at Microsoft too. Dumping hugely, and for a while now. The folks at Nvidia take the cake though, announcing a stock buy-back program. If the retail public wont buy the insiders stock sales fast enough, just have the company do it!!! Tick tock...
https://www.cnbc.com/2024/09/12/ajit-jain-dumps-more-than-half-of-his-berkshire-hathaway-stake.html
https://www.cnbc.com/2024/08/28/nvidia-announces-50-billion-stock-buyback.html
Here's one more thing to ponder this weekend.
The Hindenburg Omen was a proposed technical analysis pattern, named after the Hindenburg disaster of May 6, 1937. It was created by Jim Miekka, who believed that it predicted stock market crashes.
As a rule, the shorter the time-frame in which the conditions listed above occur, and the greater the number of conditions observed in that time frame, the stronger the effect. If several—but not all—of the conditions are repeatedly observed within a few weeks, that is a stronger indicator than all of the conditions observed just once during a 30-day period.

This is something I am watching closely.
"
At the height of the dotcom bubble, Cisco was worth 5.5% of US GDP.
— Financelot (@FinanceLancelot) July 15, 2024
Today $NVDA market cap is worth 11.7% of GDP, over 200% higher... https://t.co/l4NefeNtc2 pic.twitter.com/1ORJRGjB4l

I saw a similar signal on my 60min chart this afternoon too. Chose not to act. Going to wait to see the daily move. GLTY
https://stockcharts.com/h-sc/ui?s=OILU&p=60&yr=0&mn=1&dy=1&id=p95467285747

Good catch. I have been watching NatGas and Crude for gulf hurricane effects this week. You just gave me more reason to be watching crude oil closely. Thx
https://stockcharts.com/h-sc/ui?s=OILU&p=D&yr=0&mn=6&dy=1&id=p51246157226

https://stockcharts.com/h-sc/ui?s=OILU&p=60&yr=0&mn=1&dy=1&id=p95467285747

This might cause NatGas and Oil to get interesting...
https://www.zerohedge.com/commodities/goldmans-take-energy-markets-ahead-rocket-fuel-gulf-propelling-francine-towards

I use both, but I like SC links embedded into PowerPoint.
Why do you ask?
Thx for the Eurodollar University link. I like that guy.
Beautiful part of the country. Wheeling on your own or as part of an organized event?
I bought UVIX during the dip this afternoon. Thinking next week could bring more volatility. GLTY

You may have responded to a year old post, but I agree with what you said. The charts will show which one is the better swing. Safe travels! GLTY
BOIL above the 9ma today. I'm starting to watch it again.

Hummmmm....
https://fred.stlouisfed.org/graph/?g=1tiFv
https://fred.stlouisfed.org/graph/?g=1tiBw
https://archive.is/eF5vD
With no recession — because the Fed didn’t overtighten — the curve inversion, deepened and lengthened by the absence of a buyers’ strike, cannot be assumed to be a recession omen this time around. That also means the disinversion can’t be taken as proof positive of an imminent downturn. Instead the curve steepening thus far just reflects expectations of the Fed easing rates gradually into a slowing economy.
Our best guide for a recession continues to be leading economic indicators, and as mentioned above they show little sign of a slump in the next 3-4 months. But if ultimately there is one, it would be a mistake to say the yield curve told you so.
All the chatter the past few days has been 'new highs this week'. Today was an example of why Duma says 'follow the charts'.
So far this chart is treating me well.

...I'm watching for an entry signal into UVIX tomorrow. GLTY

Here is another vote for the same...
Lookie what happened yesterday...
https://fred.stlouisfed.org/graph/?g=1tiFv
https://fred.stlouisfed.org/graph/?g=1tiBw
Another reason me thinks we get a brief melt up in front of the rate cut mid September. GLTY
The market showed its hand this morning. $VIX lower. Looks like new all time highs in the big three coming next week. SPXL chart below looking to make a double top, then move lower. GLTY

NVDQ - after hours movement indicates tomorrow it will open above the 9ma in the $5 area. If this occurs, I will likely buy.
The rising wedge on the below chart suggests it will go towards the $9 area, a ~60% gain. GLTY

This was all prompted by Duma. His analysis comparing the performance of FNGU to the individual Mag 7 stocks was an eye opener for me.
FYI, here are the 14 I am tracking -
APPU, MSFU, NVDX, GGLL, METU, AMXN, TSLT
The above are all 2x single stock ETF's
APPD, MSFD, NVDQ, GGLS, METD, AMZD, TSLZ
NVDQ and TSLZ are 2x inverse single stock ETF's. All others are 1x.
GLTY
Based on your analysis you shared a week or so back, I started tracking the 7 individual Mag7 stocks. I'm using the individual stock ETF's on all 7 actually for a bit of leverage. 14 charts in all counting the 7 inverse single stock ETF's.
I am currently watching/waiting for an entry into NVDQ to present itself (chart below). Blue bars on the 6mo daily chart below indicate current trend is stalling. Earnings reporting this week Wed after the closing should break the stall one way or the other...
I will try to toggle back and forth between NVDX and NVDQ as the chart signals allow. GLTY


Yes, lots of eyes will be watching for that one.
The J Powell dance last week was successful. Oil up, gold up, silver up, bitcoin up,... Now the final blow off until the first rate cut mid Sept?
The S&P chart is forming a double top. Like you, I am thinking when this chart rolls over, we go much lower. I will be watching for a test of the 200ma as support, bounce off of it, then break below it going lower still. I am just watching/waiting for the chart to tell me what to do. GLTY


