 News
News  Market Data
  Discover
Support: 888-992-3836
Copyright © 2023 InvestorsHub Inc.


Register for free to join our community of investors and share your ideas. You will also get access to streaming quotes, interactive charts, trades, portfolio, live options flow and more tools.
D > don't know which is wilder IBIT or NG >
bought 1 IBIT on 7/24 @ 38.07 just to mess with > Dumped it at 38.48
guess the only way to use / chart it is some BTC 24 / 7 charts
Im guessing that it will bounce at the trendline, lot depends on what FED says next Wed.
This is a really scary analysis. We know that mainly Calif, NY and Illinois are bleeding their tax base each year. Here is an analysis that covers the effect of 20 years, which I had never considered.
In 2022 they lost $9.8B is tax base (AGI). According to the article about 85% of the AGI gets taxed at a flat rate of 4.95%. That amounts to a loss of $412M in taxes.
But the real story is the amount of cumulative AGI that the state has lost over the last 20 or so years. The tax base that has left each year just adds to the total base that has been lost. It is now up to $88B. Using the calculation above that means in 2022 they lost a total $3.7B in revenue.
If I assume they lost another $10B in AGI for 2023 and 2024, that means they will be losing $4.5B in potential revenue. That is almost 10% of their budget that calls for $52B in revenue in 2025. So those left just have to keep paying more and more.
The fun part is that some other state has that revenue. I would love to see the same analysis for CA and NY.

This market is getting serious. NASDAQ is about to hit a big time break point. If it doesn't hold Feb/Mar highs, look out.
Second chart is tracking pull back sizes, just like I have started doing.


I did not know that, thanks.
same with the AM 9:25 to 9:30
Add to that
STM down -20%
Universal Music (UMGNF) -30%
Serious damage going on.
Read a cool book a few years ago about it blowing and what it took for the hero to get out of there. Survival was marginal for hero and not for most.
Let's see if you pixx away $1B a year of EV's, you think that is an issue? And then have to keep recalling them because you don't have the bugs out. In today's world, dealers are making a killing on recalls and factory warranty.
Also don't forget that the market is closed from 4pm to 4:05.
I put in a limit order to buy SGOV at 4:03:xx, it executed at 4:05:00.
The last 30min always tells a story.
From 15:25 to close
SPY +.3% to -.5%
QQQ +0% to -1.1%
$FAZ.......Daily....for tomorrow daily trend HH.....
To hit green dot line...About + 4.5%.....MAYBE ..OPINION..
https://schrts.co/IpAnjyJq
Ford Motors tanked this morning. Wow.
Another to add to the list...
https://stockcharts.com/h-sc/ui?s=F&p=D&yr=0&mn=6&dy=1&id=p34864427118
Thanks, makes sense. If TNA can break 48.38 that will be a big hurdle.
The macro analysis 'theory' I heard talking heads spouting ~2 weeks ago was;
Nasdaq showing signs of topping.
The market value of the Nasdaq was tremendously large compared to non-tech, and the tremendous amount of Nasdaq gains being booked had to go somewhere.
The market value of money market funds was staying steady.
So where does all the money flow next?
Non-tech value funds.
...and the IWM was the most undervalued.
So far the charts appear to be supporting this 'theory'.
Currently I am riding TNA as my Big Three 'horse'.
While the daily TNA chart below told me to sell yesterday.

The weekly IWM chart below was indecisive, so I choose to hold TNA one more day. GLTY

Why do you think small caps would be gaining steam this early into a economic pull back? I don't follow SmCaps, so I have no clue of the history.
It appears the rotation into small caps is intact. Look at the lower right corner of the Big Three charts below.
Only two show the 12PMO has flipped. GLTY


I forgot to mention that of course the current pull back may not be over. The BOT numbers are as EOD.
from 1973 – 2017. Red circles are all quakes, and blue circles are earthquakes that were part of swarms.
https://d9-wret.s3.us-west-2.amazonaws.com/assets/palladium/production/s3fs-public/styles/full_width/public/vhp_img5791.jpg?itok=a4geSyOR
I'm thinking you are spot on.
Yellowstone is a serious disaster waiting to happen...HUGE geothermic activity in that area...could be the next Volcano...
D > I'll get back on this subject later >

D > you can add this to the list >
New Car Incentives Soar 53% Amid Rising Inventories & Lackluster Demand
We are now on our 2nd major pull back for the year. This one is already larger than the one in Mar. How deep will it goes. My sense is that the selling is going to accelerate.
 SPY	.	.	QQQ

 Top	Bot	.	Top	Bot

 03/27	-5.5%	.	03/22	-7.1%
 07/16	-4.0%	.	07/10	-7.9%
$FAZ......Daily..........
Daily ZIG.
https://schrts.co/wuDhWNWP
At mid day yday, I had a daily buy signal for SPY. By EOD that signal was gone and boy what a 24 hr period. SPY is down today -1.5%, QQQ -2.3% and FNGU -3.4% (1x). Looks like all these negative reports are just getting to be too much.
I can't find a w3 down setup anywhere in my charts, so I am not sure what that means.
I am sure you have seen all these headlines, but they look more impressive all together.
US Services Soar, Manufacturing Slumps In Preliminary July PMIs
Blackstone Mortgage REIT Slashes Dividend By 24% As Distress Piles Up In CRE World
New Car Incentives Soar 53% Amid Rising Inventories & Lackluster Demand Hint At Downturn
Signs Of Severe Credit-Card And Auto-Loan Stress In Generation Z
Deutsche Bank Plunges After Jump In CRE Loss Reserves, Shelves Plans For Buyback
I think I figured out what the time in force "GTC(13h) refers to, 7AM to 8PM, the normal 13 hours available to me. However AH orders have to be limit orders. So I see no way to use a limit order to protect against downside. Need stop orders to do that. So I don't see that GTC(13h) is of any use to me.
To trade AH one has to be in the seat making the trade. One could scalp breakouts, but that is all I see.
Have done lots of options in the past. A delta or .70 is the sweet spot for me. Good luck.
I understand your suggestion, and I used to do such, as well as perform all kinds of additional analysis on NatGas and extrapolate to the BOIL/KOLD pair. However, I found all this work resulted in less than satisfying results. I prefer simple, and I find it simple to apply common swing trade tools to daily and hourly charts.
If I see a particularly strong swing trade signal forming, I may grab OTM call options that expire 30 to 45 days out, and hold them for 3, 5, or maybe 7 days until the chart swing trade signal softens. To be specific, OTM call options 30 to 45 days out, with a strike price that has a delta of approx 0.70. These work well for me.
Options are not a usual topic on this board, so I don't talk much about this here. GLTY
The Gods are angry >
Lucky as far as I know no one hurt >
Scalding water and rock not a way to go
Something is different in Yellowstone Park this summer...
BOIL will gap up further than #natgas gas...and when NG gaps up most likely it fills the gap...I suggest following NG chart before making your decisions on BOIL and KOLD...NG is trading fundamentals while its low in its cycle...last week shorts attacked the price and sent it down further because Freeport was still having issues they sent a lot of Vessels away but were able to fill one over the weekend...another Vessel arrived today and is waiting to get filled...EQT reported earnings and stated they will increase production that's why NG was falling after hours...but this was already known...Bears are trying to take NG back down but I doubt they will succeed again...BOIL is a buy irregradless to it's volatility...hold for a few weeks and voila...
see what goog does to the Naz after close
Re the Big 3, the rotation into the Russell 2000 appears to be continuing. GLTY

Earnings schedule >
easy to use >
https://www.nasdaq.com/market-activity/earnings
Add UPS to your list of todays tally.
https://www.cnbc.com/2024/07/23/ups-earnings-q2-2024.html
Weak freight demand and soft pricing in the shipping sector is causing what some call a global freight recession.
Everyday there is always a new list of companies that are crashing. So far today.
Increasingly Cautious Consumer": Polaris Shares Crash As High Interest Rates Crush Demand For ATVs & Jetskis
Porsche Slides On Profit Warning As Snarled Supply Chain Risks "Production Shutdowns"
US Existing Home Sales Puked (Again) In July...
But you just wait, the big boys will come in with big profits and the market will zoom again, while everyone else is dying.
But there is some really good news.
Department Of Defense To Give Troops 'Economic Hardship' Bonus Of $20 Per Month
Touching, what an insult.
I am up 8.8% as of yday, so I got room for wiggle. Set a stop at BE, going for a kill.
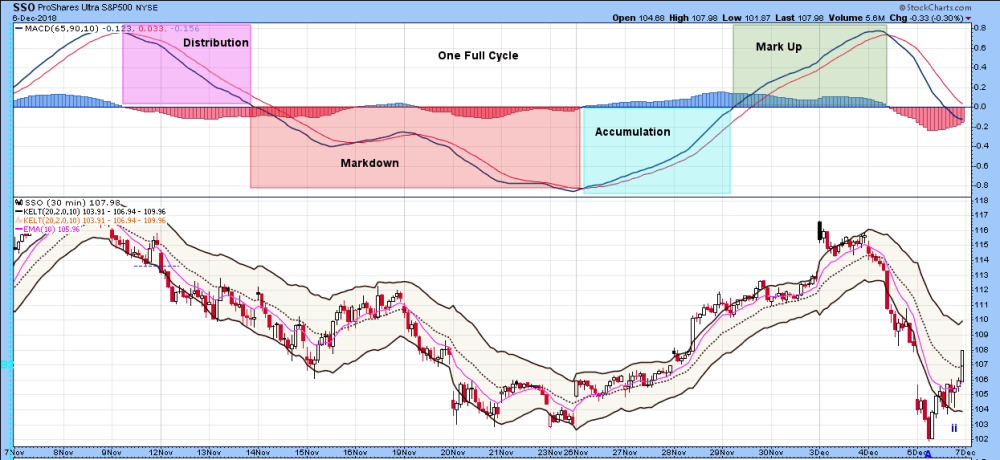
Ah, so you did. I saw your chart, looked at what you were doing with Keltner Channels, but missed the detail that you took a position. Thx for sharing!
So far today appears to not be similar to yesterday, so I continue to be on the sidelines. Still a lot of day left though. GLTY
https://investorshub.advfn.com/boards/read_msg.aspx?message_id=174789204
The one thing no one talks about is that China is selling all your US bond holdings. After seeing what we did to Russia, I would do the same thing. Even during WW2, we continued to honor our debt to anybody. China historically has been the biggest holder of our debt. I think they have sold about 25%. So who is replacing them. We are, but it took 5%+ rates to do it. ALL'S GOOD !!
Tos Web > better than Edge ( for certain but needs work )
I showed you my chart, I am in at 11.50. Current 11.24, so a small loss.
That was a very novel way of looking at how large our interest debt has grown. And he is right 76%. $140 B spent on interest and $185 B collected in individual income tax. I compare the interest spent to the total revenue which has been running 23%. The government likes to compare to GDP because it makes the numbers look insignificant. I think the number was about 7%.
But it gets even scarier if you look at the details. All these numbers are for June
 185B   40%    Individual income taxes
 181B   39%    SS revenue
  81B   17%    Corporate taxes
  19B    4%    All other
 466B   Total  Revenue

D > thanks for bringing up ibit >
as much as btc / ibit etc. moves around to me it maybe a good scalping etf >
that said I have Zero experience with btc trading of any kind but considered it
to be as wild as FX PIP trading meaning having the proper platform and tick chart settings etc. to deal with it >
still evaluating what I can and can't do with Tos Web > better than Edge ( for certain but needs work ) >
BOIL showing signs of life today. If tomorrow is another day like today, I will likely jump in. GLTY

Dark storm clouds are on the horizon...
https://dailyhodl.com/2024/07/21/interest-payments-on-us-national-debt-will-shatter-1140000000000-this-year-eating-76-of-all-income-taxes-collected-report/
The vast majority of Americans’ income taxes are now being swallowed up just to pay interest on the country’s national debt, new numbers show.
Economist E.J. Antoni reports that based on the Fed’s June numbers, interest on the national debt is the equivalent of 76% of all personal income taxes collected by the government.
Borrowers fell behind on paying their mortgages in June, pushing delinquencies up to the highest level in six months.
The national delinquency rate rose 14.5% in June from the month before, according to loan-level data from Intercontinental Exchange Inc.
ICE
1.06%
on Monday. The delinquency rate was higher in December 2023.
D > yes there is trading going on >
I was messing around trying fills but none executed (before 7AM ) & ( I was Not using Direct access) >

You said you could ram a trade through, so what you are saying that they are trading.
My order had limit buy of 38.50 well above the ask of 38.37, so why did my order not "ram" through?
No clue what "ramming" an order through means.
D > below is an example >
I have ARCA Nasdaq direct access so I'll see if I can ram a trade thru after 4 AM
My Direct Access did transfer from Edge along with other permissions futs/ options etc>
Below was 5:29 AM >

Block pop-up ads http://www.adfender.com/
Dividends http://www.nasdaq.com/symbol/spy/dividend-history
Three X ETF's http://www.3xetf.com/ETF_List
| Volume | |
| Day Range: | |
| Bid Price | |
| Ask Price | |
| Last Trade Time: |


