 News
News  Market Data
  Discover
Support: 888-992-3836
Copyright © 2023 InvestorsHub Inc.


sharpei
![]()
Register for free to join our community of investors and share your ideas. You will also get access to streaming quotes, interactive charts, trades, portfolio, live options flow and more tools.
Register for free to join our community of investors and share your ideas. You will also get access to streaming quotes, interactive charts, trades, portfolio, live options flow and more tools.
I've watched XALL for almost 10 years; it has wide swings, which means long waits between highs and lows.
$XALL...
$XALL....Squeezed btwn 10DA and 50DA...rsi=50. pic.twitter.com/zjJsq4zmTt
— Sharpei (@ChartzUp) April 22, 2024
$XALL: https://t.co/U5jsyIpau8
— Sharpei (@ChartzUp) April 16, 2024
$IGEN... but no one believed @chartzup! Today! Friday! February 16! The RSI closed @62.5!

Show me where there is any connection with IGEN re: Juan Ignacio Avila, CEO Prolog, MX!!! There is none!
Juan Ignacio Avila
2nd degree connection2nd
CTO at Prolog S.A. de C.V.
https://www.linkedin.com/in/juan-ignacio-avila-b5b06a8b/
No word concerning reverse split anymore but also no word on prolog. Make it BOLD and ALL CAPS; in other words NOTHINGBURGER!!!
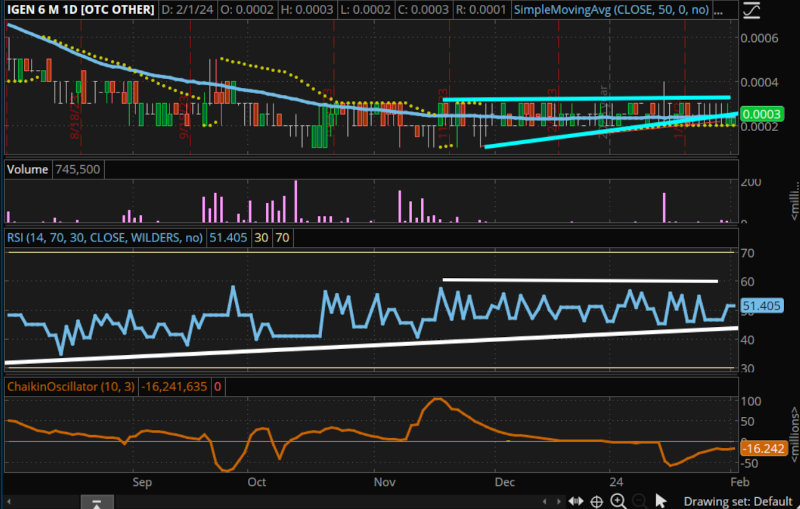
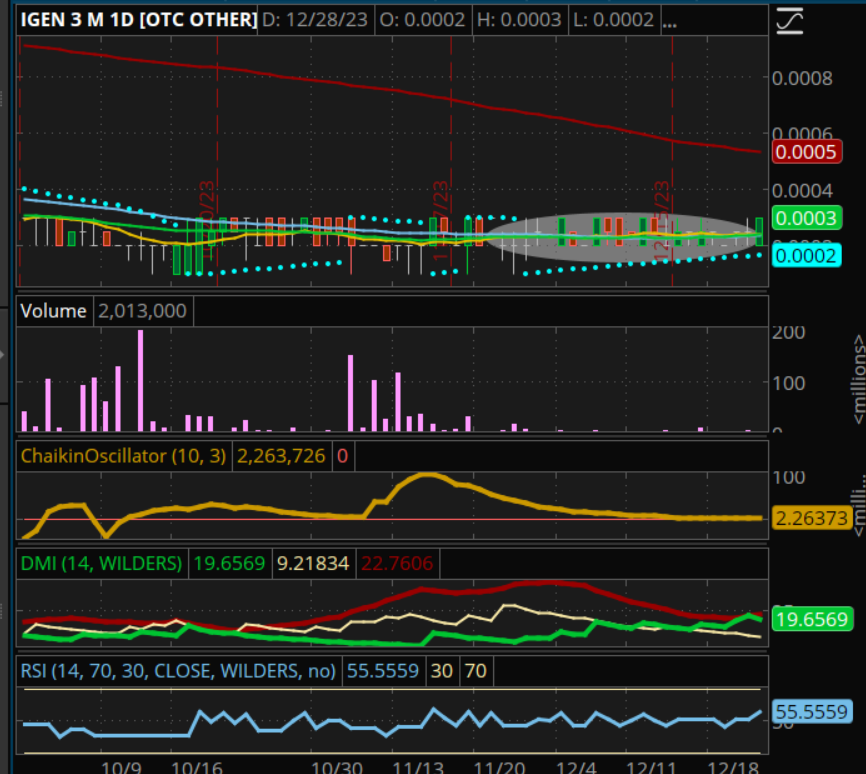
RSI @ 51; Dbl bottom Ch Oscillator; PSar support since November '23.
In reply to: MSU who wrote msg# 78490
Date: 01/23/2024 11:05:55 AM
Post #: 78,497 of 78,497
Bullish Engulfing Candles: "The two-candlestick pattern is a bearish candle followed by a larger bullish candle. The reason this is an indicator for an uptrend is that bulls are showing more strength than bears. The change in strength with the bulls shows a reversal of momentum that will likely continue into the future."
IC Markets
😅 Hekk if I know what you're talking about; question is, "Do you?" 🙃
When will news come, idk; but chart's looking good. RSI 55; double bottom choscillator; PSAR support solid since 11/29. 
Price broke through linear regression abt 10/5.
Double click on image to enlarge.
s'plain this: '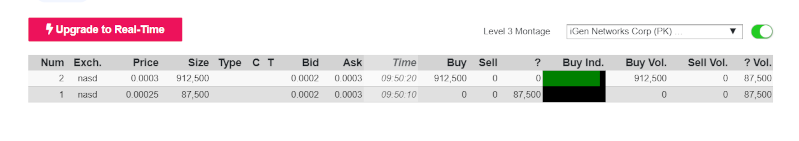 Manti, can you perhaps figure this....Check for yourselves.
"1M, below avg." since early today...What's going on-or not, anyone.
$XALL.....Love it!!!!
And we've got an Inverted Hammer on our last candle!!! 🐂
Still no news, but chart's been telegraphing since October of Trend shift: 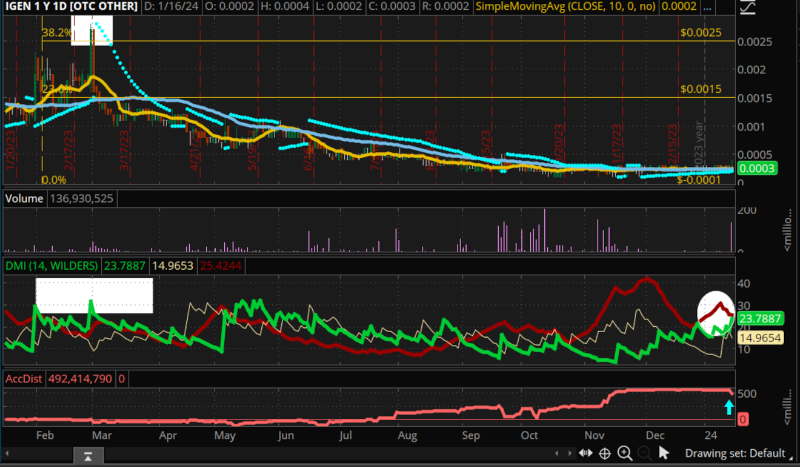
Click on image to enlarge.
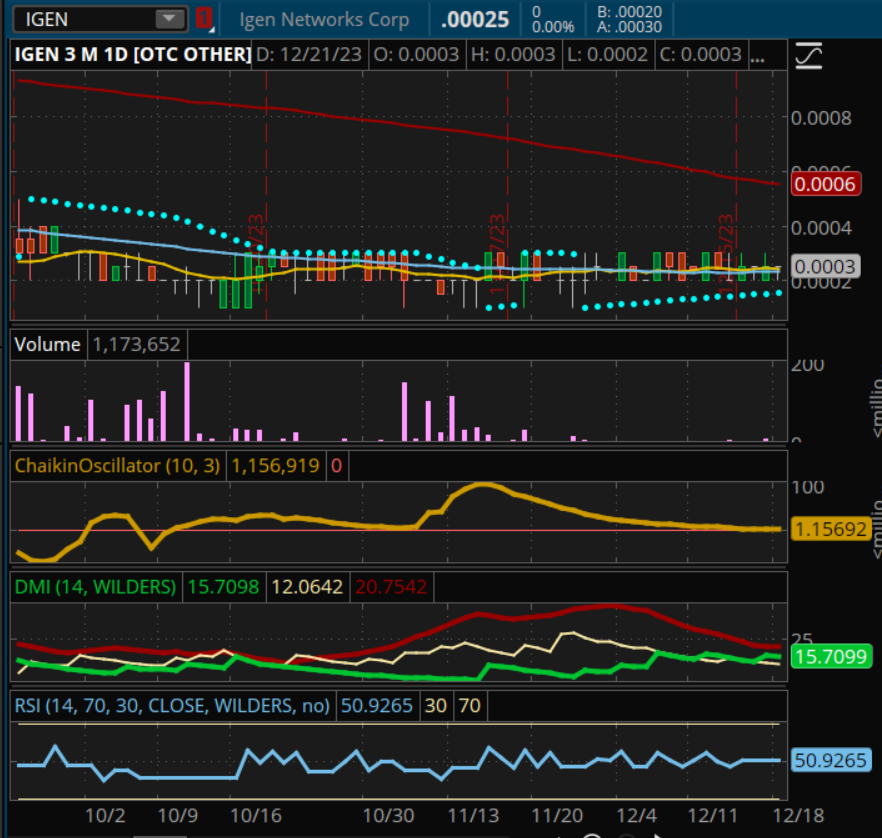
12/21: Check out the 30min/30day chart; the 10/50/200DAs are curled tight....actually the rsi on daily 6M is as well...
sharpei 12/14/23 2:17 PM
Post #78307
On 9/22/23 (apprx) chaikinosc hit @.0002; and on 10/9/23 (apprx) it hit nearest low, but higher than when price hit ,0001. On 11/17/23 chosc hit highest point since 8/10/20.
I no longer know how to add an image since iHub has modified its layout...Used to add image, but function no longer available... If anyone has the know-how let me know, pls.
$IGEN 5Y daily: Been studying this chart and these two technicals. Now we get 2 tiny buys, 100 and 11 (I think...). I'm only guessing but the ch oscillator may be telling us that a trend change may be occurring now...
Thank you!
Of course; what I figured. Thanks for checking in...
Sgt T and BionicMan mia for some time; JMatthews, also. ?
999,999 buy @.0003 just posted! Good sign; need more of those!💃
A c;ose above .0003 would be a very good sign....
I get it, jg. If, if, if...and so it goes. 🤞
Every bowl has a left side, therefore the left side does not mean 'death'...unless the right does not develop. In 2010 I was in an otc stock that based for three years at .03, then shot to $5.70. (The technical indicatiors are very encouraging....but, are not always the last word.) The rsi, psar and adx offer some 'light' amid the dark shadow that is now igen.
I don't know why I bother to mention it, but "re igen: PSar support in place since Nov 28; and, rsi has remained above 50 since 11/15. RSI hit 25 on 9/11/23; it was the lowest pt rsi has hit in four years (weekly chart.) ADX also hit lowest (6.5) in four years wkly), The chart pattern looks like the left side of a large bowl with the recent basing pattern being the elongated ,0001 to ,0003.
The last trading day of 2023......🎉🎊🎆
Old post: "Eddie T 10/17/23 3:45 PM
Post #77882 on iGen Networks Corp (IGEN)
"Nobody knows. Chan said he is going to dilute to restructure/pay off debt for 3-4 months at the beginning of Sept. He won’t RS until the share count reaches 3.5B imo…mid-Nov or December is my guess"
I've been watching the chart/technicals and see some interesting points long term: the 10, 30, 50 DAs have coiled tightly since abt Nov 22; rsi has done similarly both horizontally and vertically since 10/18, but has also maintained above 50 since Tuesday noon; and PSAR has remained supportive since 11/29!
In the absence of news and the removal from CSE Form7, this is the closest verifiable 'news' available to us at this time....
Image shows rsi, ADX/DMI with +DMI and ADX above -DMI; and ChOsc hugging 'oversold' but forming dbl bottom with early Nov '23,
Good to see still intact: 
PSAR in your Christmas Stocking:
RSI coiled!
Check out the 30min/30day chart; the 10/50/200DAs are curled tight....actually the rsi on daily 6M is as well...
Any day now: January 5 will be four months...
Date: September 5, 2023
"The Company expects to delay its application for the 10:1 reverse split for approximately three to four months." https://www.otcmarkets.com/filing/html?id=16911012&guid=U4g-keeht3MKJth
Will it work this time? Double click on image.

On 9/22/23 (apprx) chaikinosc hit @.0002; and on 10/9/23 (apprx) it hit nearest low, but higher than when price hit ,0001. On 11/17/23 chosc hit highest point since 8/10/20.
I no longer know how to add an image since iHub has modified its layout...Used to add image, but function no longer available... If anyone has the know-how let me know, pls.
$IGEN 5Y daily: Been studying this chart and these two technicals. Now we get 2 tiny buys, 100 and 11 (I think...). I'm only guessing but the ch oscillator may be telling us that a trend change may be occurring now...
First three technicals show bottoms over three years; rsi (?).
$SFLM 3Y daily: Technicals Does rsi have to touch down to signal bottom... (?) pic.twitter.com/Pf17NGrEiE
— Sharpei (@ChartzUp) December 13, 2023
Fair Question. Check the expert response: http://www.elliottwave.net/educational/basictenets/basics3.htm
(sigh!)
Yup! It looks good: Juan's CTO; Neil and R. Nealon bought shares, new w/s using Prolog-speak verbatim...but, we won't know til it's affirmed. Fingers crossed.
I've wondered if one device could serve all needs; in other words..."One device fits all." Does anyone have information in this regard?
Actually the case can be made that the pattern from .0029 to .0005 completes 5 leg ext'd EW, and 10DA pattern shows end similar to start pt. Techs, lend support where price shows recovery from .0005 has taken place (chosc, rsi, macd). Fib .0029/5.62=.000516

