


Thursday, December 28, 2023 10:31:33 AM
In the absence of news and the removal from CSE Form7, this is the closest verifiable 'news' available to us at this time....
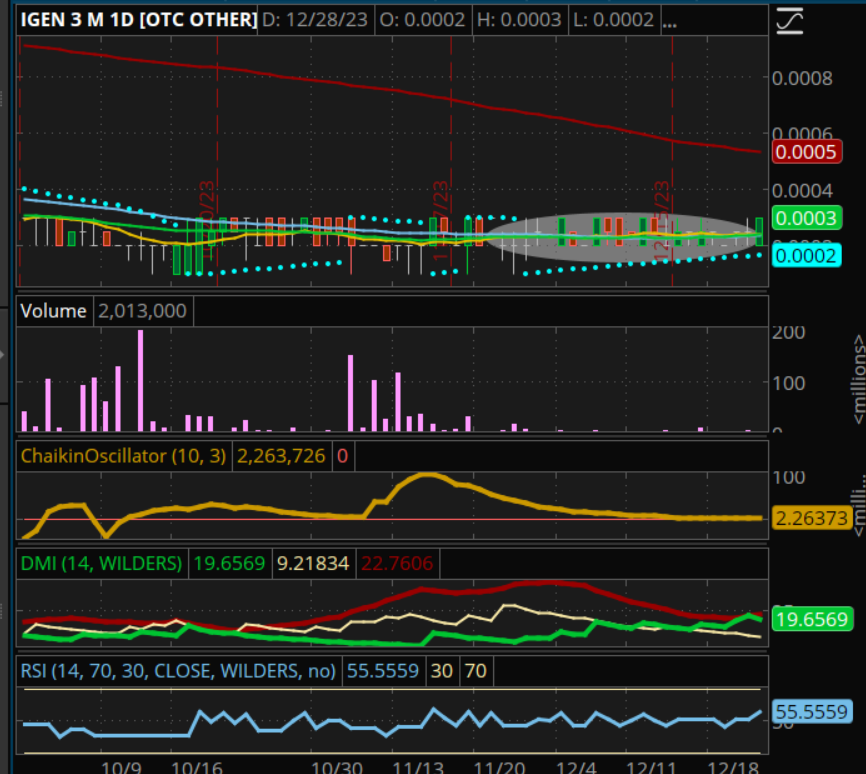
Image shows rsi, ADX/DMI with +DMI and ADX above -DMI; and ChOsc hugging 'oversold' but forming dbl bottom with early Nov '23,
Recent IGEN News
- IGEN Achieves Milestones and provides updates on Key Initiatives • InvestorsHub NewsWire • 02/05/2024 11:00:00 AM
- Form 10-Q - Quarterly report [Sections 13 or 15(d)] • Edgar (US Regulatory) • 11/20/2023 09:07:43 PM
- Form DEF 14C - Other definitive information statements • Edgar (US Regulatory) • 10/11/2023 07:38:20 PM
- Form 8-K - Current report • Edgar (US Regulatory) • 09/05/2023 10:00:59 AM
- Form 10-Q - Quarterly report [Sections 13 or 15(d)] • Edgar (US Regulatory) • 08/22/2023 05:26:50 PM
- Form 8-K - Current report • Edgar (US Regulatory) • 07/17/2023 04:48:47 PM
- IGEN and Prolog announce Industry's First AI Program for the Next Generation of Commercial Fleet Solutions • InvestorsHub NewsWire • 06/20/2023 11:19:57 AM
- IGEN Directors Complete Non-brokered Private Placements • InvestorsHub NewsWire • 05/04/2023 11:11:56 AM
NanoViricides Reports that the Phase I NV-387 Clinical Trial is Completed Successfully and Data Lock is Expected Soon • NNVC • May 2, 2024 10:07 AM
ILUS Files Form 10-K and Provides Shareholder Update • ILUS • May 2, 2024 8:52 AM
Avant Technologies Names New CEO Following Acquisition of Healthcare Technology and Data Integration Firm • AVAI • May 2, 2024 8:00 AM
Bantec Engaged in a Letter of Intent to Acquire a Small New Jersey Based Manufacturing Company • BANT • May 1, 2024 10:00 AM
Cannabix Technologies to Deliver Breath Logix Alcohol Screening Device to Australia • BLO • Apr 30, 2024 8:53 AM
Hydromer, Inc. Reports Preliminary Unaudited Financial Results for First Quarter 2024 • HYDI • Apr 29, 2024 9:10 AM

