 News
News  Market Data
  Discover
Support: 888-992-3836
Copyright © 2023 InvestorsHub Inc.


Black_NITE
![]()
![]()
Register for free to join our community of investors and share your ideas. You will also get access to streaming quotes, interactive charts, trades, portfolio, live options flow and more tools.
Register for free to join our community of investors and share your ideas. You will also get access to streaming quotes, interactive charts, trades, portfolio, live options flow and more tools.
Trend Identification Using Moving Averages
The same signals can be generated using simple or exponential moving averages. As noted above, the preference depends on each individual. These examples below will use both simple and exponential moving averages. The term "moving average" applies to both simple and exponential moving averages.
The direction of the moving average conveys important information about prices. A rising moving average shows that prices are generally increasing. A falling moving average indicates that prices, on average, are falling. A rising long-term moving average reflects a long-term uptrend. A falling long-term moving average reflects a long-term downtrend.

The chart above shows 3M (MMM) with a 150-day exponential moving average. This example shows just how well moving averages work when the trend is strong. The 150-day EMA turned down in November 2007 and again in January 2008. Notice that it took a 15% decline to reverse the direction of this moving average. These lagging indicators identify trend reversals as they occur (at best) or after they occur (at worst). MMM continued lower into March 2009 and then surged 40-50%. Notice that the 150-day EMA did not turn up until after this surge. Once it did, however, MMM continued higher the next 12 months. Moving averages work brilliantly in strong trends.

SEC Filings Explained ~ F-1
Registration statement for certain foreign private issuers.
Form 6-K~ SEC Filings Explained
Form 6K is an SEC filing submitted to the US Securities and Exchange Commission used by certain foreign private issuers to provide information that is:
 Required to be made public in the country of its domicile
 Filed with and made public by a foreign stock exchange on which its securities are traded
 Are distributed to security holders.
The report must be furnished promptly after such material is made public. The form is not considered "filed" because of Section 18 (for liability purposes). This is the only information furnished by foreign private issuers between annual reports, since such issuers are not required to file on Forms 10-Q or 8-K.
Pivot Points
Introduction
Pivots Points are significant levels chartists can use to determine directional movement, support and resistance. Pivot Points use the prior period's high, low and close to formulate future support and resistance. In this regard, Pivot Points are predictive or leading indicators. There are at least five different versions of Pivot Points. This article will focus on Standard Pivot Points, Demark Pivot Points and Fibonacci Pivot Points.
Pivot Points were originally used by floor traders to set key levels. Floor traders are the original day traders. They deal in a very fast moving environment with a short-term focus. At the beginning of the trading day, floor traders would look at the previous day's high, low and close to calculate a Pivot Point for the current trading day. With this Pivot Point as the base, further calculations were used to set support 1, support 2, resistance 1 and resistance 2. These levels would then be used to assist their trading throughout the day.
SEC Filings Explained ~ Form 4
Form 4 is a United States SEC filing that relates to insider trading. Every director, officer or owner of more than ten percent of a class of equity securities registered under Section 12 of the Securities Exchange Act of 1934 must file with the United States Securities and Exchange Commission a statement of ownership regarding such security. The initial filing is on Form 3 and changes are reported on Form 4. The Annual Statement of beneficial ownership of securities is on Form 5. The forms contain information on the reporting person's relationship to the company and on purchases and sales of such equity securities.
Form 4 is stored in SEC's EDGAR database. EDGAR is Electronic Data Gathering, Analysis and Retrieval System. It is a registered trademark of the SEC.
A Form 4 must be filed before the end of the second business day following a change in ownership of securities or derivative securities (including the exercise or grant of stock options) for individuals subject to Section 16 of the Securities Exchange Act of 1934.
Fibonacci Pivot Points
Fibonacci Pivot Points start just the same as Standard Pivot Points. From the base Pivot Point, Fibonacci multiples of the high-low differential are added to form resistance levels and subtracted to form support levels.
Pivot Point (P) = (High Low Close)/3
Support 1 (S1) = P - {.382 * (High - Low)}
Support 2 (S2) = P - {.618 * (High - Low)}
Support 3 (S3) = P - {1 * (High - Low)}
Resistance 1 (R1) = P {.382 * (High - Low)}
Resistance 2 (R2) = P {.618 * (High - Low)}
Resistance 3 (R3) = P {1 * (High - Low)}
The chart below shows the Dow Industrials SPDR (DIA) with Fibonacci Pivot Points on a 15 minute chart. R1 and S1 are based on 38.2%. R2 and S2 are based on 61.8%. R3 and S3 are based on 100%.

Moving Average Lengths and Timeframes
The length of the moving average depends on the analytical objectives. Short moving averages (5-20 periods) are best suited for short-term trends and trading. Chartists interested in medium-term trends would opt for longer moving averages that might extend 20-60 periods. Long-term investors will prefer moving averages with 100 or more periods.
Some moving average lengths are more popular than others. The 200-day moving average is perhaps the most popular. Because of its length, this is clearly a long-term moving average. Next, the 50-day moving average is quite popular for the medium-term trend. Many chartists use the 50-day and 200-day moving averages together. Short-term, a 10-day moving average was quite popular in the past because it was easy to calculate. One simply added the numbers and moved the decimal point.
SPDRs
Usually referred to as spiders, these investment instruments bundle the benchmark S
Form 10-D, 10-D/A ~ SEC Filings Explained
Periodic distribution reports by Asset-Backed issuers pursuant to Rule 13a-17 or 15d-17 (and amendment thereto)
Form S-8 ~ SEC Filings Explained
Initial registration statement for securities to be offered to employees pursuant to employee benefit plans
Form N-1A ~ SEC Filings Explained
Initial registration statement for open-end management investment companies
BULLISH ENGULFING
Bullish Engulfing Pattern is a pattern characterized by a large white real body engulfing a preceding small black real body, which appears during a downtrend. The white body does not necessarily engulf the shadows of the black body but totally engulfs the body itself. The Bullish Engulfing Pattern is an important bottom reversal signal.
Recognition Criteria:
1. Market is characterized by downtrend.
2. Then we see a small black body.
3. Next day we see a white body that completely engulfs the black real body of the preceding day.
Explanation:
While the market sentiment is bearish; we see some subsided selling reflected by the short, black real body of the first day. Next day shows bull strength with a closing price at or above the previous day’s open. It means that the downtrend is now losing momentum and the bulls started to take the lead.
Important Factors:
The relative size of the bodies in the first and second days is important. If the first day of the Bullish Engulfing Pattern is characterized by a very small real body (it may even be a doji or nearly a doji) but the second day is characterized by a very long real body, this strongly indicates that the bearish power is diminishing and the disparity of white versus black body is indicative of the emerging bull power.
There is higher probability of a bullish reversal if there is heavy volume on the second real body or if the second day of the Bullish Engulfing Pattern engulfs more than one real body (which essentially means we see two or more small black bodies preceding the long white body).
The reversal of downtrend needs further confirmation on the third day. This confirmation may be in the form of a white candlestick, a large gap up or a higher close on the third day.
Form F-7 ~ SEC Filings Explained
Registration statement for securities of certain Canadian issuers offered for cash upon the exercise of rights granted to existing security holders
BEARISH BREAKAWAY
We see this pattern during an uptrend marked with a bullish surge that eventually weakens. This weakening is illustrated by a long black candlestick that is unable to close the gap into the body of the first day. These events warn us about a short-term reversal.
Recognition Criteria:
1. Market is characterized by uptrend.
2. We see a long white candlestick in the first day.
3. Then we see a white candlestick with a gap above the first day on the second day.
4. However the third and fourth days continue in the direction of the second day with higher consecutive closes.
5. Finally we see a long black candlestick on the fifth day with a closing price inside the gap caused by the first and second days.
Explanation:
The Bearish Breakaway Pattern is constituted by a gap in the direction of the uptrend followed by three consecutively higher price days. This shows that the trend has suddenly accelerated with a big gap but then it started to fizzle, however it still manages to move in the same direction. There is evidently a slow deterioration of the trend even though the uptrend continues. Finally, we see a burst in the opposite direction completely recovering the previous three days' price action. A possible reversal is also implied by the fact the gap has not been filled. We are now ready for a short-term reversal.
Important Factors:
A confirmation on the sixth day is recommended in the form of a black candlestick, a large gap down or a lower close to be sure that there is indeed a reversal.
Direxion Daily Financial Bear 3X Shares (NYSE:FAZ)
Not all ETFs are designed to move in the same direction or even in the same amount as the index they are tracking. For example, this triple bear fund attempts to perform 300% in the opposite direction of the Russell 1000 Financial Services Index. This fund became popular in 2008 and 2009 when the financial crisis placed downward pressure on financial stocks.
Form N-PX ~ SEC Filings Explained
Annual Report of Proxy Voting Record of Registered Management Investment Companies
Vipers
Just like iShares are Barclay's brand of ETFs, VIPERs are Vanguard's brand of the financial instrument. Vipers, or Vanguard Index Participation Receipts, are structured as share classes of open-end funds. Vanguard also offers dozens upon dozens of ETFs for many different areas of the market including the financial, healthcare and utilities sectors.
ETFs compared to mutual funds
Cost Factors on ETF’s
Because ETFs trade on an exchange, each transaction is generally subject to a brokerage commission. Commissions depend on the brokerage and which plan is chosen by the customer. For example, a typical flat fee schedule from an online brokerage firm in the United States ranges from $10 to $20, but it can be as low as $0 with discount brokers. Due to this commission cost, the amount invested has a great bearing; someone who wishes to invest $100 per month may have a significant percentage of their investment destroyed immediately, while for someone making a $200,000 investment, the commission cost may be negligible. Generally, mutual funds obtained directly from the fund company itself do not charge a brokerage fee. Thus when low or no-cost transactions are available, ETFs become very competitive.
ETFs have a lower expense ratio than comparable mutual funds. Not only does an ETF have lower shareholder-related expenses, but because it does not have to invest cash contributions or fund cash redemptions, an ETF does not have to maintain a cash reserve for redemptions and saves on brokerage expenses. Mutual funds can charge 1% to 3%, or more; index fund expense ratios are generally lower, while ETFs are almost always in the 0.1% to 1% range. Over the long term, these cost differences can compound into a noticeable difference.
The cost difference is more evident when compared with mutual funds that charge a front-end or back-end load as ETFs do not have loads at all. The redemption fee and short-term trading fees are examples of other fees associated with mutual funds that do not exist with ETFs. Traders should be cautious if they plan to trade inverse and leveraged ETFs for short periods of time. Close attention should be paid to transaction costs and daily performance rates as the potential combined compound loss can sometimes go unrecognized and offset potential gains over a longer period of time
THREE OUTSIDE DOWN
The Bearish Three Outside Down Pattern is another name for the Confirmed Bearish Engulfing Pattern. The third day confirms the bearish trend reversal.
Recognition Criteria:
1. Market is characterized by uptrend.
2. We see a Bearish Engulfing Pattern in the first two days.
3. Then we see a black candlestick on the third day with a lower close than the second day.
Explanation:
The first two days forms a Bearish Engulfing Pattern, and the third day confirms the reversal suggested by the Bearish Engulfing Pattern since it is a black candlestick closing with a new low for the three days.
Form 6-K~ SEC Filings Explained
Form 6K is an SEC filing submitted to the US Securities and Exchange Commission used by certain foreign private issuers to provide information that is:
 Required to be made public in the country of its domicile
 Filed with and made public by a foreign stock exchange on which its securities are traded
 Are distributed to security holders.
The report must be furnished promptly after such material is made public. The form is not considered "filed" because of Section 18 (for liability purposes). This is the only information furnished by foreign private issuers between annual reports, since such issuers are not required to file on Forms 10-Q or 8-K.
SEC Filings Explained ~ Rule 144
On December 6, 2007, the SEC published final rules revising Rule 144 under the Securities Act of 1933, which regulates the resale of restricted securities and securities held by affiliates. The amendments to Rule 144, among other things:
1. Shorten the holding period for affiliate and non-affiliate holders of restricted securities of SEC-reporting companies to six months, subject to certain conditions
2. Permit unlimited resale by non-affiliate holders of restricted securities by complying only with the current public information condition for resale of restricted securities issued by SEC reporting companies made after the six-month holding period; and without complying with any Rule 144 conditions for resale of restricted securities issued by both SEC reporting and non-reporting companies made after a one-year holding period.
3. permit resale of equity securities by affiliates that meet certain conditions through riskless principal transactions and brokers’ transactions in which the broker has published bid and asked quotations for the security in an alternative trading system.
4. Eliminate the manner of sale conditions and ease the volume limitations for resale of debt securities by affiliates.
5. Increase the thresholds that trigger the Form 144 filing requirement to 5,000 shares or $50,000.
The SEC did not adopt previously proposed provisions relating to the tolling of holding periods in connection with hedging transactions.
The amendments will become effective on February 15, 2008, and will apply to securities acquired before or after that date. Background
Rule 144 regulates the resale of “restricted securitiesâ€1 and “control securities,â€2 by establishing certain conditions that must be satisfied in order for the resale to be exempt from the Securities Act registration requirements pursuant to Section 4(1) of the Securities Act—a safe harbor from “underwriter†status for the selling security holder.
The conditions include the following:
 There must be adequate current public information available about the issuer;
 If the securities being sold are restricted securities, the security holder must have held the security for a specified holding period;
 The resale must be within specified sales volume limitations;
 The resale must comply with the manner of sale requirements of the rule; and
 The selling security holder must file Form 144 with the SEC if the amount of securities being sold exceeds specified thresholds.
Amendments to Conditions for Resale of Restricted Securities
Restricted Securities of SEC-Reporting Companies. The SEC has reduced the holding period under Rule 144 for restricted securities of SEC-reporting companies held by both affiliates and non-affiliates from one year to six months. Affiliate holders of reporting company securities may now resell their restricted securities after six months, subject to the other Rule 144 requirements. Non-affiliate holders of reporting company securities (who have also not been affiliates during the prior three months) may now resell their restricted securities held between six months and one year subject only to Rule 144’s current public information requirement. Any such resale by a non-affiliate after one year will be exempt from all Rule 144 requirements.
Restricted Securities of Non-Reporting Companies. There is still a one-year holding period for affiliate and non-affiliate holders of restricted securities in non-reporting companies under amended Rule 144. After the one-year holding period, non-affiliates may now resell their restricted securities without having to comply with any other Rule 144 requirements; affiliates seeking to resell their restricted securities must still meet all Rule 144 requirements.
The manner of sale requirements of Rule 144 require securities to be sold in “brokers’ transactions†or in transactions directly with a “market maker.â€
The rule includes restrictions on (1) soliciting or arranging for the solicitation of orders to buy the securities in anticipation of, or in connection with, the Rule 144 transaction or (2) making any payment in connection with the offer or sale of the securities to any person other than the broker who executes the order to sell the securities.
The SEC amended these rules to also permit the resale of restricted equity securities by affiliates through riskless principal transactions in which trades are executed at the same price, exclusive of any explicitly disclosed markup or markdown, commission equivalent or other fee, and the rules for a self-regulatory organization permit the transaction to be reported as riskless.3 The amended rule also expands the definition of a “brokers’ transaction†for purposes of such resale by permitting a broker to insert bid and ask quotations for the security in an alternative trading system, provided that the broker has published bona fide bid and ask quotations for such security on each of the last 12 business days. Resale of Restricted Debt Securities The SEC has eliminated the manner-of-sale requirements for affiliate resale of debt securities, including non-participatory preferred stock (which has debt-like characteristics) and asset-backed securities. The SEC also raised the volume limitations for the resale of debt securities to permit resale in an amount that does not exceed ten percent of a tranche (or a class with respect to non-participatory preferred stock), together with all sales of securities of the same tranche sold for the selling debt security holder within a three-month period. Form 144 Filing Triggers
The sales thresholds for filing Form 144 have been increased from 500 shares or $10,000 worth of securities to 5,000 shares or $50,000. Codified
SEC Staff Interpretations
The SEC has also codified various staff interpretations relating to Rule 144, including the following:
1. Stating that securities acquired by accredited investors pursuant to Section 4(6) of the Securities Act are considered restricted securities
2. Permitting tacking of holding periods when a company reorganizes into a holding company structure
3. Permitting tacking of holding periods for conversions and exchanges of securities
4. Deeming the acquisition dates for securities acquired pursuant to the cashless exercise of options and warrants as the dates the options or warrants were acquired
5. Permitting a pledgee of restricted securities to sell the pledged securities without having to aggregate the sale with sales by other pledgees from the same pledgor (as long as there is no concerted action by those pledgees), for purposes of the Rule 144 volume limitation condition
6. Permitting the Form 144 representations required from security holders relying on Exchange Act Rule 10b5-1 to be made as of the date the holder adopted a trading plan or gave trading instructions
7. Confirming the unavailability of Rule 144 for the resale of securities by reporting and non-reporting firms
Form N-30D ~ SEC Filings Explained
Initial annual and semi-annual reports mailed to investment company shareholders
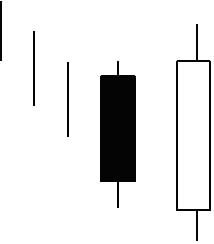
Falling Three Methods
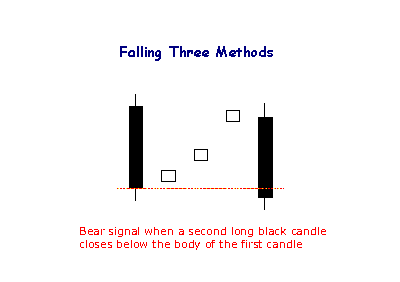
The bearish Falling Method consists of two long black lines bracketing 3 or 4 small ascending white candlesticks, the second black line forming a new closing low.
Form 10-12G, 10-12G/A ~ SEC Filings Explained
Initial general form for registration of a class of securities pursuant to section 12(g) (and amendment thereto)
Form 10-D, 10-D/A ~ SEC Filings Explained
Periodic distribution reports by Asset-Backed issuers pursuant to Rule 13a-17 or 15d-17 (and amendment thereto)
Form 18-K, 18-K/A ~ SEC Filings Explained
Annual report for foreign governments (and amendment thereto)
Form 20-F, 20-F/A ~ SEC Filings Explained
Annual and transition report of foreign private issuerspursuant to sections 13 or 15(d) (and amendment thereto)
Taxation on ETF’s
ETFs are structured for tax efficiency and can be more attractive than mutual funds. In the U.S., whenever a mutual fund realizes a capital gain that is not balanced by a realized loss, the mutual fund must distribute the capital gains to its shareholders. This can happen whenever the mutual fund sells portfolio securities, whether to reallocate its investments or to fund shareholder redemptions. These gains are taxable to all shareholders, even those who reinvest the gains distributions in more shares of the fund. In contrast, ETFs are not redeemed by holders (instead, holders simply sell their ETF shares on the stock market, as they would a stock, or effect a non-taxable redemption of a creation unit for portfolio securities), so that investors generally only realize capital gains when they sell their own shares or when the ETF trades to reflect changes in the underlying index.[5]
In most cases, ETFs are more tax-efficient than conventional mutual funds in the same asset classes or categories.[42] Because Vanguard's ETFs are a share-class of their mutual funds, they don't get all the tax advantages if there are net redemptions on the mutual fund shares.[43] Although they do not get all the tax advantages, they get an additional advantage from tax loss harvesting any capital losses from net redemptions.[44][45]
In the U.K., ETFs can be shielded from capital gains tax by placing them in an Individual Savings Account or self-invested personal pension, in the same manner as many other shares. Because UK-resident ETFs would be liable for UK corporation tax on non-UK dividends, most ETFs which hold non-UK companies sold to UK investors are issued in Ireland or Luxembourg
Rising Three Methods
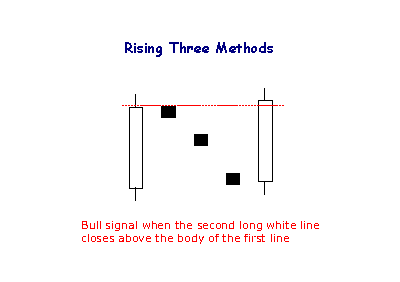
The Rising Method consists of two strong white lines bracketing 3 or 4 small declining black candlesticks. The final white line forms a new closing high. The pattern is definitely bullish.
Form 13F-HR, 13F-HR/A ~ SEC Filings Explained
Initial Quarterly Form 13F Holdings report filed by institutional managers (and amendment thereto)
M-Tops Using Bollinger Bands
M-Tops were also part of Arthur Merrill's work that identified 16 patterns with a basic M shape. Bollinger uses these various M patterns with Bollinger Bands to identify M Bottoms. According to Bollinger, tops are usually more complicated and drawn out than bottoms. Double tops, head-and-shoulders patterns and diamonds represent evolving tops.
In its most basic form, an M-Top is similar to a double top. However, the reaction highs are not always equal. The first high can be higher or lower than the second high. Bollinger suggests looking for signs of non-confirmation when a security is making new highs. This is basically the opposite of the W-Bottom. A non-confirmation occurs with three steps. First, a security forges a reaction high above the upper band. Second, there is a pullback towards the middle band. Third, prices move above the prior high, but fail to reach the upper band. This is a warning sign. The inability of the second reaction high to reach the upper band shows waning momentum, which can foreshadow a trend reversal. Final confirmation comes with a support break or bearish indicator signal.

The chart shows Exxon Mobil (XOM) with an M-Top in April-May 2008. The stock moved above the upper band in April. There was a pullback in May and then another push above 90. Even though the stock moved above the upper band on an intraday basis, it did not CLOSE above the upper band. The M-Top was confirmed with a support break two weeks later. Also notice that MACD formed a bearish divergence and moved below its signal line for confirmation.
Form N-8A ~ SEC Filings Explained
Initial notification of registration under section 8(a) filed on Form N-8A
Form N-8B-2 ~ SEC Filings Explained
Initial registration statement for unit investment trusts
Form N-54A
Tweezer Tops

The Tweezer Top formation is a bearish reversal pattern seen at the top of uptrends.
Tweezer Top formation consists of two candlesticks:
Bullish Candle (Day 1)
Bearish Candle (Day 2)
Sometimes Tweezer Tops have three candlesticks.
A bearish Tweezer Top occurs during an uptrend when bulls take prices higher, often closing the day off near the highs (a bullish sign). However, on the second day, how traders feel (i.e. their sentiment) reverses completely. The market opens and goes straight down, often eliminating the entire gains of Day One.

On Day 1, the bulls were in charge of the Russell 2000 E-mini. On Day 2, however, the bulls began the day trying to make a new high, but were rejected by the overhead resistance created by the prior day's highs. The market then sank quickly only to recover halfway by the end of the close on Day 2. Day 3 opened with a spectacular gap up, but the bulls were promptly rejected by the bears at the now established resistance line. The Russell 2000 E-mini then fell for the rest of the day. Many classic chartists will recognize this triple Tweezer Top as a Double Top formation (see: Double Top).
The Tweezer Top and Bottom reversal pattern is extremely helpful because it visually indicates a transfer of power and sentiment from the bulls and the bears. Of course other technical indicators should be consulted before making a buy or sell signal based on the Tweezer patterns.
Stock ETFs
The first and most popular ETFs track stocks. Many funds track national indexes; for example, Vanguard Total Stock Market ETF NYSE: VTI tracks the MSCI US Broad Market Index, and several funds track the S
Form 6-K~ SEC Filings Explained
Form 6K is an SEC filing submitted to the US Securities and Exchange Commission used by certain foreign private issuers to provide information that is:
 Required to be made public in the country of its domicile
 Filed with and made public by a foreign stock exchange on which its securities are traded
 Are distributed to security holders.
The report must be furnished promptly after such material is made public. The form is not considered "filed" because of Section 18 (for liability purposes). This is the only information furnished by foreign private issuers between annual reports, since such issuers are not required to file on Forms 10-Q or 8-K.
W-Bottoms Using Bollinger Bands
W-Bottoms were part of Arthur Merrill's work that identified 16 patterns with a basic W shape. Bollinger uses these various W patterns with Bollinger Bands to identify W-Bottoms. A "W-Bottom" forms in a downtrend and involves two reaction lows. In particular, Bollinger looks for W-Bottoms where the second low is lower than the first, but holds above the lower band. There are four steps to confirm a W-Bottom with Bollinger Bands. First, a reaction low forms. This low is usually, but not always, below the lower band. Second, there is a bounce towards the middle band. Third, there is a new price low in the security. This low holds above the lower band. The ability to hold above the lower band on the test shows less weakness on the last decline. Fourth, the pattern is confirmed with a strong move off the second low and a resistance break.

Nordstrom (JWN) with a W-Bottom in January-February 2010. First, the stock formed a reaction low in January (black arrow) and broke below the lower band. Second, there was a bounce back above the middle band. Third, the stock moved below its January low and held above the lower band. Even though the 5-Feb spike low broke the lower band, Bollinger Bands are calculated using closing prices so signals should also be based on closing prices. Fourth, the stock surged with expanding volume in late February and broke above the early February high.
Form N-CSRS ~ SEC Filings Explained
Certified semi-annual shareholder report of registered management investment companies
WHITE SPINNING TOP
The White Spinning Top is a single candlestick pattern. Its shape is a small white body with upper and lower shadows that have a greater length than the body's length.
Recognition Criteria:
1. The real body of the pattern is white and small.
2. The upper and lower shadows are longer than the real body's length.
Explanation:
The market moves higher and then sharply lower, or vice versa. It then closes above the opening price creating a white body. This represents complete indecision between the bulls and the bears. The actual length of the shadows is not important. The small body relative to the shadows is what makes the spinning top.
Important Factors:
If a White Spinning Top is observed after a long rally or a long white candlestick, this implies weakness among the bulls and it is a warning about a potential change or interruption in trend.
If a White Spinning Top is observed after a long decline or a long black candlestick, this implies weakness among the bears and it is a warning about a potential change or interruption in trend.
Like most other single candlestick patterns, the White Spinning Top has low reliability. It reflects only one day's trading and can be interpreted both as a continuation and a reversal pattern. This candlestick needs to be used with other candlesticks for a healthier confirmation of a trend.

