 News
News  Market Data
  Discover
Support: 888-992-3836
Copyright © 2023 InvestorsHub Inc.


In the markets, what goes down must go up
sharpshorts
![]()
In the markets, what goes down must go up
Register for free to join our community of investors and share your ideas. You will also get access to streaming quotes, interactive charts, trades, portfolio, live options flow and more tools.
Register for free to join our community of investors and share your ideas. You will also get access to streaming quotes, interactive charts, trades, portfolio, live options flow and more tools.
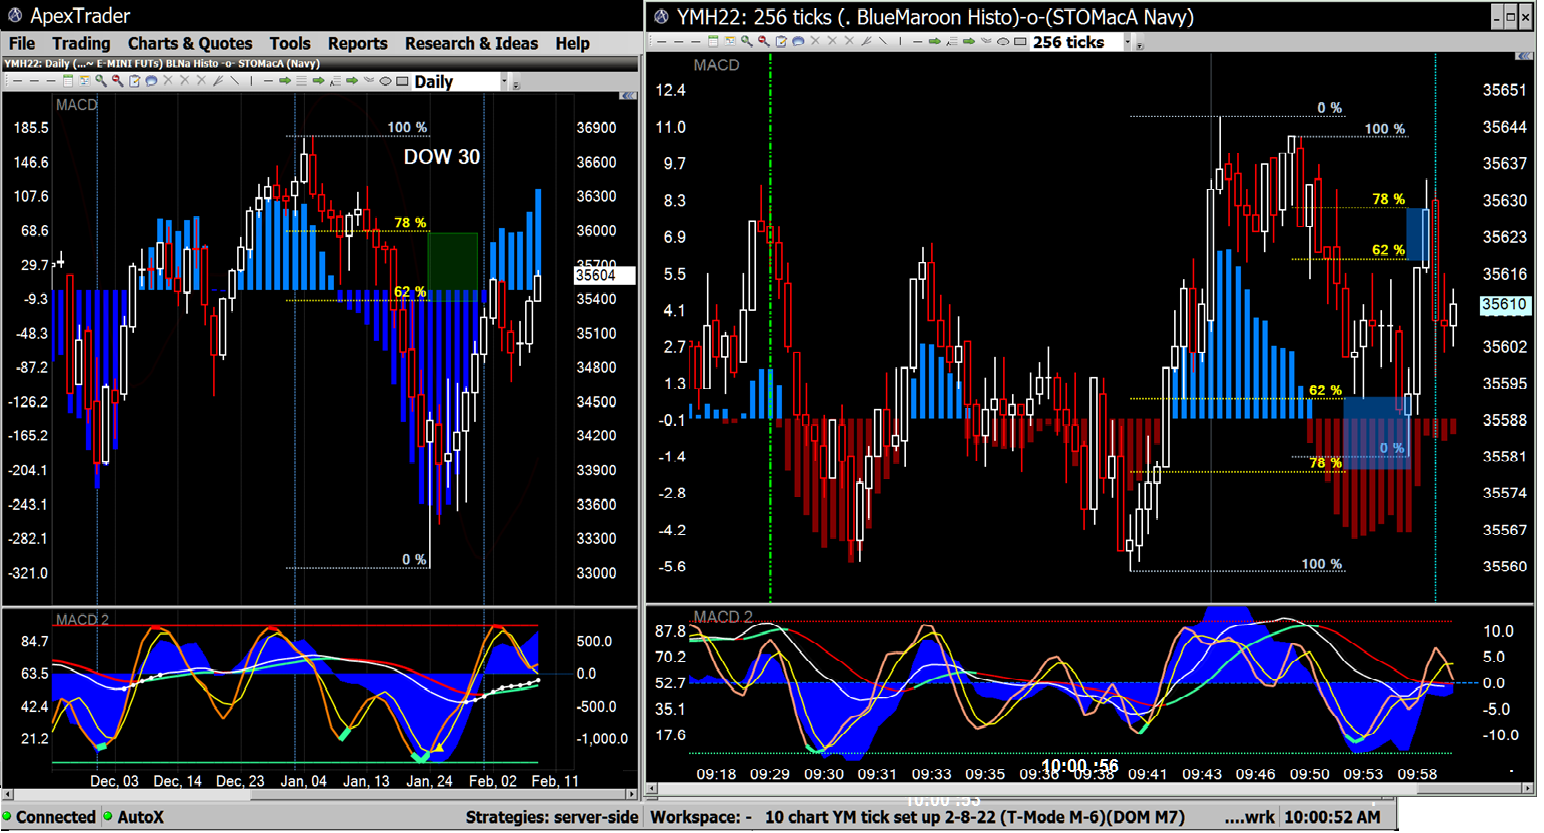
In the markets, what goes down must go up
All signals needn't be present for gains ...
In an' out in a minute...you often "get lucky" using just a couple

WAR ! COVID !
Good rationals for contrary investors to dabble in to the long side because
IT"S BOTTOMING.
Perma-bull technicals include a completing A-B-C-D Measured Move.

T-Mode Charts are used for signal spotting ... and for placing orders.

ShowCase Indicators and the formulas that fire them:
A - Stochastic Hook... Input<20 & input[3]>input & input>input[1]
B - MacEMA Turn...input>input[1] & input<input[4]&input<0
C - MacHisto Cross...Input>0 & input[1]<0 & input>input[2]
Signals before the blue line --- for $110

Signal Confluence increases the odds of successful trades

More examples of what the market offers...every day:


Back-to-back scalps happen throughout every session

5 snapshots of 3 Charts - different sizes...
The 1st was the original I copied with Gadwin Printscreen.

These were the 1st pasted into MS Paint and then their sizes were manipulated ...I changes the widths and heights but very little differences show between them after uploading to iHub.


Another quick $100 plus scalp

More about ShowCase and Coloring custom indicators


ShowCase and Coloring custom indicators

Signals B4 the blue line... $250+ became available 
Another SlingShot example for +$150...in an uptrend
(in and out in less than 3 minutes)

More Blue line entry signals...on short time frames

Blue line entry signals...I marked the entries
#1 - 3XD divergence (stochastc, MACD Histogram and MACD EMA)
#2 - SlingShot (rising MACD EMAs and Stochastic hooking up)

Price-to-Indicator divergence signaling a $275 run ...
Shown on 2 time frames in the stochastic, the MACD histograms
and the MACD EMA indicators.

BZ retraces... up-or-down - on any time frame
Wash, rinse repeat?

Cross X set up : Bracket orders
10 point TARGET with 5 point STOP
The white triangles in the study panes are ShowCase indicators that print when
the Main MACD EMA (white line) crosses up through the Signal MACD EMA (red & lime line).
Enter a bracket order at the high of the current price bar when the ShowCase prints.
Depending on the price action that follows that action, it will be either a BUY-LIMIT or a BUY-STOP.

...Retail-- Buy the Dips ...Professional-- collect the Stop$
Is it safe? ...still questioning a week later 
Price to indicator divergence

MACD - TREND ... STO - WHEN

Too quick to trade...BIG moves in seconds

Cross X scalp ... very short term

On the left hand "Entry" chart, compare the last two stochastic lows to the price lows - divergence printed.
a.k.a the 1-2 Punch pattern...
Cross X

The trend-is-your friend, MACD shows the trend ...
It seems so easy ...

MACD EMAs crossing...read the entire chart for clues
If you're quick place a BUY STOP...but a limit order works if you're just a little slow to react
Limit your downside but let your profits run...

MACD EMAs crossing - - the rules :
a price momentum strategy

Is it safe? (Marathon Man the movie)

It's never certain, ya just gotta play the odds.
If ya can't trust the odds, don't play.
MACD EMAs crossing... another day of good ranges

MACD EMAs crossing V

...Strawberry Fields Forever...nothing is real...Blow-out bottom volume

MACD EMA crossing IV

MACD EMAs crossing III

MACD EMAs crossing II

MACD EMAs crossing

As goes January, so goes the year (old-saying)

The minor break turned out to be not-so-minor

Stochastic TURN for a scalp


