 News
News  Market Data
  Discover
Support: 888-992-3836
Copyright © 2023 InvestorsHub Inc.


ls7550
![]()
Register for free to join our community of investors and share your ideas. You will also get access to streaming quotes, interactive charts, trades, portfolio, live options flow and more tools.
Register for free to join our community of investors and share your ideas. You will also get access to streaming quotes, interactive charts, trades, portfolio, live options flow and more tools.
Hi Vitali
If you have 2% inflation over a year, then the monthly compound rate can be calculated by taking the 1/12th root of that. You have to convert 2% (0.02) to add 1 to that (1.02) and then take the 1/12th root (on a calculator or its typically shown as x^y), and then you have the monthly factor i.e. 1.0016515813 ... by which to multiple Portfolio Control each month, that will over 12 months have uplifted (compounded) it by 2%.
So if PC starts at 10000 in January, and otherwise remains unchanged (no AIM trades) the next month, then 10000 x 1.0016515813 = 10016.515813 = PC value for February, and then times that again by 1.0016515813 = 10033.0589032 PC value for March ...etc. By the end of December and PC will (assuming otherwise unchanged) be 2% higher than at the start of the year.
Of course if inflation changes, isn't 2% but the recent prevailing rate has risen to say 4% then 1/12 = 0.08333 so calculate 1.04^0.08333 = 1.00327373978 - which is the monthly Portfolio Control multiplication factor that would uplift it in reflection of a 4% inflation rate.
You might find this spreadsheet mind blowing and of no use, however I've linked it just in case it does contain some hints/clues as to how you might do things in Excel/Libre Office Calc. One of the worksheets is Steve's AIM Bare that contains the AIM monthly reviews, there are also images posted into the spreadsheet and it fully accounts and compares a AIM of small cap value with 10 year treasury as AIM's 'cash' and 80% cash settings to buy and hold (monthly and yearly rebalanced 20/80 small cap value/10 year treasury).
https://drive.google.com/file/d/1eNLdLwtCZSr9YxZfUAlwS8Knz_HeyfR-/view?usp=sharing
Have a look, if you find it of no use, just confusing, then ignore it (you might still find reading the 'Notes' worksheet/tab to be of some interest). It's pretty much standard AIM with the exception that Portfolio Control is being updated by the prevailing rate of inflation each period (month).
Clive.
PS. In reflection of Lichello introducing AIM-HI (80/20 stock/cash) I called that 20/80 AIM-LO. Fundamentally it can yield the same total return as 100% Total Stock Market (TSM) over the mid to longer term, but subjectively i.e. only at certain times and where the interval between such times could be a decade or more. But if you're in for the longer term, potentially having 100% TSM comparable accumulation rewards at some future date whilst having only had 20% average stock exposure, 80% 'bonds' can have appeal to more risk adverse investors. No guarantees though, its conjecture on my behalf.
PPS ... good grief, 7+ years ago now (maybe longer) since I mentioned AIM-LO https://investorshub.advfn.com/boards/read_msg.aspx?message_id=88112382 Time flies - but that's a consequence of when you're 1 a year is a lifetime, but when you're 50 a year is just 2% of a lifetime, and I'm rapidly accelerating towards being a decade on the wrong side of 50 :(
Hi Vitali
Do you find yourself trading less often now compared to what a normal AIM program would suggest? Do you use any kind of rules for percentages or amounts traded?

Rebalancing those back towards equal weightings once/year also 'trades' in a AIM like manner, without all of the 'technicalities' (or tendency to become too engrossed in the mechanics/tweaking of AIM).Year CPI Gold 10yrT SCV
1972 3.41% 49.02% 2.35% 11.15%
1973 8.71% 72.96% 3.29% -24.12%
1974 12.34% 66.15% 4.05% -21.09%
1975 6.94% -24.80% 5.52% 53.94%
1976 4.86% -4.10% 15.29% 54.78%
1977 6.70% 22.64% 0.53% 15.88%
1978 9.02% 37.01% -0.74% 19.25%
1979 13.29% 126.55% 1.83% 37.80%
1980 12.52% 15.19% -1.29% 25.77%
1981 8.92% -32.60% 5.28% 15.69%
1982 3.83% 14.94% 39.57% 36.87%
1983 3.79% -16.31% 2.30% 42.61%
1984 3.95% -19.38% 14.87% 5.69%
1985 3.80% 6.00% 29.85% 37.46%
1986 1.10% 18.96% 21.35% 13.99%
1987 4.43% 24.53% -2.64% -3.51%
1988 4.42% -15.26% 6.90% 29.00%
1989 4.65% -2.84% 17.84% 19.21%
1990 6.11% -3.11% 7.70% -19.05%
1991 3.06% -8.56% 18.91% 42.96%
1992 2.90% -5.73% 7.23% 28.23%
1993 2.75% 17.68% 12.97% 21.10%
1994 2.67% -2.17% -7.19% -0.07%
1995 2.54% 0.98% 25.55% 30.32%
1996 3.32% -4.59% -0.00% 21.41%
1997 1.70% -21.41% 11.97% 35.44%
1998 1.61% -0.83% 14.64% -2.68%
1999 2.68% 0.85% -7.83% 3.35%
2000 3.39% -5.44% 17.28% 21.88%
2001 1.55% 0.75% 5.40% 13.70%
2002 2.38% 25.57% 15.45% -14.20%
2003 1.88% 19.89% 0.15% 37.19%
2004 3.26% 4.65% 4.50% 23.55%
2005 3.42% 17.76% 3.01% 6.07%
2006 2.54% 22.55% 2.19% 19.24%
2007 4.08% 30.45% 10.42% -7.07%
2008 0.09% 4.92% 20.53% -32.05%
2009 2.72% 24.03% -10.17% 30.34%
2010 1.50% 29.27% 7.92% 24.82%
2011 2.96% 9.57% 16.24% -4.16%
2012 1.74% 6.60% 2.73% 18.56%
2013 1.50% -28.33% -8.57% 36.41%
2014 0.76% -2.19% 10.63% 10.39%
2015 0.73% -10.67% 1.12% -4.77%
2016 2.07% 8.03% 1.00% 24.65%
2017 2.11% 12.81% 2.39% 11.67%
2018 1.91% -1.94% 0.99% -12.34%
2019 2.29% 17.86% 8.03% 22.61%
Stocks in some respects are a form of 'leveraged' holding. Many firms borrow as part of their business.
Hi Vitaali
Butting in.
In the UK dividends tend to be higher than in the US. US history has dividends being more harshly taxed in the past, which prompted firms to retain more of earnings/distribute smaller dividends.
Whilst Lichello advised not to change Portfolio Control (PC) for dividends on the basis that all things being equal the share price drops by the amount of dividend paid, in the UK if you actually uplift PC by the dividend value that provides a means by which it can be increased over time so that AIM is less inclined to build up too much cash reserves.
Another option is to AIM real (after inflation) prices/values, in which case PC needs no additional revision outside of its normal maintenance. Or alternatively you might revise PC upwards by inflation, perhaps doing so at each of your review dates. If for instance you are performing monthly checks and inflation is running at 2%/year then for monthly ... 1.02^(1/12) = increase (multiply) PC by 1.0016515813 each month. For youth/accumulation and where dividends are being reinvested you might prefer to double up that amount in reflection of stock total returns tending to be 2 x inflation i.e. a price that rises with inflation along with a dividend that compares to cash interest (which also broadly matches inflation).
Generally you never want to reduce PC as its reflective of your cost-base. Reducing it would reflect being prepared to sell shares for potentially less than what you paid for the shares. Exceptions would be if that if a holding had dived so deeply that it was unlikely to recover to former levels and you wanted to get it back working again (cut your losses and reset AIM so it was more inclined to trade again).
Clive
I've found the rebalancing of the Stock/Gold/Treasuries portfolios creates a trifecta for Cash Equals. This is very interesting in and of itself.
For those in retirement, sequence of returns can make a massive difference. Look at total returns from all stock, or 50/50 stock/bonds and the annualised total rewards can look decent, perhaps 10% annualised versus 3% inflation such that the illusion is that such portfolio's could have comfortably accommodated a 4% Safe Withdrawal Rate (SWR) [Safe withdrawal rate is where you start with a percentage amount of the portfolio value as the capital amount drawn in the first year, and in subsequent years you uplift that capital amount by inflation as the amounts drawn in subsequent years].
Using Portfoliovisualizer.com (US data/inflation ..etc.), plugging in a 4% SWR ...
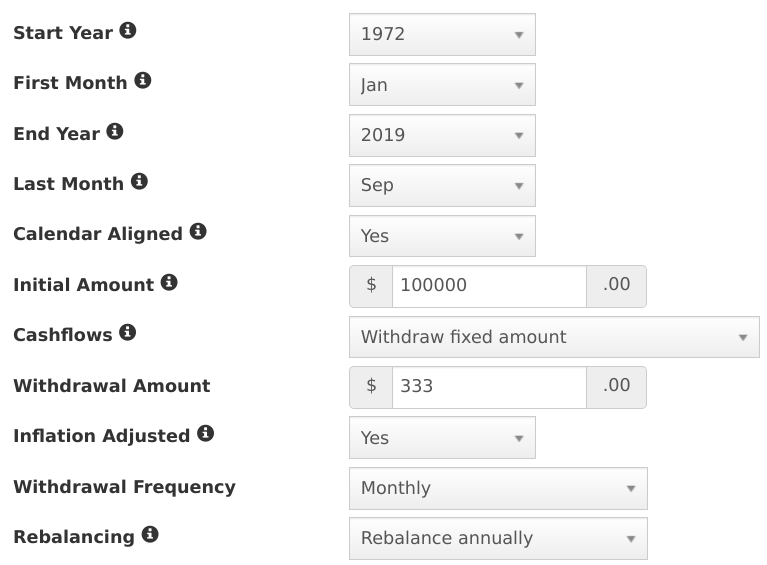
for both all stock and 50/50 stock/bonds
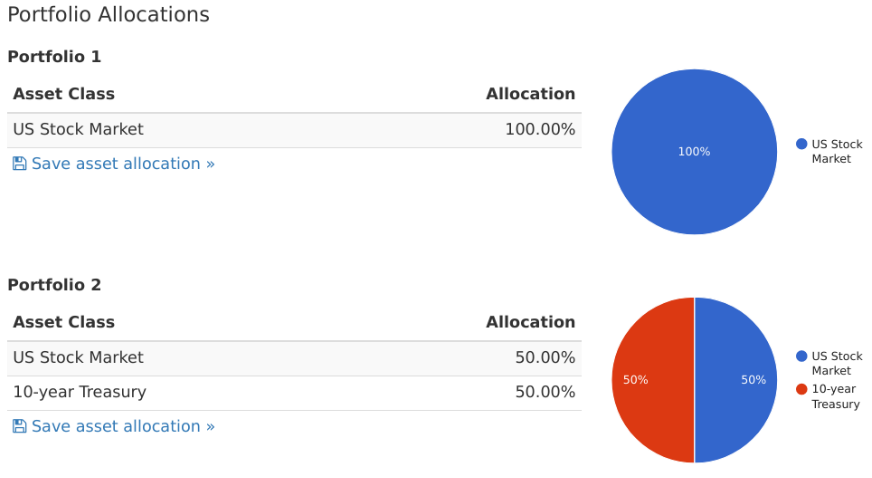
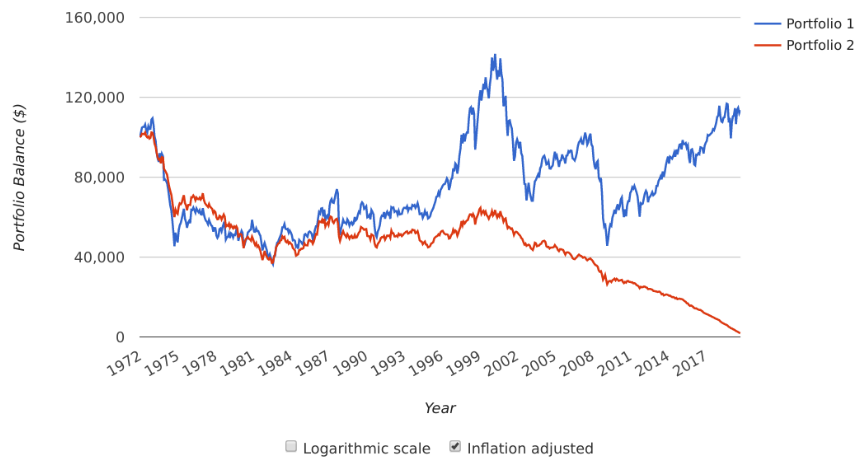
since 1972 (furthest back the data goes) and up to September 2019 (data for which the AIM I formed also runs to), and the 50/50 ultimately failed
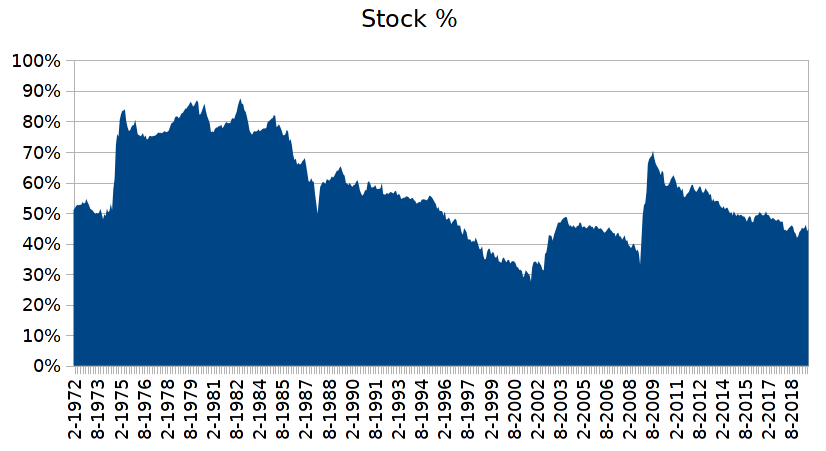
For AIM, started with 50/50 cash/stock, dividends reinvested and 10 year Treasury ladder for 'cash'
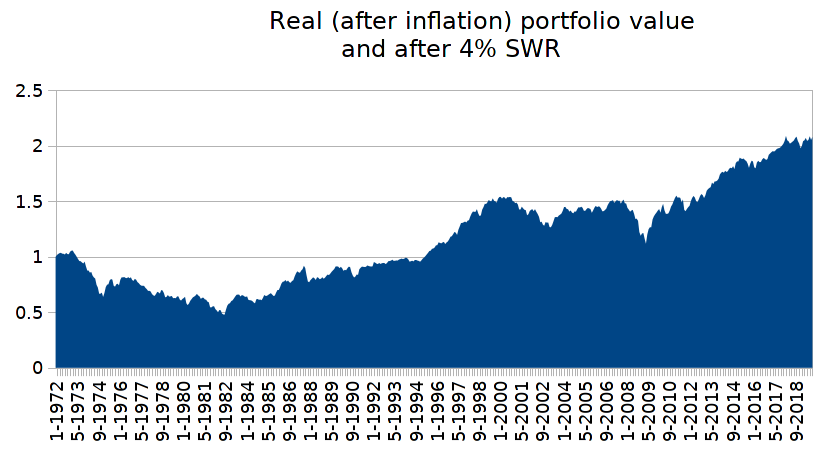
For that particular sequence of returns and inflation 50/50 initial stock/cash was the more appropriate choice as % stock relatively quickly rose towards 90% levels (which infers 10% cash levels)
As a conventional yearly rebalanced 50/50 stock/bonds failed when a 4% SWR was used, let's instead look at how 100% stock with a 4% SWR, that survived, compared to 50/50 AIM that also had a 4% SWR applied. Buy and Hold (all stock) ended with a $709,437 final portfolio value (4.19% annualised) from a initial $100,000 start date amount. AIM however had a $1,304,108 final value (averaged 57% stock over the 48 year period, yielding a 5.5% annualised gain after the 4% SWR rate (SWR value at the end date was around the equivalent of 2% of the portfolio value)).
And that was all standard AIM, no Vealies or aligning to the vwave ..etc.
The critical factor here was that there was high levels of inflation in earlier years.
Looked at from a pure accumulation angle and buy and hold achieved a 7.39% annualised price appreciation supplemented with a 2.84% average dividend over a period when inflation annualised 3.92%. So of the order of a 10.23% annualised total return (simply summing the price appreciation with the average dividend). AIM achieved a 5.5% annualised gain after discounting a 4% SWR rate (combined 9.5%) but did so with 57% average stock exposure. In fairness however whilst staring with a 4% SWR value, AIM ended with the SWR value being less than 2% of the final portfolio value, so you might average those two and assume around a 3% average of portfolio value SWR value over the total period, which pulls down the AIM total return to 5.5% price appreciation benefit + 3% average SWR value (combined 8.5%). So from that angle it looks like AIM's total reward of around 8.5% was worse than buy and hold, however when we look at how buy and hold compared when a 4% SWR was also applied, then AIM had a higher end date portfolio value than buy and hold. $1,304,108 final value for AIM, $709,437 for buy and hold ($0 for 50/50 yearly rebalanced i.e. that failed).
What if we change AIM cash to be a equal split blend of stock/gold/10 year Treasury. Well for better sight of the real drawdowns I've modified the Y axis to be log scaled in this next chart
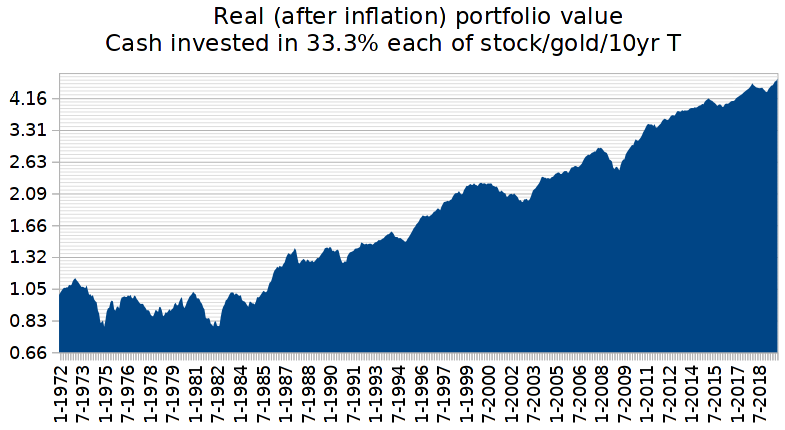
That ended with a portfolio value of over $3 million, achieved a 7.41% annualised gain after the 4% SWR and averaged 36% average stock exposure.
However, it should also be noted that 'cash' alone, when invested as a three way equal split of stock/gold/cash, achieved comparable results to 50/50 AIM when that AIM was using that for cash also
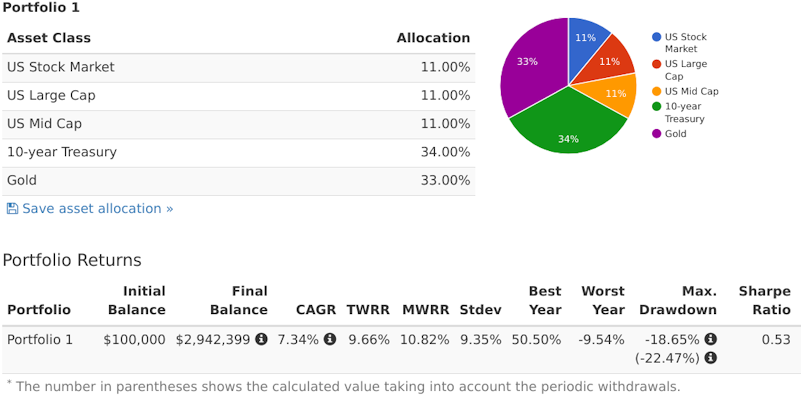
Some hate gold, often saying its a non productive asset, however its stock purchase power is very volatile and if you trade that, even via simple yearly rebalancing, including gold can reap dividends.
https://tinyurl.com/ta98uxo
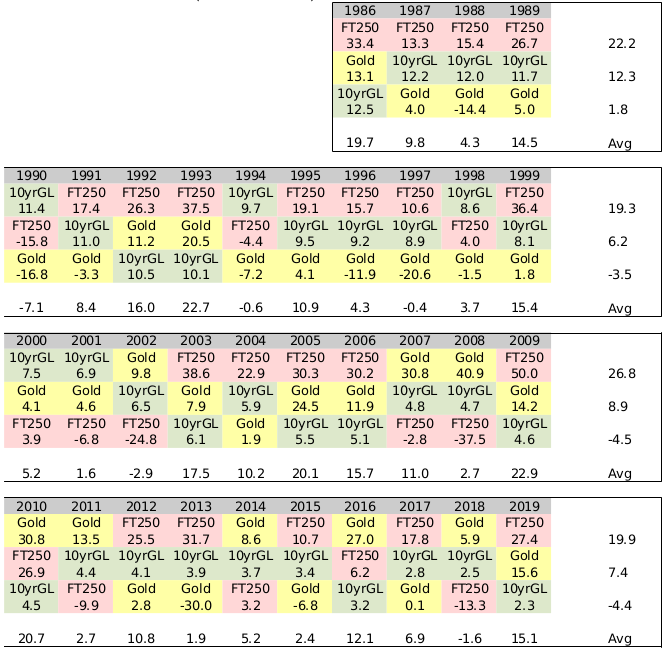
UK data and for the 1990's gold looked like a bad asset to hold, the price during the 1990’s declined from £247.70/ounce to £179.60/ounce over the decade (Jan 1990 to Dec 1999), it lost 27.5% of its value. A equal stock/gold/bond portfolio of £74,310 value started that decade with 100 ounces of gold with a £24,770 value, but ended the decade with £48,671 value of gold and 271 ounces. The number of ounces being stored expanded at a annualised rate of 10.5%/year. Simply yearly rebalancing between the assets had gold in effect provide great 'dividends'. And typically out of stocks/gold/bonds one of the three will typically do well each year, and where the average of the yearly best asset more than offsets the average of the yearly worst asset. The following is a basic Callan periodic table that ranks each years best to worst assets, and where I've averaged that both by decade and vertically (vertical average indicates the years total gain, horizontal average indicates the average of the yearly best through worst asset gains/losses). FT250 in this table are 'stock' (UK FTSE 250 mid cap stock index).
With these sorts of averages of a third weighted exposure to each of ...
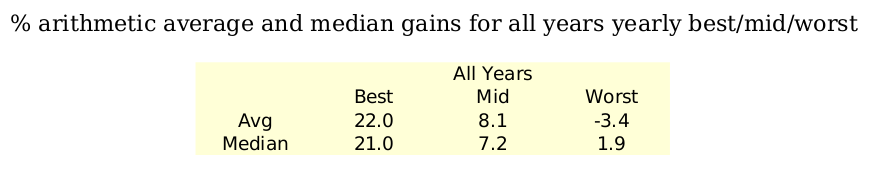
what the actual assets are in providing such rewards is pretty much irrelevant. The winning (best) third on average counters and more the worst third, to leave a overall reasonable outcome. That blend of assets is also resilient against prolonged downside risk. In good times stocks may do well. In times of fear investors might flock to cash (bonds), in times of geopolitical/economic risk/fears investors might flight to gold. Trading those fluctuations (via simple yearly rebalancing) can yield a overall 'satisfactory' outcome. Broadly, this current year I might anticipate one asset perhaps providing a +20% gain, another losing perhaps -3.5% and the third perhaps providing a +8% reward. No idea which assets will provide those rewards, and the figures are in themselves volatile - but good enough that I'll likely be able to profit take out of one asset as well as using some of the proceeds to top-up the poorer performing asset. Maybe also putting some additional aside (into cash), as reserves just in case the next year doesn't span out as hoped.
For me, I no longer really require AIM. It is a great tutor however in steering you towards adding/reducing at appropriate times, a foundation 'skill' that will serve you well. Best however to not become too absorbed by the mechanics of AIM and lose focus on the overall picture/objective of completing the intended journey.
Clive.
AIM has a broad natural tendency to decrease the number of shares held over time, in effect profit takes to dump the gains into cash. That's amplified further if dividends are also dumped into AIM's cash.
For a retired individual that is drawing income from that cash reserves that tends to balance out if dividends are being reinvested into shares/stock.
For accumulators, AIM's cash will tend to expand. Options include allowing cash to build up and then starting another AIM (further diversify the portfolio); Or to use Vealies where instead of selling shares you just increase the PC by half the value of the shares that would otherwise have been sold by AIM (without actually selling shares). A extension of that is to use the vWave and if your cash reserves are already higher than suggested by the vWave and a AIM sell trade is being indicated then 'pull a vealie' (otherwise sell the number of shares/value as indicated by AIM).
The vwave can also be used to assess whether current AIM cash reserves are too high and if so add to a existing AIM or start a new one.
For backtesting, the vealie is the simplest to 'code', if AIM cash > 50% and AIM is indicating a sell trade then leave the shares as-is and increase PC by half the AIM indicated trade value, otherwise apply the standard AIM rules. But that's not as good as using the Vealie that might be suggesting that perhaps 66% cash might be a reasonable cash reserve level ... or whatever.
Alternatively, depending upon what you 'deposit' (invest) AIM's cash in, then you might be OK with letting the levels of cash rise to relatively high levels. One of https://tinyurl.com/ssmhzk9 for instance as AIM's 'cash' (that third one is like a Harry Browne Permanent Portfolio but where instead of 25% in each of Short Term Treasury and 25% in 20 year Treasury I just lumped 50% into 10 year Treasury). The second is a form of Ray Dalio 'Safe' choice. The first is my personal preference (as a UK investor a third each in GB Pounds Treasuries, US$ stocks, and gold is a form of three way 'currency' diversification. Blend that first one 50/50 with stocks and ... https://tinyurl.com/t8uyf9z
Clive.
Focus on and boost cash returns
https://tinyurl.com/wak9rmm
and you can potentially add modest/significant amounts to overall portfolio real gains. The above link shows a form of Permanent Portfolio and/or a Ray Dalio type choices of 'safe' asset allocations for 'cash'.
You might end up looking at such 'cash' choices such as
https://tinyurl.com/uewtb2o
Note I've held/used 2x leveraged funds for some years now. De-scaled back down to 50/50 in 2x/cash broadly aligns to the 1x, and is in effect a play off between the cost the leverage fund incurs to provide 2x exposure, to that of the return achieved on the 'cash' not invested in the 2x
https://tinyurl.com/v4t4vte
Clive.
Broadly price appreciation = dividend yield = interest rate = inflation. So putting aside dividends and cash interest as broadly "offsetting inflation" then those figures might be considered as being 'real' (reflective of after inflation).


Nice table/image AIMStudent. Thanks.
Broadly price appreciation = dividend yield = interest rate = inflation. So putting aside dividends and cash interest as broadly "offsetting inflation" then those figures might be considered as being 'real' (reflective of after inflation).
For someone in drawdown/retirement - ten shares were sold over 5 years, raising around $400/year (by eye approximation of average price of $200/year, adjusted for inflation). Broadly 2 shares sold/year raising/providing around 4%/year (as the source of 'disposable income'). Whilst dividends/interest offset inflation.
$10,000 initial value, spending $400/year for 5 years, $2000 total, would have resulted in the tables $7460 final cash value being around $2000 lower, and $5460 cash compares to the more recent stock value - so the portfolio would still be sitting at around 50/50 stock/cash.
Different of course for accumulators, but then they'd be looking to add additional stocks/holdings to their portfolio over time (add new AIM's or expand existing AIM's).
Returning to drawdown, S&P500's 2% year/dividends is too little if using a 4% retirement withdrawal value, so a non-AIM investor might opt for perhaps 67/33, to provide 4% income from either dividends + cash or dividends + price appreciation according to how well or poorly stocks might perform. Not a direct time period comparison but ...https://tinyurl.com/uuv2hr5 indicates total returns, including interest/dividends of a $12,487 final value after a inflation adjusted $400 were drawn from a $10,000 67/33 yearly rebalanced stock/cash asset allocation. The above AIM looks to me to have had around a $11,000 final portfolio value after similar/same withdrawals, and that excluded cash interest and dividends, and IMO would likely have been the better overall outcome when dividends/cash interest were also factored in. Whilst having achieved that with less risk (50/50 instead of 67/33 average stock/cash). Revising that portfoliovisualizer link to instead use 50/50 https://tinyurl.com/r843w7t - and that had a $11,688 final value (total returns), i.e. a total return of only a little more than AIM without having included cash interest/dividends.
For accumulators, not so good as stocks were pretty much a upward slope line from day 1 such that all-in from day 1 would be the better outcome - at least so far. Later, who knows, a dive in share prices could have the two realigned again, or perhaps AIM even having been better.
Clive
Looking at the Feb 1993 onward figures, I see a 3% annualised real (after inflation) gain for the AIM, excluding cash interest. Including cash interest? Well SHY (short term treasury ETF) annualised 3.65% over that period, and as the portfolio started at 50/50 stock/cash, ended at 68% cash, assuming a average 59% cash overall cash (average of the two) then proportioned 0.59 x 3.65 = 2.15% on top of that 3% annualised - to make a total 5% annualised real gain (broad approximation).
To achieve a comparable result to the 1993 AIM a 22/78 stock/cash yearly rebalanced compared in reward https://tinyurl.com/u374mjp and looking at the growth progression chart for that in both 2003 and 2009 such a asset allocation would have compared in total reward to Buy and Hold (approximately) and barely seen any drawdowns (-2.94% year decline in 2008 compared to -37% for buy and hold). So after a decade out and again at 15 years out - compared to B&H. At those times, after big stock declines, a AIM investor might have been held up as being a winner (similar reward with much less risk). At other times, such as to recent, AIM can be held up as a loser, if a 5% annualised real gain compared a 7.3% annualised real gain (from B&H) might be considered as being a loser (many would be very content with a 5% annualised real).
AIM was born out of large losses during the 1960's/1970's where entire life savings were lost across relatively short periods of time. Retirement plans/investments wiped out. What that 1993 AIM in effect is saying is that after 7.3% annualised B&H gains its a time to have taken much of the stock risk off the table as its unlikely that rate of return will be sustained.
Lichello did come to realise that 50/50 was too defensive, and revised that upwards to 67/33 and then to 80/20. One way to look at it is ... what are the chances of portfolio value doubling before hitting a event that perhaps halves the value. If unlikely then all-in stock might be the choice; If likely then a more defensive asset allocation is a reasonable choice - perhaps 50/50 stock and gold. Unable to predict however - well blend the two 50/50 ... for a overall 75/25 stock/gold for instance, which since Feb 1993 https://tinyurl.com/t59udbd or going back even further https://tinyurl.com/wlr336z (since 1972).
Even however if AIM does build up large cash reserves, as per how 50/50 AIM tends to do, the rewards can still be satisfactory/sufficient, 3% or 4% real is generally OK for many investors, and later much of those reserves might be deployed during the next substantial down period, when others are losing their all, and after which the subsequent rewards tend to be significantly above average.
The comparison should not be so much direct comparisons over individual periods, but rather the broader picture. There have been some historic cases of where even over 50 years Buy and Hold with dividends reinvested rewards have barely broke even in real terms, any withdrawals/spending would have resulted in draw-downs. Investors more generally want to, sooner or later, spend money from their investments, 4%/year being typical, and AIM is more inclined to fulfil that objective. But yes, over some periods you might compare that to other alternatives that might have generated even more but that over other periods much less so, perhaps even to critical (wipe out) levels as many endured during the 1970's (or Wall Street Crash years ...etc.).
Corona ... Of course this could be only the beginning of this disaster.
Whilst 50/50 stock/bond may seem OK, in practice over the mid to longer term bonds are a drag factor. Comparable to non productive assets. In simple terms you might buy a farm, leave that idle and see its (land) value rise with inflation. Bonds generally pay interest that offsets inflation, are like a idle farm. Work the land and the products tend to generate dividends in addition to the land price (broadly) rising with inflation – more like ‘stocks’.
Another factor with bonds is that you’re lending to the state, who can set interest rates and drive/slow inflation (printing money is akin to micro-taxation i.e. each new note printed devalues all other notes in circulation). Combined with taxation and in more extreme circumstances, high inflation, high interest rates, high taxation yields a net loss for ‘lenders’ (buyers of Treasury bonds/notes/bills).
Fundamentally for mid/longer term investing productive assets (stocks) are at least comparable to stock/bond, over multiple years you did just as well with all-stock in bad cases as stock/bond blends, but in more ‘average’ periods stock heavy (productive assets) were better. AIM accommodates that as ‘cash’ isn’t a mandatory factor in its calculation. AIM can signal buys and sells in total disregard of whether cash is actually available or not. Which means that with multiple AIM’s you might have one selling (reducing) to provide the cash for another that is buying (adding).
For comfort however, some bonds can help. If for instance I have a spending requirement of $30,000/year and have a $1M portfolio value .. so a 3% income production requirement then https://ycharts.com/indicators/cyclically_adjusted_pe_ratio indicates a recent PE10 (CAPE, 10 year averaged PE which tends to be more predictive than just the current PE alone) of approximately 30 (nearer to 31 at present, but for simplicity I’m rounding here). Which is a Earnings Yield (inverse of PE) of 3.33%. As I only require 3% (in this example), then I might allocate 3 / 3.33 = 90% to stocks. Leaving a ‘buffer’ of 10% in bonds.
Realigning periodically to the current CAPE doesn’t generally improve things. It’s a one off measure that once used/set you just stick with that.
That all said, https://www.multpl.com/s-p-500-pe-ratio indicates that the PE has in the last decade spiked up and back down again to quite high levels. A problem with arithmetic averages is that extremes can distort the figure. A room of 4 individuals each 6 foot tall, with one giant 20 foot tall individual has the arithmetic average close to 8’10”. Median is a better measure as that uses the middle sample case, 6’ tall in this example. A by eye look at that PE chart link suggests 20 to 25 PE is a reasonable approximation that discounts the exceptional 'giant', which equates to a 4% to 5% earnings yield (which is also generally considered as being the inflation adjusted earnings approximation). So if I’m lumping into stocks at a 20 PE, 5% earnings yield, with a 3% spending requirement then 60% stock/40% bonds would be a reasonable choice of target weightings.
Another method/choice is to use buckets. Enough in bonds to cover x years of spending, the rest in stock accumulation (reinvesting dividends) for growth with the hope/desire that stock growth accumulates sufficiently enough to offset bond drawdown. 30% in bonds, spending 3%/year lasts 10 years. 70% in stocks and if that accumulates 100 / 70 = 1.42 over ten years (1.42^(1/10) = 1.036 = 3.6% annualised real) will have the bonds all spent after 10 years, but where stock had grown sufficiently to have the same inflation adjusted value as the original start date total portfolio value. If stocks grow faster, then perhaps profit take to buy more bonds (add additional years to how long the bonds last before being drawn down to zero). When you start with two buckets with one of 30% bonds, the other 70% stock, and draw down bonds, until 0% bonds remain, then that’s a overall average of 15% bonds, 85% stock. Yes early years stock volatility risk is reduced (more in bonds), and later years stock risk are high (100% stock), compared to a constant weighted 85/15 stock/bond, but so also is the risk of not getting to live another 10 years, and if you don’t then more likely younger heirs would be better matched with a relatively stock heavy portfolio inheritance anyway.
All the " improvements " to AIM get into the subjective territory you want to avoid. Stay with AIM by the book.

Stay with AIM by the book.
Hi Vitali
Just to reiterate, that chart was for REAL (after inflation) valuations. If you look at a nominal version the downs are much less frequent.
Clive.
A nice form of 'cash' is another AIM that is selling as the current one is buying, ideally in equal amounts. I've been doing my usual once yearly (end of year) data updates recently and for US sectors and the raw data for the 'Periodic Table' (Total Returns including dividends % gains/losses) ...
Year	Best			(US sectors (TR))							worst
 1992	23	20	16	15	10	10	7	5	3	2	-16
 1993	22	20	19	16	15	15	14	13	11	-4	-8
 1994	20	14	10	6	4	3	-2	-4	-5	-8	-12
 1995	58	54	42	40	39	39	33	31	20	20	15
 1996	44	35	35	26	26	25	21	16	12	6	1
 1997	48	44	41	34	33	29	27	25	25	20	8
 1998	78	52	44	41	16	15	11	11	1	-6	-18
 1999	79	25	25	21	19	19	4	-5	-9	-11	-15
 2000	57	37	26	26	17	16	6	16	-20	-39	-41
 2001	14	3	3	-6	-6	-9	-10	-12	-12	-26	-30
 2002	4	-4	-5	-11	-15	-19	-24	-26	-30	-34	-37
 2003	47	38	37	37	32	31	26	26	15	12	7
 2004	32	32	24	20	19	13	14	11	8	3	2
 2005	31	17	12	6	6	4	4	2	1	-6	-6
 2006	37	35	24	21	19	19	19	14	13	8	8
 2007	34	23	19	16	14	12	12	7	-13	-16	-19
 2008	-15	-23	-29	-30	-33	-35	-38	-40	-43	-46	-55
 2009	62	49	41	28	21	20	17	15	14	12	9
 2010	28	28	27	22	20	19	14	12	10	5	3
 2011	20	14	13	8	6	6	5	2	-1	-10	-17
 2012	29	24	20	18	18	15	15	15	11	5	1
 2013	43	31	41	36	28	26	26	25	13	11	3
 2014	29	28	25	20	16	15	10	10	7	3	-8
 2015	10	6	6	5	1	-2	-3	-5	-7	-9	-22
 2016	17	16	14	11	9	8	6	5	3	0	-6
 2017	38.8	23.8	23	22.2	22.1	21	13.5	12.1	10.9	-1	-1.3
 2018	6.5	4.1	0.8	-0.3	-2.2	-8.4	-12.5	-13	-13.3	-14.7	-18.1
 2019	50.3	32.7	32.1	29.4	29	27.9	27.6	26.4	24.6	20.8	11.8
Market crashes or corrections are not the norm, but rather an exception. They rarely happen.

Market crashes or corrections are not the norm, but rather an exception. They rarely happen. And when they do, prices always recover. Who cares if the TEMPORARY losses are more on the way down? We'll just have to tough it out.
Has anyone done a statistical analysis that tells what gives better long-term returns across many sectors/industries, Buy and hold strategy vs AIM?
If we have a long-term outlook, maybe it is financially more productive to deploy a buy and hold strategy?


Hi Tom
Re: AIM Cash Burn Rate..................
Here's the chart. It shows depth of price drop where AIM will run out of cash assuming a linear drop in share price.
http://web.archive.org/web/20120610011525id_/http://www.aim-users.com/cashburn.htm
Just own an S+P 500 fund
For simplicity I pool my cash
The one thing that still bothers me about Lichello's AIM is that you never know at what price point your cash reserve will run out.

Hi Vitaali
Running out of cash before the bottom isn't critical. More important is that you haven't fed a asset with your reserves that continues on down towards total failure. i.e. diversify and hold assets that are less inclined to total failure.
Also there are various forms of 'averaging'. Typically the 'average' is a great outcome as that avoids the worst case outcomes.
UK data from 1896 for 30 year after inflation total returns (UK over that period has somewhat reflected a global index as a number of the largest stocks are just listed out of London, predominately have global business activities). The US over that period was a right tail (great outcome), others saw much poorer outcomes. Global exposure will better ensure 'average' outcome, rather than poor outcome, but that average could be lower than the US average if the US continues to be a right tail good outcome (with the way China is going, who knows, Japan for instance during the 1970's/1980's rose from nowhere to knock the US back from 75% down to 25%. Japan's 1990's however saw their rise drop rapidly away again when the US again restored its predominance). That aside, here are some figures for UK since 1896 total 30 year after inflation, costs and taxes outcomes with dividends being reinvested
	worst	median
 50/50	1.088	2.11
 67/33	1.057	2.44
 75/25	1.026	2.62
 80/20	1.002	2.61
 100/0	0.872	2.65
50/50	3.04
 67/33	3.99
 75/25	4.30
 80/20	4.45
 100/0	5.31
Hi Vitaali
Clive your example hits the nail on the head. This formula is useful specifically for the purpose of figuring out how much cash should be invested at any given time for a specific equity. That's what I was going for. Pure AIM by the book does not answer the question what percentage of cash should be invested for each stock. I don't think one ratio should apply to every situation, stock/ETF. Each stock's price range is different. And that's why, in my opinion, we need to allocate different amounts of cash for every equity.
Do you know of a better way to do this?
Great info, thanks ls7550
I may look at doing a few ETF's and a few large mega-caps as well.
Appreciate all the help here as I get started!
Personally I've always gone with the log stochastic choice
( log(current) - log(bottom) ) / ( log(top) - log(bottom) )
Just fits better IMO.
If you opine a 100% gain from current levels would be high and you'd be OK to be in cash at that share price level, and 50% down would be low at which point you'd be happy to be all-in, and the current price was 100
(log(100) - log(50) ) / ( log(200) - log(50) ) = 0.5 (50% cash indicated).
When the price is 150
(log(150) - log(50) ) / ( log(200) - log(50) ) = 0.79 (79% cash indicated)
When the price is 66
(log(66) - log(50) ) / ( log(200) - log(50) ) = 0.2 (20% cash indicated)
...etc.
Clive.
Hi Jacquespluto
Planning to get started with XLB and XLE for now and add some more in the future.
 Many around here prefer ETF's for their greater resilience against going broke (cost-averager's nightmare). Yet others however are content with mega-cap multi-nationals. Lichello did also highlight how the Rockerfeller Trusts (back in the 1970's) comprised large amounts invested in relatively few stocks/diversification (predominately Exxon, IBM and Rockerfeller Centre Inc.). If you do hold individuals and even as few as 8 (12.5% weighting), a unlikely total loss of that 12.5% isn't that different to a broader market decline of -12% or more that at times occurs. Also, at times, individual stocks comprising a stock index such as the S&P500 can be weighted 10% within the Index, and/or individual sectors might be weighted 20% or more.
 I tell people I am one of the few people they will meet that are happy when the market goes down.
So I am selling many of the stocks I have and buying them back the same day and upping my cost basis. When I finally do sell it again based on AIM I will have less gains to pay taxes on.
Toofuzzy
Hi Tom.
2% average growth/inflation (Fed/BoE ..etc. target), has been a long term general target, but some opine that should be revised ...
Why the Fed targets 2% inflation (note that is a 2015 article).
Regards. Clive.
Hi Toofuzzy
Banks and insurance firms have to hold a proportion of assets in government issued bonds which causes some of the disconnect you referred. Potential appeal of returns from price appreciation potential over income is another. As is/was the models used. Take the UK for example, the Treasury created/issued new bonds/gilts) whilst the central bank (Bank of England) printed money and bought up older (higher coupon/face value yield) gilt issues - and where all of the interest paid by the treasury on those older gilts the BoE bought is returned from the BoE back to the Treasury. Simply - that replaced older higher cost UK debt, around £500Bn of gilts in issue paying a average 5% with £1Tn newly created gilts paying a average 2.5%. Overall costing no more to service (amount of yearly interest paid out by the Treasury), but ballooned the apparent debt from £500Bn to £1.5Tn. A third of that however could conceptually just be torn up (wiped off the Treasury and BoE books) but there's no harm in just leaving it as-is, where the BoE has the added 'tool' of potentially selling some/all of the gilts it holds back into the public market at any time it might deem it appropriate to do so. That aside, there's around twice as many gilts in issue, paying half the rate compared to older (potentially invalidated) gilts, spread over a longer period of time = rational debt restructuring.
Regards. Clive.
Re: Negative rates
High Firebird.
Banks and Insurance firms would just accept it.
The EU (ECB) printed over €2 trillion. Fundamentally they spent that on bailing out Germany post 2009 financial crisis - where their massive big bets didn't pay off (so the rest of the EU in effect bailed them out, whilst the likes of Greece with tiny debts by comparison were refused such assistance by Germany!). Had those big bold bets (bad debt) paid off that would have been a different matter (pretty certain they'd have kept the benefits for themselves).
Printing money devalues all other notes in circulation so in turn everyone pays.
The primary factor is not relative nominal rates but real rates, after inflation. In a -2% deflationary world a -1% return from a investment/deposit is a real +1% benefit. Buying 30 year treasury bonds at a 0% (or lower) real rate seems crazy to some, but for those expecting a shift into even more negative yields, for instance a move from 0% to -1% - well that yields a significantly higher price being paid for the same bonds (+35% price increase). For those expecting a move in the opposite direction, short dated Bills/cash are the preferred choice, as even though they might lose -1%/year from holding, that might avoid a -35% capital loss whilst remaining relatively secure; Or cash stuffed under the mattress costs nothing, but is at greater risk of being stolen/destroyed. Cash is a just a zero duration (immediately redeemable) 0% nominal face coupon yield bond (bill).
Stocks are just more extreme forms of bonds, very long duration (on average), variable coupon (yield) and as such the price is more volatile.
Regards. Clive.
Hi SFSecurity
when you say "stocks," what are you referring to, S&P 500 or some other consolidated ETF?
Next, the column with the 1's and 0's references what?
Welcome to my small shop, stocked with just two items, umbrellas and sun cream (gold and stocks). Each year one or the other tends to do ok, offsetting the years bad performer. Mostly, but not always. When a bad year is endured, generally the adjacent year(s) are satisfactory. Combined, very much like a (currency) unhedged global bond - moderately stable growth.

Throw in your home value, and perhaps you might be in keeping with what the Talmud advocated as a appropriate asset allocation around 1.5 millennia ago. Third each in land (home), commerce (stocks) and reserves (gold).
Typically one asset +24% up on average over the year, the other -2% down. Simple average 11%. Annualised 10%.
Very much a slow-AIM however, and can see sequences of years of one (or the other) asset being the years best performer. In the context of the shop - sometimes the sun shines for years, sometimes it rains for years. Who cares, when you're appropriately diversified then comme ci comme ça
Spicier version (small cap value for stocks) https://tinyurl.com/y49ocj8d
options can be very effective for working your way out of a bad situation or just to reduce cost basis for longer term holdings
I've never used leveraged ETFs, but first thing I check is the expense ratio and the three have expense ratio of around 1 to 1.5%
wayback in 2000 .. or other snapshots might contain the image?
It's certainly stored other images ...

Re Cash
If cash increases 5% when stocks have dropped 30% that cash buys 50% more stock.
Cash can lag however, to reduce that lag I like the Zvi Bodie choice, a little in highly speculative, most in safe. 7.5% in SSO (2x stock) for example could see it lose two thirds (or more) of its value in any one year, the 92.5% in safe however might go a long way towards offsetting such losses. Broadly overall that compares to 15% stock, 85% bonds assuming you only rebalance once/year, which tends to enhance rewards (reduce cash lag) modestly.

If "cash" yields around 3% real (after inflation), there's less pressure on the feeling that cash needs to be deployed elsewhere.
5% in a 3x is IMO even better (again just rebalance once/yearly). Yes in a bad year that might drop a lot, but the daily rebalancing tends to attenuate relative declines. Similarly in a good year the rewards can be amplified. A downside however is that leveraged products are seen as vile by many, including regulators - such that availability is increasingly becoming more difficult to retain investors. Shame, as IMO used sensibly and they're a great thing to have in your toolkit.
The read me in that newport zip file is missing/misleading
I installed dosbox and extracted the zip to /root/DOSBox-Win31-Newport under a Ubuntu setup
I edited the STOCK.NPT to the current date (2348518) which I obtained via the other download link (downloaded the .html file and then viewed it in my browser).
I then ran
dosbox
mount c /root/DOSBox-Win31-Newport/C
windows


