


Monday, February 24, 2020 2:26:44 AM
Do you find yourself trading less often now compared to what a normal AIM program would suggest? Do you use any kind of rules for percentages or amounts traded?
Pretty much just a yearly rebalancer now Vitali, back to target weightings. What Toofuzzy might describe as 'slow AIM'.
Tend to view everything as a 'bond'. Stocks being like undated variable coupon bonds, gold undated zero coupon inflation bonds ...etc.
The high interest rates/inflation of the 1970's/1980's was a good time to move heavily into long dated bonds, of which stocks are the most extreme version of such bonds. With long/undated bonds lowering yields (inflation/interest rates) equates to higher prices and vice-versa. A transition from high to low interest rates bolsters rewards. In the opposite direction you more ideally need to be at the shorter dated end (buy a bond that matures in a couple of years and if interest rates rise the bond matures at face value and rolls into a new bond that might be paying a higher interest rate).
Looking in the rear view mirror and investors might see great gains from stocks and anticipate that being reflected into the future. But starting from low interest rates as of present could be disappointed. Putting aside the 'timing' points look at the green trend line in this next chart for instance

the future for price appreciation from stocks is potentially not as rosy as it has been in the past. As Tom says, there are three sources of rewards, price appreciation, income (dividends/interest) and volatility capture. With price appreciation and income relatively low my focus has predominately switched towards volatility capture
Repeating that table I posted earlier
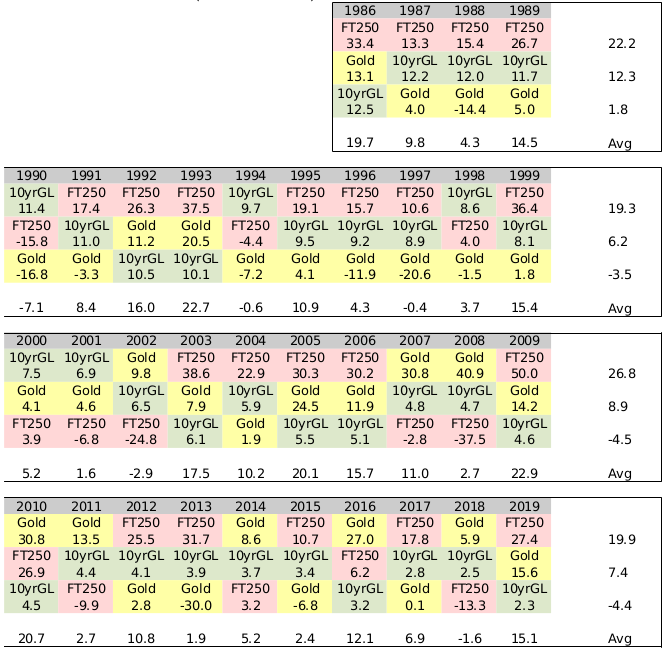
and volatility capture has persisted. Look for instance at the 1990's far right figures for the yearly best/mid/worst assets gains/losses and that compares to the 2010-2019 decade. And they're nominal values, so with higher inflation in earlier decades the same/similar nominal rewards in a lower (recent) inflation rate situation = higher real (after inflation) reward.
For that I maintain a barbell (more usually a barbell is associated with actual bonds i.e. holding equal measures of long dated (20 year) and shorter dated (1 year) bonds, which combined approximates a 10 year bond) of two extremes, stocks and gold, both of which can be very volatile, with a shorter date bond fulcrum - that tends to be stable in nominal terms. And just yearly rebalance the three back towards equal weightings. In US terms pretty much https://tinyurl.com/wyenpvg
Why Small Cap Value? Because 33.3% in that is along the lines of a Larry Portfolio https://portfoliocharts.com/portfolio/larry-portfolio/ I hold leveraged ETF's (LETF's) and as part of that the education was informative. Many investors hate/berate LETF's, but for me they have tax advantages, not to scale up risk. What is a reasonable amount of leverage? All-stock is considered as 1x, a LETF might target 2x (twice the daily gain/loss) ..etc. Factor in that stocks are a form of leverage i.e. firms borrow/hold debt and the broad average appropriate leverage IMO is around 0.7 (70% stock). In a 2x LETF doubling up daily gains/losses that compounds out (very broadly) to the same reward as 1x over the mid to longer term, whilst enduring twice the volatility along the way. Same gain, more volatility is a lower risk adjusted reward, where the stock price will tend to mid to longer term zig zag around the 1x. De-leverage what 1x stocks in effect leverage by and 70/30 stock/bond will tend to see 1x (being leveraged) zig zag around that. Small Cap Value (SCV) tends to be even more leveraged (debt) than total stock market (TSM), such that you can reduce stock weighting further https://tinyurl.com/vtan6fs and even down at 33% weighting can broadly achieve similar reward as all stock (TSM). And with such relatively low levels of stock exposure that opens up greater potential to focus in on volatility capture benefits (trading between assets - via simple rebalancing back to equal weightings once/year). Referencing US data for similar I see figures of
Rebalancing those back towards equal weightings once/year also 'trades' in a AIM like manner, without all of the 'technicalities' (or tendency to become too engrossed in the mechanics/tweaking of AIM).Year CPI Gold 10yrT SCV
1972 3.41% 49.02% 2.35% 11.15%
1973 8.71% 72.96% 3.29% -24.12%
1974 12.34% 66.15% 4.05% -21.09%
1975 6.94% -24.80% 5.52% 53.94%
1976 4.86% -4.10% 15.29% 54.78%
1977 6.70% 22.64% 0.53% 15.88%
1978 9.02% 37.01% -0.74% 19.25%
1979 13.29% 126.55% 1.83% 37.80%
1980 12.52% 15.19% -1.29% 25.77%
1981 8.92% -32.60% 5.28% 15.69%
1982 3.83% 14.94% 39.57% 36.87%
1983 3.79% -16.31% 2.30% 42.61%
1984 3.95% -19.38% 14.87% 5.69%
1985 3.80% 6.00% 29.85% 37.46%
1986 1.10% 18.96% 21.35% 13.99%
1987 4.43% 24.53% -2.64% -3.51%
1988 4.42% -15.26% 6.90% 29.00%
1989 4.65% -2.84% 17.84% 19.21%
1990 6.11% -3.11% 7.70% -19.05%
1991 3.06% -8.56% 18.91% 42.96%
1992 2.90% -5.73% 7.23% 28.23%
1993 2.75% 17.68% 12.97% 21.10%
1994 2.67% -2.17% -7.19% -0.07%
1995 2.54% 0.98% 25.55% 30.32%
1996 3.32% -4.59% -0.00% 21.41%
1997 1.70% -21.41% 11.97% 35.44%
1998 1.61% -0.83% 14.64% -2.68%
1999 2.68% 0.85% -7.83% 3.35%
2000 3.39% -5.44% 17.28% 21.88%
2001 1.55% 0.75% 5.40% 13.70%
2002 2.38% 25.57% 15.45% -14.20%
2003 1.88% 19.89% 0.15% 37.19%
2004 3.26% 4.65% 4.50% 23.55%
2005 3.42% 17.76% 3.01% 6.07%
2006 2.54% 22.55% 2.19% 19.24%
2007 4.08% 30.45% 10.42% -7.07%
2008 0.09% 4.92% 20.53% -32.05%
2009 2.72% 24.03% -10.17% 30.34%
2010 1.50% 29.27% 7.92% 24.82%
2011 2.96% 9.57% 16.24% -4.16%
2012 1.74% 6.60% 2.73% 18.56%
2013 1.50% -28.33% -8.57% 36.41%
2014 0.76% -2.19% 10.63% 10.39%
2015 0.73% -10.67% 1.12% -4.77%
2016 2.07% 8.03% 1.00% 24.65%
2017 2.11% 12.81% 2.39% 11.67%
2018 1.91% -1.94% 0.99% -12.34%
2019 2.29% 17.86% 8.03% 22.61%
In the UK we still run to Catholic fiscal years (April to March), so for me a appropriate time to yearly rebalance is around that fiscal year end time-point, as in some cases it may be more appropriate to rebalance in the old financial year, or in the new financial year, or even across both the old and new fiscal years (tax efficiencies).
As per with buying and holding LETF's however, that many hate, so also do many hate gold, so my personal style is not a popular choice at all. If (online or direct) conversations ever come around to the subject of investments and LETF's/Gold are included in that conversation most will either look at you as though you are mad, whilst some even resort to be abusive. But that's fine with me as I've always been more inclined to go in the opposite direction to the crowds (fits with my personality/character), as does AIM. Fundamentally you have to find and stick with what sits well with your personality/character.
Clive.

Join the InvestorsHub Community
Register for free to join our community of investors and share your ideas. You will also get access to streaming quotes, interactive charts, trades, portfolio, live options flow and more tools.

