


Thursday, February 20, 2020 5:19:11 PM
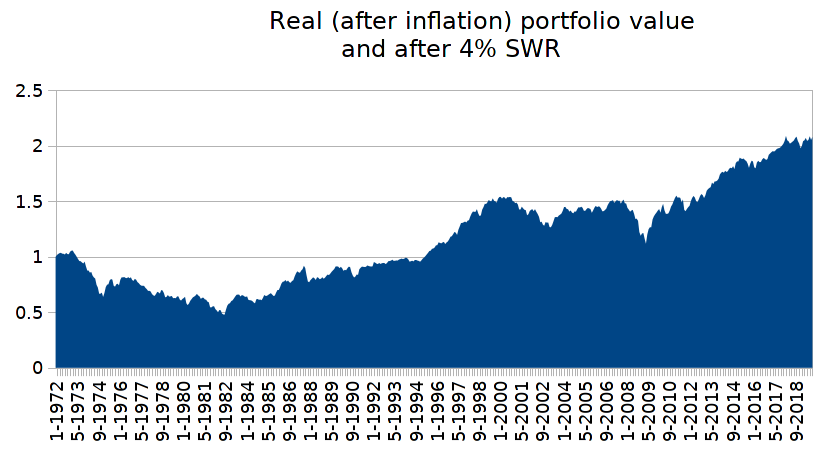
For those in retirement, sequence of returns can make a massive difference. Look at total returns from all stock, or 50/50 stock/bonds and the annualised total rewards can look decent, perhaps 10% annualised versus 3% inflation such that the illusion is that such portfolio's could have comfortably accommodated a 4% Safe Withdrawal Rate (SWR) [Safe withdrawal rate is where you start with a percentage amount of the portfolio value as the capital amount drawn in the first year, and in subsequent years you uplift that capital amount by inflation as the amounts drawn in subsequent years].
Using Portfoliovisualizer.com (US data/inflation ..etc.), plugging in a 4% SWR ...
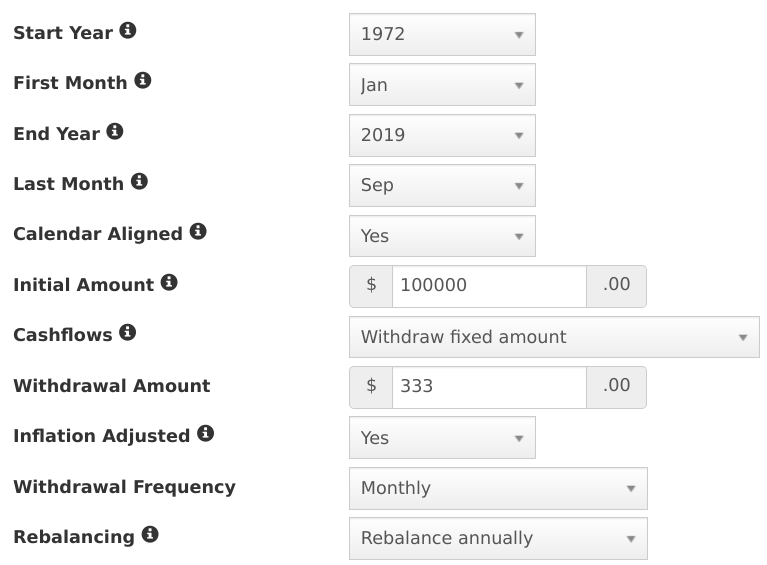
for both all stock and 50/50 stock/bonds
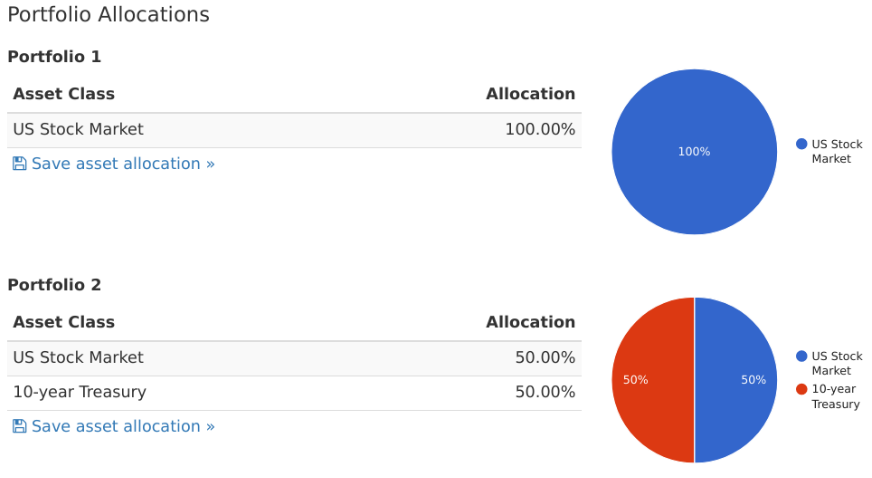
since 1972 (furthest back the data goes) and up to September 2019 (data for which the AIM I formed also runs to), and the 50/50 ultimately failed
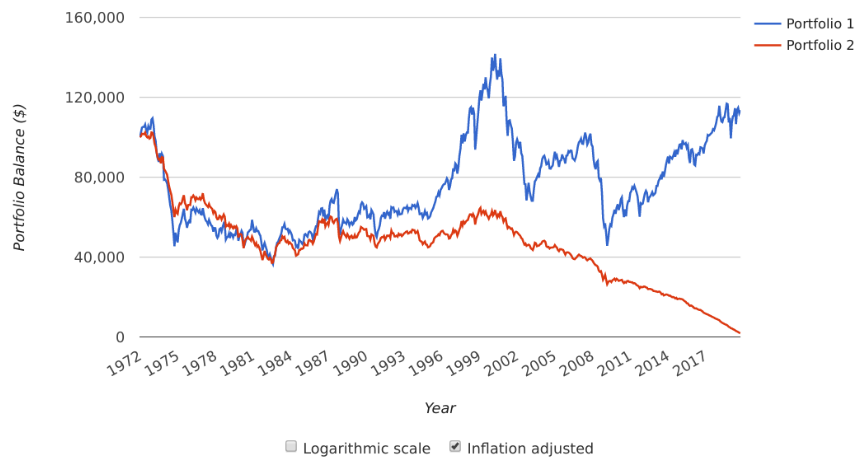
For AIM, started with 50/50 cash/stock, dividends reinvested and 10 year Treasury ladder for 'cash'
For that particular sequence of returns and inflation 50/50 initial stock/cash was the more appropriate choice as % stock relatively quickly rose towards 90% levels (which infers 10% cash levels)
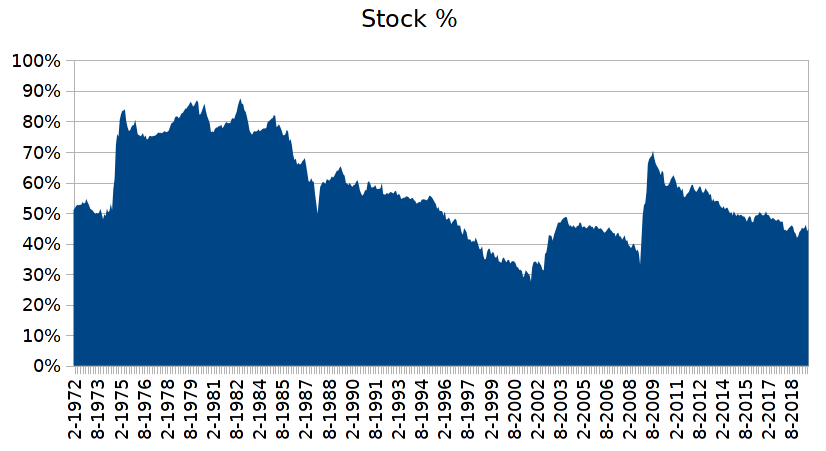
As a conventional yearly rebalanced 50/50 stock/bonds failed when a 4% SWR was used, let's instead look at how 100% stock with a 4% SWR, that survived, compared to 50/50 AIM that also had a 4% SWR applied. Buy and Hold (all stock) ended with a $709,437 final portfolio value (4.19% annualised) from a initial $100,000 start date amount. AIM however had a $1,304,108 final value (averaged 57% stock over the 48 year period, yielding a 5.5% annualised gain after the 4% SWR rate (SWR value at the end date was around the equivalent of 2% of the portfolio value)).
And that was all standard AIM, no Vealies or aligning to the vwave ..etc.
The critical factor here was that there was high levels of inflation in earlier years.
Looked at from a pure accumulation angle and buy and hold achieved a 7.39% annualised price appreciation supplemented with a 2.84% average dividend over a period when inflation annualised 3.92%. So of the order of a 10.23% annualised total return (simply summing the price appreciation with the average dividend). AIM achieved a 5.5% annualised gain after discounting a 4% SWR rate (combined 9.5%) but did so with 57% average stock exposure. In fairness however whilst staring with a 4% SWR value, AIM ended with the SWR value being less than 2% of the final portfolio value, so you might average those two and assume around a 3% average of portfolio value SWR value over the total period, which pulls down the AIM total return to 5.5% price appreciation benefit + 3% average SWR value (combined 8.5%). So from that angle it looks like AIM's total reward of around 8.5% was worse than buy and hold, however when we look at how buy and hold compared when a 4% SWR was also applied, then AIM had a higher end date portfolio value than buy and hold. $1,304,108 final value for AIM, $709,437 for buy and hold ($0 for 50/50 yearly rebalanced i.e. that failed).
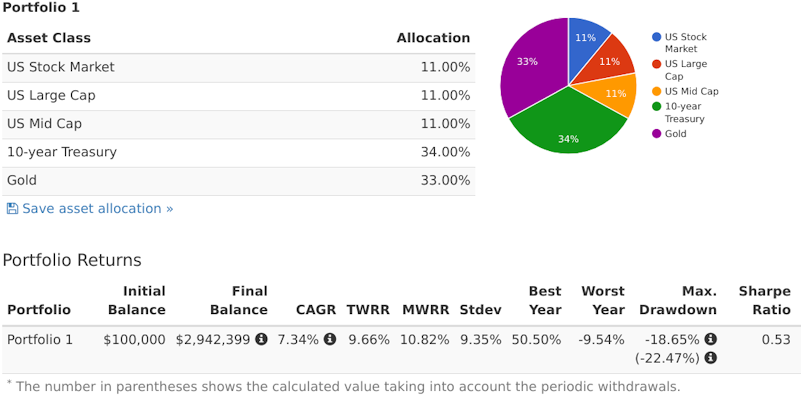
What if we change AIM cash to be a equal split blend of stock/gold/10 year Treasury. Well for better sight of the real drawdowns I've modified the Y axis to be log scaled in this next chart
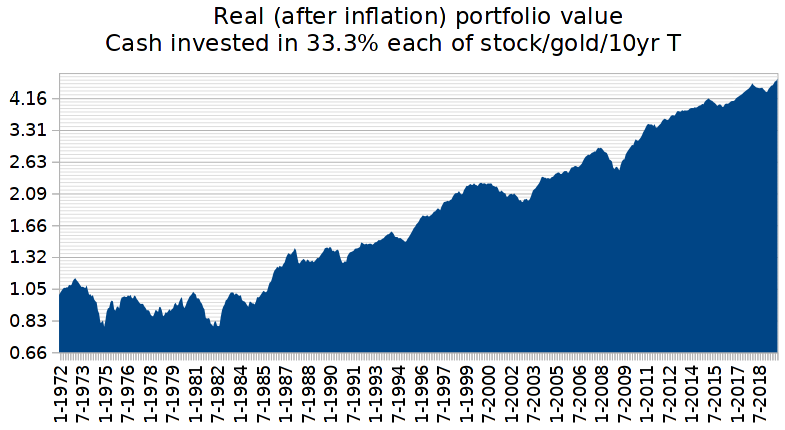
That ended with a portfolio value of over $3 million, achieved a 7.41% annualised gain after the 4% SWR and averaged 36% average stock exposure.
However, it should also be noted that 'cash' alone, when invested as a three way equal split of stock/gold/cash, achieved comparable results to 50/50 AIM when that AIM was using that for cash also
Some hate gold, often saying its a non productive asset, however its stock purchase power is very volatile and if you trade that, even via simple yearly rebalancing, including gold can reap dividends.
https://tinyurl.com/ta98uxo
UK data and for the 1990's gold looked like a bad asset to hold, the price during the 1990’s declined from £247.70/ounce to £179.60/ounce over the decade (Jan 1990 to Dec 1999), it lost 27.5% of its value. A equal stock/gold/bond portfolio of £74,310 value started that decade with 100 ounces of gold with a £24,770 value, but ended the decade with £48,671 value of gold and 271 ounces. The number of ounces being stored expanded at a annualised rate of 10.5%/year. Simply yearly rebalancing between the assets had gold in effect provide great 'dividends'. And typically out of stocks/gold/bonds one of the three will typically do well each year, and where the average of the yearly best asset more than offsets the average of the yearly worst asset. The following is a basic Callan periodic table that ranks each years best to worst assets, and where I've averaged that both by decade and vertically (vertical average indicates the years total gain, horizontal average indicates the average of the yearly best through worst asset gains/losses). FT250 in this table are 'stock' (UK FTSE 250 mid cap stock index).
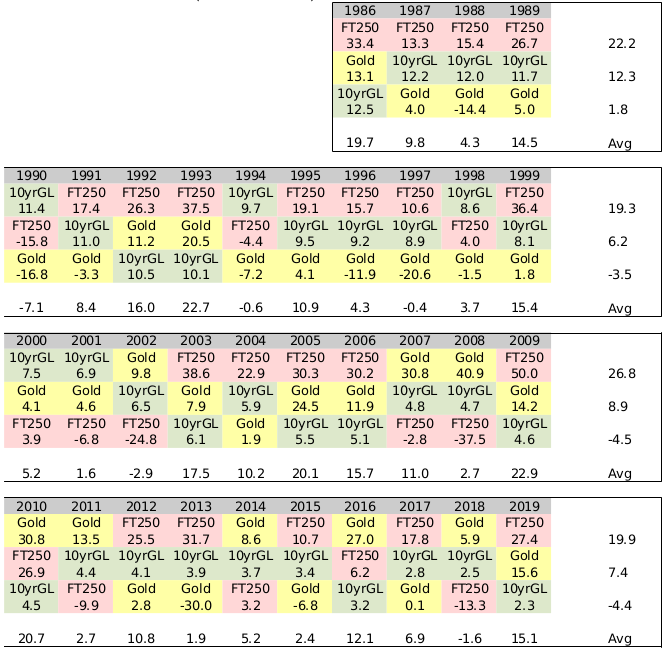
With these sorts of averages of a third weighted exposure to each of ...
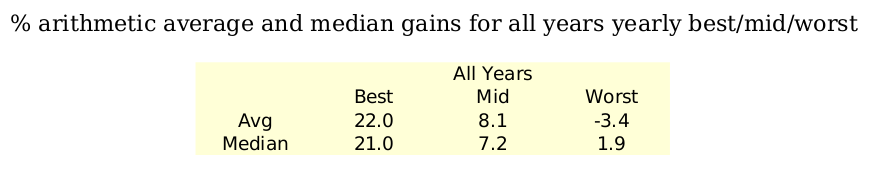
what the actual assets are in providing such rewards is pretty much irrelevant. The winning (best) third on average counters and more the worst third, to leave a overall reasonable outcome. That blend of assets is also resilient against prolonged downside risk. In good times stocks may do well. In times of fear investors might flock to cash (bonds), in times of geopolitical/economic risk/fears investors might flight to gold. Trading those fluctuations (via simple yearly rebalancing) can yield a overall 'satisfactory' outcome. Broadly, this current year I might anticipate one asset perhaps providing a +20% gain, another losing perhaps -3.5% and the third perhaps providing a +8% reward. No idea which assets will provide those rewards, and the figures are in themselves volatile - but good enough that I'll likely be able to profit take out of one asset as well as using some of the proceeds to top-up the poorer performing asset. Maybe also putting some additional aside (into cash), as reserves just in case the next year doesn't span out as hoped.
For me, I no longer really require AIM. It is a great tutor however in steering you towards adding/reducing at appropriate times, a foundation 'skill' that will serve you well. Best however to not become too absorbed by the mechanics of AIM and lose focus on the overall picture/objective of completing the intended journey.
Clive.
Using Portfoliovisualizer.com (US data/inflation ..etc.), plugging in a 4% SWR ...

for both all stock and 50/50 stock/bonds

since 1972 (furthest back the data goes) and up to September 2019 (data for which the AIM I formed also runs to), and the 50/50 ultimately failed

For AIM, started with 50/50 cash/stock, dividends reinvested and 10 year Treasury ladder for 'cash'

For that particular sequence of returns and inflation 50/50 initial stock/cash was the more appropriate choice as % stock relatively quickly rose towards 90% levels (which infers 10% cash levels)

As a conventional yearly rebalanced 50/50 stock/bonds failed when a 4% SWR was used, let's instead look at how 100% stock with a 4% SWR, that survived, compared to 50/50 AIM that also had a 4% SWR applied. Buy and Hold (all stock) ended with a $709,437 final portfolio value (4.19% annualised) from a initial $100,000 start date amount. AIM however had a $1,304,108 final value (averaged 57% stock over the 48 year period, yielding a 5.5% annualised gain after the 4% SWR rate (SWR value at the end date was around the equivalent of 2% of the portfolio value)).
And that was all standard AIM, no Vealies or aligning to the vwave ..etc.
The critical factor here was that there was high levels of inflation in earlier years.
Looked at from a pure accumulation angle and buy and hold achieved a 7.39% annualised price appreciation supplemented with a 2.84% average dividend over a period when inflation annualised 3.92%. So of the order of a 10.23% annualised total return (simply summing the price appreciation with the average dividend). AIM achieved a 5.5% annualised gain after discounting a 4% SWR rate (combined 9.5%) but did so with 57% average stock exposure. In fairness however whilst staring with a 4% SWR value, AIM ended with the SWR value being less than 2% of the final portfolio value, so you might average those two and assume around a 3% average of portfolio value SWR value over the total period, which pulls down the AIM total return to 5.5% price appreciation benefit + 3% average SWR value (combined 8.5%). So from that angle it looks like AIM's total reward of around 8.5% was worse than buy and hold, however when we look at how buy and hold compared when a 4% SWR was also applied, then AIM had a higher end date portfolio value than buy and hold. $1,304,108 final value for AIM, $709,437 for buy and hold ($0 for 50/50 yearly rebalanced i.e. that failed).
What if we change AIM cash to be a equal split blend of stock/gold/10 year Treasury. Well for better sight of the real drawdowns I've modified the Y axis to be log scaled in this next chart

That ended with a portfolio value of over $3 million, achieved a 7.41% annualised gain after the 4% SWR and averaged 36% average stock exposure.
However, it should also be noted that 'cash' alone, when invested as a three way equal split of stock/gold/cash, achieved comparable results to 50/50 AIM when that AIM was using that for cash also

Some hate gold, often saying its a non productive asset, however its stock purchase power is very volatile and if you trade that, even via simple yearly rebalancing, including gold can reap dividends.
https://tinyurl.com/ta98uxo
UK data and for the 1990's gold looked like a bad asset to hold, the price during the 1990’s declined from £247.70/ounce to £179.60/ounce over the decade (Jan 1990 to Dec 1999), it lost 27.5% of its value. A equal stock/gold/bond portfolio of £74,310 value started that decade with 100 ounces of gold with a £24,770 value, but ended the decade with £48,671 value of gold and 271 ounces. The number of ounces being stored expanded at a annualised rate of 10.5%/year. Simply yearly rebalancing between the assets had gold in effect provide great 'dividends'. And typically out of stocks/gold/bonds one of the three will typically do well each year, and where the average of the yearly best asset more than offsets the average of the yearly worst asset. The following is a basic Callan periodic table that ranks each years best to worst assets, and where I've averaged that both by decade and vertically (vertical average indicates the years total gain, horizontal average indicates the average of the yearly best through worst asset gains/losses). FT250 in this table are 'stock' (UK FTSE 250 mid cap stock index).

With these sorts of averages of a third weighted exposure to each of ...

what the actual assets are in providing such rewards is pretty much irrelevant. The winning (best) third on average counters and more the worst third, to leave a overall reasonable outcome. That blend of assets is also resilient against prolonged downside risk. In good times stocks may do well. In times of fear investors might flock to cash (bonds), in times of geopolitical/economic risk/fears investors might flight to gold. Trading those fluctuations (via simple yearly rebalancing) can yield a overall 'satisfactory' outcome. Broadly, this current year I might anticipate one asset perhaps providing a +20% gain, another losing perhaps -3.5% and the third perhaps providing a +8% reward. No idea which assets will provide those rewards, and the figures are in themselves volatile - but good enough that I'll likely be able to profit take out of one asset as well as using some of the proceeds to top-up the poorer performing asset. Maybe also putting some additional aside (into cash), as reserves just in case the next year doesn't span out as hoped.
For me, I no longer really require AIM. It is a great tutor however in steering you towards adding/reducing at appropriate times, a foundation 'skill' that will serve you well. Best however to not become too absorbed by the mechanics of AIM and lose focus on the overall picture/objective of completing the intended journey.
Clive.

Join the InvestorsHub Community
Register for free to join our community of investors and share your ideas. You will also get access to streaming quotes, interactive charts, trades, portfolio, live options flow and more tools.

