 News
News  Market Data
  Discover
Support: 888-992-3836
Copyright © 2023 InvestorsHub Inc.


Seek ye the Lord while he may be found, call ye upon him while he is near Isaiah 55:6KJV
StkMktPirate
![]()
Seek ye the Lord while he may be found, call ye upon him while he is near Isaiah 55:6KJV
Register for free to join our community of investors and share your ideas. You will also get access to streaming quotes, interactive charts, trades, portfolio, live options flow and more tools.
Register for free to join our community of investors and share your ideas. You will also get access to streaming quotes, interactive charts, trades, portfolio, live options flow and more tools.
Seek ye the Lord while he may be found, call ye upon him while he is near Isaiah 55:6KJV
Good Stuff, Thanks!
JER1
Good Stuff Thanks!
JER1
Thanks! I'm always checking in just been a little busy to post much lately. Looking good over here as always.
JER1
Little Action today
JER1
Agree & welcome to the board
JER1
What's up bud nice to see you around again
JER1
Welcome As MOD, Caledonia Mining Corporation CALVF
JER1
Hey Thanks NYBOB! Great Posts as always!
JER1
Last chance diplomatic talks start with Iran this weekend as US aircraft carriers arrive in the region
Diplomatic talks billed by President Obama as the ‘last chance’ for a settlement of the dispute between the international community and Iran over its nuclear program will start this weekend, while at the same time the US navy is flagging the arrival of its longest vessel the USS Abraham Lincoln in the Gulf of Aden, the second giant US aircraft carrier now stationed in the region.
Under severe pressure from economic sanctions from America, Australia and the European Union, Iran has agreed to resume talks. But Iran has angrily rejected as pre-conditions a statement of steps that the international community now requires before it will consider lifting sanctions.
Talk pre-conditions
According to The Daily Telegraph today these demands include closure of the Fordow nuclear facility, a halt to the production of near weapons-grade uranium and the shipping abroad of all nuclear fuel enriched to this level.
The subtext is clearly that if no agreement can be reached then military action will follow, one way or another. Forbes magazine and other right-wing commentators are expecting a military strike to come from Israel this summer.
The current edition of the ArabianMoney newsletter discusses in depth the investment implications as distinct from the politics and economics of this issue which are fully discussed in other media
Market reaction
We envisage a spike in oil prices that would be very damaging for global financial markets, whatever is done with strategic reserves to cope with the situation, and much higher precious metal prices.
There would also be a panic out of GCC equities in response though ArabianMoney sees this as a buying opportunity because the dangers in war scenarios are always greatly exaggerated. We recall the market low that preceeded the invasion of Iraq in March 2003 while nothing actually subsequently happened in the Gulf States.
It could be different this time but we think Iran would direct its response back at the source it came from rather than look for targets elsewhere that have a formidable capacity to strike back.
Still investment at wartime lows is only for the bravest long-term investor and the more obvious panic reaction is to be expected from most people.
Silver's Trend and the Death of Technical Analysis
The death of technical analysis has arrived. What took place in the markets (especially in the precious metals) on April 3rd & 4th proves this in spades. There were several calls made prior to the takedown, by some very well known individuals in the precious metal field, that became NULL & VOID when either bottoms or chart patterns failed.?
I am not going to name names, but I would imagine those who have been following the gold and silver markets for quite some time, know who I am talking about. That being said, I don’t blame them one bit. Trying to make short term calls based on technical analysis presently has become nearly impossible when the markets are constantly manipulated. I think it is time that we all just realize a monkey throwing a dart at a trend line on a wall is just as useful as short term technical analysis.
There are only a few technical analysts that I respect. They gain my favor due to the fact that they use technical analysis to forecast future inflationary trends. Those who are still predicting deflation in their charts may need to find other employment as their calls have been wrong time and time again.
Furthermore, I am completely surprised by the psychotic nature of the so-called RISK ON & RISK OFF TRADE. Doesn’t anyone take the time to stand back for a minute and just look at what is going on? Does anyone see the insanity of it all? It is simply amazing to watch grown adults place bets one day, and then take them back the next – a trend which occurs over and over again.
I decided to take a stab at my own version of technical analysis as it pertains to the silver market between April 2nd and April 4th.

If we follow the numbers, we can get a clear picture of what took place in the price of silver over the past three days. In number 1, we see the typical RISK ON – RISK OFF trade. This is shown in the SAD FACE PATTERN. On April 2nd, after silver added $0.70, the line of resistance occurs at the bottom of the EAR LINE LEVEL (number 2). Following the FOMC meeting which occurred the very next day, the market responded appropriately by taking back all bets knocking the price of silver back down to the very same level it was the day before… this is shown in number 1 & 3.
Once trading commenced during our favorite early London Markets, the Neck Line was broken and the price of silver dropped all the way down to the BELLY-BUTTON SUPPORT LINE. This can be found looking at the number 4 chart description. We are going to have to wait and see if this support line is broken in the next several days. If so, the next line of support will be at the BELT LINE and below that is the next support level at the KNEE LINE.
If the price of silver can rally from here, the first line of resistance will be the NECK LINE followed by the BOTTOM EAR LINE. If we can take out both of these levels, there is no resistance until we reach the top of where the BASEBALL CAP LINE would be.
All kidding aside, I do believe it’s time for the precious metals community to move their focus away from short term technical analysis and to concentrate on fundamentals and long term trends instead. (The chart above was courtesy of Kitco.com with my added comments)
SILVER’S TEN YEAR TREND
Even though I believe the price of silver will trend much higher over the next several years, these short-term manipulated market corrections can still be quite frustrating. After reading a great deal of frustrated investors on several internet blogs, I decided to put together a 10 Year Silver Trend Chart. While it is true I find very little benefit in short term technical analysis, I do see a great deal of merit in charting long term trends.
If we remove all the volatility and focus only on the annual average price of silver, we can see that the overall trend is still quite positive. Not only is the trend positive, but it is starting to head into an exponential trajectory

The average annual silver price is shown by the light blue line. The average price of silver in 2012 is currently $32.63 which is lower than 2011 when it hit $35.12. It is difficult to make a forecast on where the average price of silver will be in 2012, but we still have almost nine months remaining in the year to find out. If we do get an “Official Announcement of QE 3” shortly, silver should have no problem taking out the previous year’s average price. I did say “Official”, as QE has not stopped regardless of what MSM regurgitates on a daily basis.
The white dashed line is a polynomial trend based on silver’s annual average price line. This polynomial trend removes even more volatility to give the reader a clearer picture of where silver is heading. Both of these lines are superimposed over the M1 & M2 money supply chart areas. In 2002, the M1 money supply was $1,197 billion and the M2 money supply was $5,587 billion. Today the M1 money supply has grown to $2,208 and M2 is now $9,788. The price of silver is moving higher along with the increase of both M1 and M2 money supply. There is a clear distinction between the two – while the money supply is heading up in a linear fashion; the price of silver is now heading into an exponential trend. I would imagine we would be witnessing a steeper exponential chart pattern if it weren’t for the past 6-8 month BUSHWACK & HAMMER TRADE mastered by the wonderful folks in Wall Street and at the FED.
CRITICAL FACTORS THAT WILL IMPACT SILVER
I did not plan on writing this article as I am currently working on two that will be out shortly. The first one will be titled Critical Factors That Will Impact Silver
I will be discussing several important areas that will impact the price of silver as well as its future supply. There will be several charts and graphs that compare how the money supply during the 1930’s depression impacted silver much like it has today.
There will also be an update on the top three silver miners in 2011 along with some very interesting surprises. I will be publishing this article before the Silver Institute puts out their 2011 World Silver Survey on April 19.
For example, silver production at the Fresnillo mine (Mexico’s largest primary silver mine) declined a whopping 15.5% in 2011 due to falling ore grades. Fresnillo has increased its diesel consumption to bring more gold and silver production to the market. Without growing supplies of diesel in the future, the mining industry hits a brick wall. This will be discussed in greater detail in the following article that focuses on diesel consumption in the top 5 gold mining companies as well as copper industry.
http://www.wealthwire.com/news/metals/2971
Silver's Trend and the Death of Technical Analysis
The death of technical analysis has arrived. What took place in the markets (especially in the precious metals) on April 3rd & 4th proves this in spades. There were several calls made prior to the takedown, by some very well known individuals in the precious metal field, that became NULL & VOID when either bottoms or chart patterns failed.?
I am not going to name names, but I would imagine those who have been following the gold and silver markets for quite some time, know who I am talking about. That being said, I don’t blame them one bit. Trying to make short term calls based on technical analysis presently has become nearly impossible when the markets are constantly manipulated. I think it is time that we all just realize a monkey throwing a dart at a trend line on a wall is just as useful as short term technical analysis.
There are only a few technical analysts that I respect. They gain my favor due to the fact that they use technical analysis to forecast future inflationary trends. Those who are still predicting deflation in their charts may need to find other employment as their calls have been wrong time and time again.
Furthermore, I am completely surprised by the psychotic nature of the so-called RISK ON & RISK OFF TRADE. Doesn’t anyone take the time to stand back for a minute and just look at what is going on? Does anyone see the insanity of it all? It is simply amazing to watch grown adults place bets one day, and then take them back the next – a trend which occurs over and over again.
I decided to take a stab at my own version of technical analysis as it pertains to the silver market between April 2nd and April 4th.
If we follow the numbers, we can get a clear picture of what took place in the price of silver over the past three days. In number 1, we see the typical RISK ON – RISK OFF trade. This is shown in the SAD FACE PATTERN. On April 2nd, after silver added $0.70, the line of resistance occurs at the bottom of the EAR LINE LEVEL (number 2). Following the FOMC meeting which occurred the very next day, the market responded appropriately by taking back all bets knocking the price of silver back down to the very same level it was the day before… this is shown in number 1 & 3.
Once trading commenced during our favorite early London Markets, the Neck Line was broken and the price of silver dropped all the way down to the BELLY-BUTTON SUPPORT LINE. This can be found looking at the number 4 chart description. We are going to have to wait and see if this support line is broken in the next several days. If so, the next line of support will be at the BELT LINE and below that is the next support level at the KNEE LINE.
If the price of silver can rally from here, the first line of resistance will be the NECK LINE followed by the BOTTOM EAR LINE. If we can take out both of these levels, there is no resistance until we reach the top of where the BASEBALL CAP LINE would be.
All kidding aside, I do believe it’s time for the precious metals community to move their focus away from short term technical analysis and to concentrate on fundamentals and long term trends instead. (The chart above was courtesy of Kitco.com with my added comments)
SILVER’S TEN YEAR TREND
Even though I believe the price of silver will trend much higher over the next several years, these short-term manipulated market corrections can still be quite frustrating. After reading a great deal of frustrated investors on several internet blogs, I decided to put together a 10 Year Silver Trend Chart. While it is true I find very little benefit in short term technical analysis, I do see a great deal of merit in charting long term trends.
If we remove all the volatility and focus only on the annual average price of silver, we can see that the overall trend is still quite positive. Not only is the trend positive, but it is starting to head into an exponential trajectory
The average annual silver price is shown by the light blue line. The average price of silver in 2012 is currently $32.63 which is lower than 2011 when it hit $35.12. It is difficult to make a forecast on where the average price of silver will be in 2012, but we still have almost nine months remaining in the year to find out. If we do get an “Official Announcement of QE 3” shortly, silver should have no problem taking out the previous year’s average price. I did say “Official”, as QE has not stopped regardless of what MSM regurgitates on a daily basis.
The white dashed line is a polynomial trend based on silver’s annual average price line. This polynomial trend removes even more volatility to give the reader a clearer picture of where silver is heading. Both of these lines are superimposed over the M1 & M2 money supply chart areas. In 2002, the M1 money supply was $1,197 billion and the M2 money supply was $5,587 billion. Today the M1 money supply has grown to $2,208 and M2 is now $9,788. The price of silver is moving higher along with the increase of both M1 and M2 money supply. There is a clear distinction between the two – while the money supply is heading up in a linear fashion; the price of silver is now heading into an exponential trend. I would imagine we would be witnessing a steeper exponential chart pattern if it weren’t for the past 6-8 month BUSHWACK & HAMMER TRADE mastered by the wonderful folks in Wall Street and at the FED.
CRITICAL FACTORS THAT WILL IMPACT SILVER
I did not plan on writing this article as I am currently working on two that will be out shortly. The first one will be titled Critical Factors That Will Impact Silver
I will be discussing several important areas that will impact the price of silver as well as its future supply. There will be several charts and graphs that compare how the money supply during the 1930’s depression impacted silver much like it has today.
There will also be an update on the top three silver miners in 2011 along with some very interesting surprises. I will be publishing this article before the Silver Institute puts out their 2011 World Silver Survey on April 19.
For example, silver production at the Fresnillo mine (Mexico’s largest primary silver mine) declined a whopping 15.5% in 2011 due to falling ore grades. Fresnillo has increased its diesel consumption to bring more gold and silver production to the market. Without growing supplies of diesel in the future, the mining industry hits a brick wall. This will be discussed in greater detail in the following article that focuses on diesel consumption in the top 5 gold mining companies as well as copper industry.
http://www.wealthwire.com/news/metals/2971
Inflation: It's Whats For Dinner
February 2011 looked to be the turning point for world policy makers. Back a little over a year ago, world food prices hit record highs and raging protests connected to the Arab Spring created a wave of civil unrest in the Middle East and north Africa.
The price of food later receded, but since of the start of 2012 food prices have begun ascending. The prices initially were seen as a pause in the overall downtrend, but after three months into the new year, the figures are persistent.
World food prices are likely to rise for a third successive month and could grow further beyond that. Expensive oil and chronically low stocks of some key grains have put food inflation on the minds of every economy around the globe.
From Reuters,
The United Nations Food and Agriculture Organisation (FAO) will update its monthly Food Price Index on Thursday and the organisation says prices could rise more in the short and medium term as grain supply tightens and energy prices stay high.
“You can see prices in the near term rising even further,” FAO's senior economist and grain analyst Abdolreza Abbassian.
The FAO index is what measures price changes for a basket of cereals, oilseeds, dairy products, meat and sugar. That index rose from February and January.
So what is contributing to these rising prices? For one, high crude oil prices have pushed the food inflation up since January. Consumer prices were up 2.6% in March from a year ago, in the 17 nations within the euro zone.
Energy prices have a strong affect on food prices as well, as they affect the production of fertilizers and costs related to food distribution and farm machinery use.
“The food price index has an extremely high correlation to oil prices and with oil prices up it's going to be difficult for food prices not to follow suit,” says commodity analyst Nick Higgins of Rabobank International.
Last week concerns about global grain supplies fueled a rally in the U.S. and European grain futures, all based off of a U.S. government report that showed lower than expected estimates of grain stocks. The report also showed a dip in soybean and wheat plantings.
The two major drivers of world grain markets at the moment will be corn and soybeans as the waiting game for new crops are harvested with strong prices swings caused by weather changes in major producing countries.
In March, U.S. soybean futures rose about 7% and gained around 17% in the first quarter of this year. The reason for the gains was based off of concerns about tight supplies as South America was hit with a drought and U.S. plantings were much smaller than expected.
The FAO believes prices could still fall in the second half of this year. With new crops, market tension could easy and drive full-year average prices below record levels of 2011. But that is only speculative. Right now it looks as though we're headed for a fourth consecutive month of higher food prices.
The Coming Paradigm Shift in Silver
The biggest problem for investors today in trying to forecast the future price of silver is the enormous amount of contradictory analysis on the Internet. There are bulls, bears, paper traders, physical buyers, technical analysts, hedge funds, commercial banks and silver manufacturers all trying to play a part in this highly volatile silver market. Trying to sift through the huge volumes of silver analysis on the internet can be extremely frustrating. In addition, some of this information is not meant to inform, but rather to confuse or mislead the investor.
There is a great deal of misinformation on the internet when it comes to silver. I find it ironic that one of the so-called “bullion specialists” seems to give bearish commentary whenever the price of gold or silver rises to new highs. This is akin to a CEO of a corporation telling the media and shareholders that the company’s stock price is too high and needs to drop down to more sustainable levels. What CEO on Earth would say something as stupid as this with the best interest of the company and shareholders in mind? Furthermore, how many CEOs would keep their job if they repeated this over and over for the past several years, and got it wrong time and time again?
Unless you have been in the precious metals markets for quite some time, it is easy to be misled by this type of information. This is the very reason behind the motivation that I had to write this article. In it, I will attempt to give the reader-investor a more detailed and fundamental comparative analysis of the future price of silver, rather than the typical fly-by-night technical charting or bull-bear rant. This should give a more commonsense methodology in forecasting the future path of silver and its eventual paradigm shift.
Paradigm Shift: —n, a radical change in underlying beliefs or theory
The coming paradigm shift in silver will not happen due to technical analysis, fundamentals, or supply & demand forces, but rather due to a change in mass psychology of investors. Even though fundamentals and supply-demand forces will play a part in this shift, they will not be the ultimate cause. I believe technical analysis as it is used today, only charts the amount of manipulation and mass psychology in the silver market.
Throughout history, a paradigm shift occurs in rigged markets when the manipulation of the financial system and economy is no longer sustainable. This occurred in the banking and housing markets in 2007-2008 when we had what I call a “Negative Paradigm Price Shift”— a trend where prices or values are declining.
Negative Paradigm Price Shift in Housing and Banking
Prior to 2007, the real estate market was kept alive by the work of clowns and magicians in the mortgage industry and banking system. For several years everyone was having a great time. As housing prices and sales continued towards the heavens, bank profits hit all-time records. Everything was going along just fine until the market realized one day that there was nothing left after “Liars Loans” were levied to keep the Ponzi going. Once the housing market collapsed, so too did the banking system. Like two twins attached at birth, one could not live without the other.
In true waterfall fashion, investment banks, commercial banks, government-sponsored entities and insurance companies went bankrupt, were either taken over or became a mere shadow of their former selves.
Here we can see several examples of a Negative Paradigm Shift


As you can see from these 10-year charts, the prices of these stocks were range bound prior to 2007. All of a sudden, in the middle of 2007, the bottom fell out and the prices of these stocks suffered exponential losses. Other examples of companies that have experienced similar Negative Paradigm Shifts include Lehman Brothers, Bear Stearns, Merrill Lynch, Washington Mutual and Freddie Mac.
How could all of these institutions collapse in this fashion? It was due to policy deregulation as well as the manipulation of financial products, assets and information. Thus, the banking system and these institutions were functioning and supposedly solvent a great deal longer than a free market would have allowed. The act of misleading the market gave false values and elevated stock prices.
This is a perfect example of the mass psychology of the public investing in highly inflated assets based on superficial and bogus technical analysis. As the housing and financial markets were reaching their peak in the 2007, fundamentals played no part in their real market values— it was based entirely on mass psychology instead; the false belief projected by investors and the corporations themselves that these companies were actually of high value.
This disintegration of the housing market and banking system was not an isolated episode; rather it was part of the events that take place in STAGE 1 of what Dmitry Orlov calls the Five Stages of Collapse.
¦ Stage 1: Financial Collapse
¦ Stage 2: Commercial Collapse
¦ Stage 3: Political Collapse
¦ Stage 4: Social Collapse
¦ Stage 5: Cultural Collapse
According to Orlov:
STAGE 1: Financial collapse.Faith in "business as usual" is lost. The future is no longer assumed resemble the past in any way that allows risk to be assessed and financial assets to be guaranteed. Financial institutions become insolvent; savings are wiped out, and access to capital is lost.
Here we can see that the majority of these conditions in the Financial Collapse have already taken place. The only reason why the U.S. banking system is still functioning today is due to the ability of banks to mark to model their assets giving the impression that they are still solvent. Furthermore, the increased guarantee of FDIC deposit accounts to $250,000 as well as a temporary unlimited coverage for noninterest-bearing transaction accounts until Dec 31, 2012 have kept a major bank run on the banking system. These changes of policy have postponed the United States from entering into STAGE 2 or the Commercial Collapse. This will be discussed at the latter part of the article.
If this wasn’t bad enough, the current U.S. banking system is based on a fractional reserve requirement of 10% in fiat money; basically paper backing paper. This wasn’t always the case. To get a better idea of how disastrous the present banking system has become, we need to take a look at fractional reserve requirements of the past.
From an Historic Gold-Backed Fractional Reserve System to a Paper Farce Today
Eric Sprott made a recent comment posted in an article on Zerohedge.com, stating that “The financial system is a farce” . He couldn’t be more correct in his assumption. Not only is the present U.S. banking system based on a financial debt instrument called a Federal Reserve Note, but its fractional reserve ratio is virtually nonexistent.
In 1932, the United States had a fractional reserve banking system backed by gold. The member banks had different reserve requirements: central reserve city banks (13 percent), reserve banks (10 percent) and country banks (7 percent). All member banks had a 3 percent reserve requirement on time deposits. Even with these official reserve ratios, the total paper dollar claims to gold were much higher. For this analysis, we are going to compare the M2 money supply to the amount of U.S. Treasury-held gold.

In 1932, the U.S. Treasury held $2.95 billion in gold, there was $5.60 billion in currency in circulation, $36 billion in M2 money supply, and $19 billion in U.S. Treasury debt. The fractional reserve of gold to the M2 money supply was 8.3%.
Despite the terrible conditions during the “Great Depression”, at least the country had two positive factors going for it: 1) A banking system backed by gold and 2) vast resources of energy, metals and minerals to tap into to pull itself out of its current market ills.
Today, the banking system is on the verge of collapse and the country has consumed its best resources which peaked 40-50 years ago. After Nixon dropped the dollar peg to gold in 1971, the world has been on a floating exchange rate fiat monetary system. The present fractional reserve banking system we have today is based on a fiat paper reserve.

This graph shows that no gold whatsoever is backing up the banking system. As the U.S. banking system stands today, its currency— the Federal Reserve Note— is backed by $15.2 trillion worth of U.S. Treasury debt. The system is even weaker when we look into the makeup of the banks’ fractional reserve ratio.
For starters, the official 10% minimum reserve requirement set by the Board of Governors at the Federal Reserve applies to mainly checking accounts. Effective December 27, 1990, CD’s, savings accounts, and timed deposits owned by entities other than households were not included in this 10% reserve requirement. Additionally, in 1994 the Federal Reserve Board passed a “Deposit Reclassification” for financial institutions to help lower reserve requirements even further. Eric DeCarbonnel explains this in his article “US Banks Operating without Reserve Requirements”:
Deposit reclassification is an accounting trick, used by virtually the entire financial sector, which allows banks to eliminate nearly all their reserve requirements. Deposit Reclassification splits a checking account into two separate subaccounts, a transaction (checking) subaccount and a non-transaction (savings) subaccount. This distinction only exists on the bank's books: you will never see these subaccounts on your bank statements.
Deposit reclassification means that, at any point in time, most of the money in American checking accounts sits in invisible savings subaccounts. These savings subaccounts pay no interest, but allow banks to avoid reserve requirements. The public is completely unaware of this financial engineering
It is now apparent that the so-called official 10% fractional reserve ratio of the U.S. banking system is just a mere figure to delude the public into believing it has a working cash reserve ratio, whereas in reality, the system is a complete farce.
The public has no clue just how weak and vulnerable the U.S. banking system has become. At one time, the United States had a fractional reserve banking system backed by physical gold money. Today, its financial system is entirely based on a fiat monetary regime with practically no fractional reserve ratio whatsoever.
Gold & Silver Money Contain Intrinsic Value; Federal Reserve Notes Have None
Not only is the majority of the public ignorant to the amount of dangerous leverage in the U.S. banking system, most have no understanding of real money. I have had several debates on various websites with highly educated individuals on the subject. Some have replied by stating, “The U.S. Dollar is backed by the GDP of the country”, while others have insisted that, “Gold & silver have no intrinsic value whatsoever.” It is no wonder this country is heading full speed over the cliff.
In historic times, the value of gold and silver was tied to their rarity as well as the amount of labor needed in extracting and producing the metals. As time went by, capital became a larger percentage of this value while human labor was replaced by energy-consuming machinery. Each gold and silver coin produced today contains a certain amount of this capital investment, energy and labor cost. Thus, these precious metal coins do hold a certain amount of intrinsic value.
On the other hand, a Federal Reserve Note today has no intrinsic value at all— except for its printing cost. It is only a PROMISE TO PAY. The Federal Reserve Note is not redeemable by gold, but Uncle Sam will give you some of its $15.2 Trillion of U.S. Treasury debt in exchange. It is due to this very reason why we see an increasing amount of Americans buying Gold and Silver Eagles.
The U.S. Mint does not provide the public with annual records of exact dollar sales of their Gold and Silver Eagles. To get the figures below, the annual sales of silver and gold eagles were multiplied by their respective average yearly price reported by Kitco.com.

In times of worry in the financial system, the public regains confidence through buying gold and silver assets. During the Y2K scare, we can see that Americans were putting a great deal more money in Gold Eagles over Silver Eagles. In 1999 the public was buying 12 times the amount of money in gold than silver. Today, we see that investors are spending almost the same amount of money in both precious metals.
The graph above only reveals part of the story. According to kitco.com, the average price of silver in 2011 was $35.11 and the average price of gold was $1571.52. This gives us a gold-silver ratio in 2011 of 45 to 1. If we look at the next graph below we can see just how much more Silver Eagles over Gold Eagles the public is buying.

It is hard to tell from the graph above, but Gold Eagle sales have increased tremendously since 2007. Here are the exact figures for both:

During the Y2K scare in 1999, Americans bought a record 2 million ounces of Gold Eagles and only 9 million ounces of Silver Eagles. This was at ratio of 4.4 to 1. In 2011, the ratio increased nearly 10 times as investors bought almost 40 million Silver Eagles while only purchasing 1 million in Gold Eagle ounces.
Very few individuals have comprehended the amazing trend taking place in the Gold and Silver Eagle’s market. In 1999, Gold Eagle sales hit a record of 2 million ounces. Last year, investors only bought half that amount. However, Silver Eagle sales have increased more than fourfold from nine million oz in 1999 to nearly 40 million ounces in 2011.
Even though these two graphs give overwhelming evidence on how much more investors are buying Silver Eagles over Gold Eagles, it is only part of the story.
Comparing U.S. Domestic Gold-Silver Production vs. Gold-Silver Sales
In my previous article, First Time Ever, Silver Sales Surpass Domestic Production, I explain how Silver Eagle sales are forecasted to be higher than the total 2011 U.S. domestic silver production output (full data on U.S. silver mine production will not be out until April-May of 2012). This is a graph from the article that shows Silver Eagle sales will be approximately 5 million oz greater than U.S. domestic silver production:

While it is true that the U.S. imports silver to meet its industrial and investment demands, this amount was two and a half times its 2010 mine production. According to the USGS 2011 Silver Mineral Summary, the United States had a net import of 3,240 metric tons of silver in 2010. Compare that to its mine production of only 1,280 metric tonnes the very same year.
On the other hand, if we look at the USGS 2011 Gold Mineral Summary, the United States had a net import of 160 metric tonnes of gold in 2010 while its domestic mine production was 230 metric tonnes. Here we can see that the U.S. gold mines produce one and a half times more gold than it imports from foreign sources.
In 2011, the United States is estimated to produce roughly 7.5 million oz of gold (233 metric tonnes) along with one million oz of Gold Eagle Sales:

Looking at these two graphs the difference becomes extremely obvious. Silver Eagle sales consumed 114% of U.S. domestic silver production in 2011, whereas Gold Eagle sales accounted for only 13.5% of domestic gold production.
The public is beginning to understand that silver offers a much more affordable way to protect one’s wealth than gold. This realization has now taken a bigger bite out of the U.S. domestic silver production pie than is available. Even though the United States can import silver presently to supply its investment and industrial demand, this situation will change when the U.S. economy enters into STAGE 2 of the collapse
When Will the Paradigm Shift in Silver Occur?
For the most part, Americans are completely oblivious of just how close the country is to a total disintegration of its fiat monetary system. As I mentioned in the beginning of the article, the United States financial system died in 2008. It has been kept alive by policy deregulation, monetary printing, and market manipulation (including derivative manufacturing such as interest rate swaps). These collaborative short term machinations have a lifespan that is diminishing every passing day, while investors who have made the wise decision to exchange fiat money for gold and silver keep wondering how long this manipulation can continue.
I remember watching Peter Schiff on CNBC and Fox Business between the years of 2005-2007 debating about the upcoming collapse of the mortgage and housing markets. On several occasions, Schiff was the laughing stock on the set as anchors and other guests thought he was simply crazy in his forecasts. By 2008, the laughs had stopped while the country watched as the U.S. housing values began their rapid decline that would eventually surpass the disastrous records set during the 1930’s Great Depression.
The answer I give to individuals and investors who ask me the question “when will the manipulation end?” is that it will end when the U.S. enters into STAGE 2 or the Commercial Collapse.
Again, according to Orlov:
Stage 2: Commercial collapse. Faith that "the market shall provide" is lost. Money is devalued and/or becomes scarce, commodities are hoarded, import and retail chains break down, and widespread shortages of survival necessities become the norm.
Despite the forecasts of many analysts of what the U.S. Dollar index or government deficits will look like in the next decade, the U.S. economy will enter into STAGE 2 more likely than not in the next few years. The commercial collapse as described by Orlov is when the whole country will feel the impact of the ongoing economic disintegration.
This article is long enough and does not have time to go into the three other stages of collapse described by Orlov. It is recommended that the reader go to the link provided at the beginning of the article to get additional information on the five stages of collapse.
Briefly, Orlov witnessed firsthand the collapse of the Soviet Union in 1989 and then wrote a book titled Reinventing Collapse: The Soviet Example and American Prospects describing these different stages. According to Orlov, a country does not have to systematically go through all five stages of collapse. But when the financial collapse occurs, the commercial collapse is sure to follow. With all things considered, Orlov believes the overall conditions are far worse in the United States today than they were for the U.S.S.R in 1989.
Currently, an overwhelming majority of the public has not learned its lesson since the collapse of the banking and housing markets in 2008, as they are still heavily invested in the U.S. Treasury and retirement markets. They still cling onto the belief that their paper investment wealth will be safe and provide for them well into the future. The graph below compares the amount of precious metal investment to the total amount of money held in U.S. retirement assets.

Since the American Eagle program started in 1986, there has been roughly $13.4 billion worth of these gold and silver coins purchased. Currently, the total market value of the GLD & SLV ETF is $76 billion. Furthermore, if we assume a 1% ownership of precious metals by the investment community in the United States, taken from information provided by the CPM Gold Yearbook 2011 (based on 0.7% gold as a percent of global financial assets and adding an estimated 0.3% for silver), we would get a figure of approximately $170 billion in these assets.
The total value assigned to the GLD & SLV is given as a form of reference and not as a recommendation for investment purposes. All paper claims on gold and silver are not a guarantee of owning the actual physical metal. Some vehicles such as the PSLV and PHYS enable the investor to trade in shares for actual metal (under certain guidelines).
According to the Investment Company Institute’s third quarter news release in 2011, the total value of U.S. retirement assets was $17 trillion. The breakdown was as follows: $4.6 trillion in IRA’s, $4.3 trillion in defined benefit plans, $4.2 trillion in govt. pension plans, $2.3 trillion in private sector defined-benefit plans, and $1.6 trillion in annuities.
All retirement plans are based on a continued income stream from the market. There is really nothing backing these assets except the faith that the market will continue to grow and function providing the returns to pay its investors when they retire. However, the financial system already experienced its Negative Paradigm Shift in 2007-2008, rendering growth at its necessary rate to perpetually sustain an income stream under a fiat monetary system now impossible.
The graph above indicates the degree of mass psychology in the different investments. Presently, the overwhelming majority is invested in the $17 trillion retirement market. Unfortunately, these retirement assets will go the same way that the housing and financial markets did in 2008-2009. It is only a matter of time.
Gold has been called the “Barbarous Relic”, time and time again on CNBC and Fox Business. There is a certain amount of hubris and ego attached to our present financial house of cards— a paradigm that is coming to an end. Those who believe that gold is a barbarous relic are still drinking that barbarous water, or breathing that barbarous air, or eating that barbarous bread or still cleaning with that barbarous object called a broom. All these so-called barbarous items listed above haven’t changed much since the Roman and Medieval times.
The constant negative rhetoric of gold in the main stream media keeps the mass psychology of the public away from investing in the precious metals and into increasing worthless paper retirement assets.
The Coming Positive Paradigm Shift in Silver
As mentioned before, the paradigm shift in gold and silver will occur when the United States enters into Stage 2, the commercial collapse. This article focuses on silver due to the fact that the majority of gold that has ever been mined is still stashed away nicely in vaults across the world. However, due to silver’s dual role as an investment and industrial commodity, a large percentage of silver that has been mined has been consumed in industrial fabrication and lost forever— continuously diminishing its supply and raising its value.
When silver performs its paradigm shift, it will behave in the opposite fashion as the first three charts in this article. While AIG, Fannie Mae and Citigroup suffered negative paradigm price shifts, silver will be awarded a positive one. The graph below gives a possible REPRESENTATION OF THIS PARADIGM SHIFT. Repeat… a representation of this paradigm shift:

The $150 Free Market Price of silver was calculated by inputting the Jan. 1980 high price of silver into the inflation calculator at Shadowstats.com. I realize there will be a great deal of backlash on this $150 figure… so here is the rationale behind it:
¦ This figure was based on the “official CPI statistics”. John Williams at Shadowstats.com has an alternative SGS calculation using older inflation parameters which would make the price much higher.
¦ The manufacturing of trillions of dollars of derivatives has siphoned investment money away from physical assets such as silver, keeping their prices artificially low.
¦ The overwhelming number of paper claims (100+ to 1) on every physical ounce of silver has also sucked investment money away from the physical metal, also depressing its actual price.
Even though the last two reasons above can overlap in definition, they were separated due to the type of derivatives experienced in the market. The second reason focuses on the tremendous amount of financial derivatives such as interest rate swaps and retirement accounts. The third deals with the silver derivatives themselves— options, futures, pool accounts, silver certificates and silver ETF’s. The possible paradigm price shift of silver shown above represents a trend when the mass psychology of the market becomes increasingly aware of the true fundamentals of physical assets such as silver. The higher the price goes, the more fundamentally aware the market becomes.
The fact of the matter is that the stocks of AIG, Fannie Mae and Citigroup were garbage and worthless well before 2007. If we were to look at their charts above and draw a straight line from where their current stock prices are today and go back all away across the chart to the year 2002, we would see a fair indication of a free market value.
Yet, the majority of investors today are still suffering from the same mass psychology that kept the financial and housing markets elevated several years ago. Today, the investor’s confidence is placed firmly in the U.S. Treasury and Retirement markets. These are the two final greatest bubbles in history.
The U.S. banking system has no real fractional reserve to speak of and its monetary unit called the Federal Reserve Note is backed by $15.2 trillion in U.S. Treasury debt. The global oil supply is peaking and there will not be the available cheap energy in the future to fuel the U.S. economy to be able to pay back these debts or fulfill the obligations of the current $17 trillion retirement market.
While, the U.S. Govt. and Wall Street may be able to postpone the inevitable for a while longer by printing more dollar digits, issuing more paper treasuries and manufacturing more derivatives, these are temporary solutions. There are other alternatives that the U.S. could opt to take, such as backing the dollar with gold or erasing all the debt and starting over. Unfortunately, these are not the choices that are being considered by the leaders in government.
The paradigm shift in silver shown above is a representation of a possible trend in the future. Anything can change its outcome in time and price. That being said, when global markets cannot avoid heading into an unavoidable negative exponential trajectory as they presently are, (including the U.S. economic system) changes in price or value move up or down quickly and violently.
A change in mass psychology will play a big part in the market realization of the true fundamental price of silver. Silver will outperform gold in percentage terms as it will be more affordable to the masses. The majority of technical charting and a great deal of analysis on the internet are nothing more than white noise to confuse and frustrate.
Lastly, to all the silver investors who are purchasing physical bullion on the dips, remain patient— the silver paradigm shift is coming.
The Coming Paradigm Shift in Silver A MUST READ!!
The biggest problem for investors today in trying to forecast the future price of silver is the enormous amount of contradictory analysis on the Internet. There are bulls, bears, paper traders, physical buyers, technical analysts, hedge funds, commercial banks and silver manufacturers all trying to play a part in this highly volatile silver market. Trying to sift through the huge volumes of silver analysis on the internet can be extremely frustrating. In addition, some of this information is not meant to inform, but rather to confuse or mislead the investor.
There is a great deal of misinformation on the internet when it comes to silver. I find it ironic that one of the so-called “bullion specialists” seems to give bearish commentary whenever the price of gold or silver rises to new highs. This is akin to a CEO of a corporation telling the media and shareholders that the company’s stock price is too high and needs to drop down to more sustainable levels. What CEO on Earth would say something as stupid as this with the best interest of the company and shareholders in mind? Furthermore, how many CEOs would keep their job if they repeated this over and over for the past several years, and got it wrong time and time again?
Unless you have been in the precious metals markets for quite some time, it is easy to be misled by this type of information. This is the very reason behind the motivation that I had to write this article. In it, I will attempt to give the reader-investor a more detailed and fundamental comparative analysis of the future price of silver, rather than the typical fly-by-night technical charting or bull-bear rant. This should give a more commonsense methodology in forecasting the future path of silver and its eventual paradigm shift.
Paradigm Shift: —n, a radical change in underlying beliefs or theory
The coming paradigm shift in silver will not happen due to technical analysis, fundamentals, or supply & demand forces, but rather due to a change in mass psychology of investors. Even though fundamentals and supply-demand forces will play a part in this shift, they will not be the ultimate cause. I believe technical analysis as it is used today, only charts the amount of manipulation and mass psychology in the silver market.
Throughout history, a paradigm shift occurs in rigged markets when the manipulation of the financial system and economy is no longer sustainable. This occurred in the banking and housing markets in 2007-2008 when we had what I call a “Negative Paradigm Price Shift”— a trend where prices or values are declining.
Negative Paradigm Price Shift in Housing and Banking
Prior to 2007, the real estate market was kept alive by the work of clowns and magicians in the mortgage industry and banking system. For several years everyone was having a great time. As housing prices and sales continued towards the heavens, bank profits hit all-time records. Everything was going along just fine until the market realized one day that there was nothing left after “Liars Loans” were levied to keep the Ponzi going. Once the housing market collapsed, so too did the banking system. Like two twins attached at birth, one could not live without the other.
In true waterfall fashion, investment banks, commercial banks, government-sponsored entities and insurance companies went bankrupt, were either taken over or became a mere shadow of their former selves.
Here we can see several examples of a Negative Paradigm Shift
As you can see from these 10-year charts, the prices of these stocks were range bound prior to 2007. All of a sudden, in the middle of 2007, the bottom fell out and the prices of these stocks suffered exponential losses. Other examples of companies that have experienced similar Negative Paradigm Shifts include Lehman Brothers, Bear Stearns, Merrill Lynch, Washington Mutual and Freddie Mac.
How could all of these institutions collapse in this fashion? It was due to policy deregulation as well as the manipulation of financial products, assets and information. Thus, the banking system and these institutions were functioning and supposedly solvent a great deal longer than a free market would have allowed. The act of misleading the market gave false values and elevated stock prices.
This is a perfect example of the mass psychology of the public investing in highly inflated assets based on superficial and bogus technical analysis. As the housing and financial markets were reaching their peak in the 2007, fundamentals played no part in their real market values— it was based entirely on mass psychology instead; the false belief projected by investors and the corporations themselves that these companies were actually of high value.
This disintegration of the housing market and banking system was not an isolated episode; rather it was part of the events that take place in STAGE 1 of what Dmitry Orlov calls the Five Stages of Collapse.
¦ Stage 1: Financial Collapse
¦ Stage 2: Commercial Collapse
¦ Stage 3: Political Collapse
¦ Stage 4: Social Collapse
¦ Stage 5: Cultural Collapse
According to Orlov:
STAGE 1: Financial collapse.Faith in "business as usual" is lost. The future is no longer assumed resemble the past in any way that allows risk to be assessed and financial assets to be guaranteed. Financial institutions become insolvent; savings are wiped out, and access to capital is lost.
Here we can see that the majority of these conditions in the Financial Collapse have already taken place. The only reason why the U.S. banking system is still functioning today is due to the ability of banks to mark to model their assets giving the impression that they are still solvent. Furthermore, the increased guarantee of FDIC deposit accounts to $250,000 as well as a temporary unlimited coverage for noninterest-bearing transaction accounts until Dec 31, 2012 have kept a major bank run on the banking system. These changes of policy have postponed the United States from entering into STAGE 2 or the Commercial Collapse. This will be discussed at the latter part of the article.
If this wasn’t bad enough, the current U.S. banking system is based on a fractional reserve requirement of 10% in fiat money; basically paper backing paper. This wasn’t always the case. To get a better idea of how disastrous the present banking system has become, we need to take a look at fractional reserve requirements of the past.
From an Historic Gold-Backed Fractional Reserve System to a Paper Farce Today
Eric Sprott made a recent comment posted in an article on Zerohedge.com, stating that “The financial system is a farce” . He couldn’t be more correct in his assumption. Not only is the present U.S. banking system based on a financial debt instrument called a Federal Reserve Note, but its fractional reserve ratio is virtually nonexistent.
In 1932, the United States had a fractional reserve banking system backed by gold. The member banks had different reserve requirements: central reserve city banks (13 percent), reserve banks (10 percent) and country banks (7 percent). All member banks had a 3 percent reserve requirement on time deposits. Even with these official reserve ratios, the total paper dollar claims to gold were much higher. For this analysis, we are going to compare the M2 money supply to the amount of U.S. Treasury-held gold.
In 1932, the U.S. Treasury held $2.95 billion in gold, there was $5.60 billion in currency in circulation, $36 billion in M2 money supply, and $19 billion in U.S. Treasury debt. The fractional reserve of gold to the M2 money supply was 8.3%.
Despite the terrible conditions during the “Great Depression”, at least the country had two positive factors going for it: 1) A banking system backed by gold and 2) vast resources of energy, metals and minerals to tap into to pull itself out of its current market ills.
Today, the banking system is on the verge of collapse and the country has consumed its best resources which peaked 40-50 years ago. After Nixon dropped the dollar peg to gold in 1971, the world has been on a floating exchange rate fiat monetary system. The present fractional reserve banking system we have today is based on a fiat paper reserve.
This graph shows that no gold whatsoever is backing up the banking system. As the U.S. banking system stands today, its currency— the Federal Reserve Note— is backed by $15.2 trillion worth of U.S. Treasury debt. The system is even weaker when we look into the makeup of the banks’ fractional reserve ratio.
For starters, the official 10% minimum reserve requirement set by the Board of Governors at the Federal Reserve applies to mainly checking accounts. Effective December 27, 1990, CD’s, savings accounts, and timed deposits owned by entities other than households were not included in this 10% reserve requirement. Additionally, in 1994 the Federal Reserve Board passed a “Deposit Reclassification” for financial institutions to help lower reserve requirements even further. Eric DeCarbonnel explains this in his article “US Banks Operating without Reserve Requirements”:
Deposit reclassification is an accounting trick, used by virtually the entire financial sector, which allows banks to eliminate nearly all their reserve requirements. Deposit Reclassification splits a checking account into two separate subaccounts, a transaction (checking) subaccount and a non-transaction (savings) subaccount. This distinction only exists on the bank's books: you will never see these subaccounts on your bank statements.
Deposit reclassification means that, at any point in time, most of the money in American checking accounts sits in invisible savings subaccounts. These savings subaccounts pay no interest, but allow banks to avoid reserve requirements. The public is completely unaware of this financial engineering
It is now apparent that the so-called official 10% fractional reserve ratio of the U.S. banking system is just a mere figure to delude the public into believing it has a working cash reserve ratio, whereas in reality, the system is a complete farce.
The public has no clue just how weak and vulnerable the U.S. banking system has become. At one time, the United States had a fractional reserve banking system backed by physical gold money. Today, its financial system is entirely based on a fiat monetary regime with practically no fractional reserve ratio whatsoever.
Gold & Silver Money Contain Intrinsic Value; Federal Reserve Notes Have None
Not only is the majority of the public ignorant to the amount of dangerous leverage in the U.S. banking system, most have no understanding of real money. I have had several debates on various websites with highly educated individuals on the subject. Some have replied by stating, “The U.S. Dollar is backed by the GDP of the country”, while others have insisted that, “Gold & silver have no intrinsic value whatsoever.” It is no wonder this country is heading full speed over the cliff.
In historic times, the value of gold and silver was tied to their rarity as well as the amount of labor needed in extracting and producing the metals. As time went by, capital became a larger percentage of this value while human labor was replaced by energy-consuming machinery. Each gold and silver coin produced today contains a certain amount of this capital investment, energy and labor cost. Thus, these precious metal coins do hold a certain amount of intrinsic value.
On the other hand, a Federal Reserve Note today has no intrinsic value at all— except for its printing cost. It is only a PROMISE TO PAY. The Federal Reserve Note is not redeemable by gold, but Uncle Sam will give you some of its $15.2 Trillion of U.S. Treasury debt in exchange. It is due to this very reason why we see an increasing amount of Americans buying Gold and Silver Eagles.
The U.S. Mint does not provide the public with annual records of exact dollar sales of their Gold and Silver Eagles. To get the figures below, the annual sales of silver and gold eagles were multiplied by their respective average yearly price reported by Kitco.com.
In times of worry in the financial system, the public regains confidence through buying gold and silver assets. During the Y2K scare, we can see that Americans were putting a great deal more money in Gold Eagles over Silver Eagles. In 1999 the public was buying 12 times the amount of money in gold than silver. Today, we see that investors are spending almost the same amount of money in both precious metals.
The graph above only reveals part of the story. According to kitco.com, the average price of silver in 2011 was $35.11 and the average price of gold was $1571.52. This gives us a gold-silver ratio in 2011 of 45 to 1. If we look at the next graph below we can see just how much more Silver Eagles over Gold Eagles the public is buying.
It is hard to tell from the graph above, but Gold Eagle sales have increased tremendously since 2007. Here are the exact figures for both:
During the Y2K scare in 1999, Americans bought a record 2 million ounces of Gold Eagles and only 9 million ounces of Silver Eagles. This was at ratio of 4.4 to 1. In 2011, the ratio increased nearly 10 times as investors bought almost 40 million Silver Eagles while only purchasing 1 million in Gold Eagle ounces.
Very few individuals have comprehended the amazing trend taking place in the Gold and Silver Eagle’s market. In 1999, Gold Eagle sales hit a record of 2 million ounces. Last year, investors only bought half that amount. However, Silver Eagle sales have increased more than fourfold from nine million oz in 1999 to nearly 40 million ounces in 2011.
Even though these two graphs give overwhelming evidence on how much more investors are buying Silver Eagles over Gold Eagles, it is only part of the story.
Comparing U.S. Domestic Gold-Silver Production vs. Gold-Silver Sales
In my previous article, First Time Ever, Silver Sales Surpass Domestic Production, I explain how Silver Eagle sales are forecasted to be higher than the total 2011 U.S. domestic silver production output (full data on U.S. silver mine production will not be out until April-May of 2012). This is a graph from the article that shows Silver Eagle sales will be approximately 5 million oz greater than U.S. domestic silver production:
While it is true that the U.S. imports silver to meet its industrial and investment demands, this amount was two and a half times its 2010 mine production. According to the USGS 2011 Silver Mineral Summary, the United States had a net import of 3,240 metric tons of silver in 2010. Compare that to its mine production of only 1,280 metric tonnes the very same year.
On the other hand, if we look at the USGS 2011 Gold Mineral Summary, the United States had a net import of 160 metric tonnes of gold in 2010 while its domestic mine production was 230 metric tonnes. Here we can see that the U.S. gold mines produce one and a half times more gold than it imports from foreign sources.
In 2011, the United States is estimated to produce roughly 7.5 million oz of gold (233 metric tonnes) along with one million oz of Gold Eagle Sales:
Looking at these two graphs the difference becomes extremely obvious. Silver Eagle sales consumed 114% of U.S. domestic silver production in 2011, whereas Gold Eagle sales accounted for only 13.5% of domestic gold production.
The public is beginning to understand that silver offers a much more affordable way to protect one’s wealth than gold. This realization has now taken a bigger bite out of the U.S. domestic silver production pie than is available. Even though the United States can import silver presently to supply its investment and industrial demand, this situation will change when the U.S. economy enters into STAGE 2 of the collapse
When Will the Paradigm Shift in Silver Occur?
For the most part, Americans are completely oblivious of just how close the country is to a total disintegration of its fiat monetary system. As I mentioned in the beginning of the article, the United States financial system died in 2008. It has been kept alive by policy deregulation, monetary printing, and market manipulation (including derivative manufacturing such as interest rate swaps). These collaborative short term machinations have a lifespan that is diminishing every passing day, while investors who have made the wise decision to exchange fiat money for gold and silver keep wondering how long this manipulation can continue.
I remember watching Peter Schiff on CNBC and Fox Business between the years of 2005-2007 debating about the upcoming collapse of the mortgage and housing markets. On several occasions, Schiff was the laughing stock on the set as anchors and other guests thought he was simply crazy in his forecasts. By 2008, the laughs had stopped while the country watched as the U.S. housing values began their rapid decline that would eventually surpass the disastrous records set during the 1930’s Great Depression.
The answer I give to individuals and investors who ask me the question “when will the manipulation end?” is that it will end when the U.S. enters into STAGE 2 or the Commercial Collapse.
Again, according to Orlov:
Stage 2: Commercial collapse. Faith that "the market shall provide" is lost. Money is devalued and/or becomes scarce, commodities are hoarded, import and retail chains break down, and widespread shortages of survival necessities become the norm.
Despite the forecasts of many analysts of what the U.S. Dollar index or government deficits will look like in the next decade, the U.S. economy will enter into STAGE 2 more likely than not in the next few years. The commercial collapse as described by Orlov is when the whole country will feel the impact of the ongoing economic disintegration.
This article is long enough and does not have time to go into the three other stages of collapse described by Orlov. It is recommended that the reader go to the link provided at the beginning of the article to get additional information on the five stages of collapse.
Briefly, Orlov witnessed firsthand the collapse of the Soviet Union in 1989 and then wrote a book titled Reinventing Collapse: The Soviet Example and American Prospects describing these different stages. According to Orlov, a country does not have to systematically go through all five stages of collapse. But when the financial collapse occurs, the commercial collapse is sure to follow. With all things considered, Orlov believes the overall conditions are far worse in the United States today than they were for the U.S.S.R in 1989.
Currently, an overwhelming majority of the public has not learned its lesson since the collapse of the banking and housing markets in 2008, as they are still heavily invested in the U.S. Treasury and retirement markets. They still cling onto the belief that their paper investment wealth will be safe and provide for them well into the future. The graph below compares the amount of precious metal investment to the total amount of money held in U.S. retirement assets.
Since the American Eagle program started in 1986, there has been roughly $13.4 billion worth of these gold and silver coins purchased. Currently, the total market value of the GLD & SLV ETF is $76 billion. Furthermore, if we assume a 1% ownership of precious metals by the investment community in the United States, taken from information provided by the CPM Gold Yearbook 2011 (based on 0.7% gold as a percent of global financial assets and adding an estimated 0.3% for silver), we would get a figure of approximately $170 billion in these assets.
The total value assigned to the GLD & SLV is given as a form of reference and not as a recommendation for investment purposes. All paper claims on gold and silver are not a guarantee of owning the actual physical metal. Some vehicles such as the PSLV and PHYS enable the investor to trade in shares for actual metal (under certain guidelines).
According to the Investment Company Institute’s third quarter news release in 2011, the total value of U.S. retirement assets was $17 trillion. The breakdown was as follows: $4.6 trillion in IRA’s, $4.3 trillion in defined benefit plans, $4.2 trillion in govt. pension plans, $2.3 trillion in private sector defined-benefit plans, and $1.6 trillion in annuities.
All retirement plans are based on a continued income stream from the market. There is really nothing backing these assets except the faith that the market will continue to grow and function providing the returns to pay its investors when they retire. However, the financial system already experienced its Negative Paradigm Shift in 2007-2008, rendering growth at its necessary rate to perpetually sustain an income stream under a fiat monetary system now impossible.
The graph above indicates the degree of mass psychology in the different investments. Presently, the overwhelming majority is invested in the $17 trillion retirement market. Unfortunately, these retirement assets will go the same way that the housing and financial markets did in 2008-2009. It is only a matter of time.
Gold has been called the “Barbarous Relic”, time and time again on CNBC and Fox Business. There is a certain amount of hubris and ego attached to our present financial house of cards— a paradigm that is coming to an end. Those who believe that gold is a barbarous relic are still drinking that barbarous water, or breathing that barbarous air, or eating that barbarous bread or still cleaning with that barbarous object called a broom. All these so-called barbarous items listed above haven’t changed much since the Roman and Medieval times.
The constant negative rhetoric of gold in the main stream media keeps the mass psychology of the public away from investing in the precious metals and into increasing worthless paper retirement assets.
The Coming Positive Paradigm Shift in Silver
As mentioned before, the paradigm shift in gold and silver will occur when the United States enters into Stage 2, the commercial collapse. This article focuses on silver due to the fact that the majority of gold that has ever been mined is still stashed away nicely in vaults across the world. However, due to silver’s dual role as an investment and industrial commodity, a large percentage of silver that has been mined has been consumed in industrial fabrication and lost forever— continuously diminishing its supply and raising its value.
When silver performs its paradigm shift, it will behave in the opposite fashion as the first three charts in this article. While AIG, Fannie Mae and Citigroup suffered negative paradigm price shifts, silver will be awarded a positive one. The graph below gives a possible REPRESENTATION OF THIS PARADIGM SHIFT. Repeat… a representation of this paradigm shift:
The $150 Free Market Price of silver was calculated by inputting the Jan. 1980 high price of silver into the inflation calculator at Shadowstats.com. I realize there will be a great deal of backlash on this $150 figure… so here is the rationale behind it:
¦ This figure was based on the “official CPI statistics”. John Williams at Shadowstats.com has an alternative SGS calculation using older inflation parameters which would make the price much higher.
¦ The manufacturing of trillions of dollars of derivatives has siphoned investment money away from physical assets such as silver, keeping their prices artificially low.
¦ The overwhelming number of paper claims (100+ to 1) on every physical ounce of silver has also sucked investment money away from the physical metal, also depressing its actual price.
Even though the last two reasons above can overlap in definition, they were separated due to the type of derivatives experienced in the market. The second reason focuses on the tremendous amount of financial derivatives such as interest rate swaps and retirement accounts. The third deals with the silver derivatives themselves— options, futures, pool accounts, silver certificates and silver ETF’s. The possible paradigm price shift of silver shown above represents a trend when the mass psychology of the market becomes increasingly aware of the true fundamentals of physical assets such as silver. The higher the price goes, the more fundamentally aware the market becomes.
The fact of the matter is that the stocks of AIG, Fannie Mae and Citigroup were garbage and worthless well before 2007. If we were to look at their charts above and draw a straight line from where their current stock prices are today and go back all away across the chart to the year 2002, we would see a fair indication of a free market value.
Yet, the majority of investors today are still suffering from the same mass psychology that kept the financial and housing markets elevated several years ago. Today, the investor’s confidence is placed firmly in the U.S. Treasury and Retirement markets. These are the two final greatest bubbles in history.
The U.S. banking system has no real fractional reserve to speak of and its monetary unit called the Federal Reserve Note is backed by $15.2 trillion in U.S. Treasury debt. The global oil supply is peaking and there will not be the available cheap energy in the future to fuel the U.S. economy to be able to pay back these debts or fulfill the obligations of the current $17 trillion retirement market.
While, the U.S. Govt. and Wall Street may be able to postpone the inevitable for a while longer by printing more dollar digits, issuing more paper treasuries and manufacturing more derivatives, these are temporary solutions. There are other alternatives that the U.S. could opt to take, such as backing the dollar with gold or erasing all the debt and starting over. Unfortunately, these are not the choices that are being considered by the leaders in government.
The paradigm shift in silver shown above is a representation of a possible trend in the future. Anything can change its outcome in time and price. That being said, when global markets cannot avoid heading into an unavoidable negative exponential trajectory as they presently are, (including the U.S. economic system) changes in price or value move up or down quickly and violently.
A change in mass psychology will play a big part in the market realization of the true fundamental price of silver. Silver will outperform gold in percentage terms as it will be more affordable to the masses. The majority of technical charting and a great deal of analysis on the internet are nothing more than white noise to confuse and frustrate.
Lastly, to all the silver investors who are purchasing physical bullion on the dips, remain patient— the silver paradigm shift is coming.
Yes it does, very good one here. Better than holding Physical gold right now IMO.
JER1
Great post as always! How was your Easter NYBob?
JER1
HAPPY EASTER TO YOU MY FRIEND!
JER1
No Prob
You to bud, Thanks for the Charts!
JER1
Financial Highlights not to bad
Gross profit for the Year was increased by 358% to $29,115,000 (2010: $6,360,000).
Cost to mine went down to $521 per once from $583.
Net profit after income taxes for 2011 was $12,130,000 compared to $1,455,000 in 2010.
JER1
10 Reasons Why the Reign of the Dollar as the World Reserve Currency is About to Come to an End
The U.S. dollar has probably been the closest thing to a true global currency that the world has ever seen. For decades, the use of the U.S. dollar has been absolutely dominant in international trade. This has had tremendous benefits for the U.S. financial system and for U.S. consumers, and it has given the U.S. government tremendous power and influence around the globe.
Today, more than 60 percent of all foreign currency reserves in the world are in U.S. dollars. But there are big changes on the horizon...
The mainstream media in the United States has been strangely silent about this, but some of the biggest economies on earth have been making agreements with each other to move away from using the U.S. dollar in international trade. There are also some oil producing nations which have begun selling oil in currencies other than the U.S. dollar, which is a major threat to the petrodollar system which has been in place for nearly four decades. And big international institutions such as the UN and the IMF have even been issuing official reports about the need to move away form the U.S. dollar and toward a new global reserve currency. So the reign of the U.S. dollar as the world reserve currency is definitely being threatened, and the coming shift in international trade is going to have massive implications for the U.S. economy.
A lot of this is being fueled by China. China has the second largest economy on the face of the earth, and the size of the Chinese economy is projected to pass the size of the U.S. economy by 2016. In fact, one economist is even projecting that the Chinese economy will be three times larger than the U.S. economy by the year 2040.
So China is sitting there and wondering why the U.S. dollar should continue to be so preeminent if the Chinese economy is about to become the number one economy on the planet.
Over the past few years, China and other emerging powers such as Russia have been been quietly making agreements to move away from the U.S. dollar in international trade. The supremacy of the U.S. dollar is not nearly as solid as most Americans believe that it is.
As the U.S. economy continues to fade, it is going to be really hard to argue that the U.S. dollar should continue to function as the primary reserve currency of the world. Things are rapidly changing, and most Americans have no idea where these trends are taking us.
The following are 10 reasons why the reign of the dollar as the world reserve currency is about to come to an end....
#1 China And Japan Are Dumping the U.S. Dollar In Bilateral Trade
A few months ago, the second largest economy on earth (China) and the third largest economy on earth (Japan) struck a deal which will promote the use of their own currencies (rather than the U.S. dollar) when trading with each other. This was an incredibly important agreement that was virtually totally ignored by the U.S. media. The following is from a BBC report about that agreement....
China and Japan have unveiled plans to promote direct exchange of their currencies in a bid to cut costs for companies and boost bilateral trade.
The deal will allow firms to convert the Chinese and Japanese currencies directly into each other.
Currently businesses in both countries need to buy US dollars before converting them into the desired currency, adding extra costs.
#2 The BRICS (Brazil, Russia, India, China, South Africa) Plan To Start Using Their Own Currencies When Trading With Each Other
The BRICS continue to flex their muscles. A new agreement will promote the use of their own national currencies when trading with each other rather than the U.S. dollar. The following is from a news source in India....
The five major emerging economies of BRICS -- Brazil, Russia, India, China and South Africa -- are set to inject greater economic momentum into their grouping by signing two pacts for promoting intra-BRICS trade at the fourth summit of their leaders here Thursday.
The two agreements that will enable credit facility in local currency for businesses of BRICS countries will be signed in the presence of the leaders of the five countries, Sudhir Vyas, secretary (economic relations) in the external affairs ministry, told reporters here.
The pacts are expected to scale up intra-BRICS trade which has been growing at the rate of 28 percent over the last few years, but at $230 billion, remains much below the potential of the five economic powerhouses.
#3 The Russia/China Currency Agreement
Russia and China have been using their own national currencies when trading with each other for more than a year now. Leaders from both Russia and China have been strongly advocating for a new global reserve currency for several years, and both nations seem determined to break the power that the U.S. dollar has over international trade.
#4 The Growing Use Of Chinese Currency In Africa
Who do you think is Africa's biggest trading partner?
It isn't the United States.
In 2009, China became Africa's biggest trading partner, and China is now aggressively seeking to expand the use of Chinese currency on that continent.
A report from Africa’s largest bank, Standard Bank, recently stated the following....
“We expect at least $100 billion (about R768 billion) in Sino-African trade – more than the total bilateral trade between China and Africa in 2010 – to be settled in the renminbi by 2015.”
China seems absolutely determined to change the way that international trade is done. At this point, approximately 70,000 Chinese companies are using Chinese currency in cross-border transactions.
#5 The China/United Arab Emirates Deal
China and the United Arab Emirates have agreed to ditch the U.S. dollar and use their own currencies in oil transactions with each other.
The UAE is a fairly small player, but this is definitely a threat to the petrodollar system. What will happen to the petrodollar if other oil producing countries in the Middle East follow suit?
#6 Iran
Iran has been one of the most aggressive nations when it comes to moving away from the U.S. dollar in international trade. For example, it has been reported that India will begin to use gold to buy oil from Iran.
Tensions between the U.S. and Iran are not likely to go away any time soon, and Iran is likely to continue to do what it can to inflict pain on the United States in the financial world.
#7 The China/Saudi Arabia Relationship
Who imports the most oil from Saudi Arabia?
It is not the United States.
Rather, it is China.
As I wrote about the other day, China imported 1.39 million barrels of oil per day from Saudi Arabia in February, which was a 39 percent increase from one year earlier.
Saudi Arabia and China have teamed up to construct a massive new oil refinery in Saudi Arabia, and leaders from both nations have been working to aggressively expand trade between the two nations.
So how long is Saudi Arabia going to stick with the petrodollar if China is their most important customer?
That is a very important question.
#8 The United Nations Has Been Pushing For A New World Reserve Currency
The United Nations has been issuing reports that openly call for an alternative to the U.S. dollar as the reserve currency of the world.
In particular, one UN report envisions "a new global reserve system" in which the U.S. no longer has dominance....
"A new global reserve system could be created, one that no longer relies on the United States dollar as the single major reserve currency."
#9 The IMF Has Been Pushing For A New World Reserve Currency
The International Monetary Fund has also published a series of reports calling for the U.S. dollar to be replaced as the reserve currency of the world.
In particular, one IMF paper entitled "Reserve Accumulation and International Monetary Stability" that was published a while back actually proposed that a future global currency be named the "Bancor" and that a future global central bank could be put in charge of issuing it....
"A global currency, bancor, issued by a global central bank (see Supplement 1, section V) would be designed as a stable store of value that is not tied exclusively to the conditions of any particular economy. As trade and finance continue to grow rapidly and global integration increases, the importance of this broader perspective is expected to continue growing."
#10 Most Of The Rest Of The World Hates The United States
Global sentiment toward the United States has dramatically shifted, and this should not be underestimated.
Decades ago, we were one of the most loved nations on earth.
Now we are one of the most hated.
If you doubt this, just do some international traveling.
Even in Europe (where we are supposed to have friends), Americans are treated like dirt. Many American travelers have resorted to wearing Canadian pins so that they will not be treated like garbage while traveling over there.
If the rest of the world still loved us, they would probably be glad to continue using the U.S. dollar. But because we are now so unpopular, that gives other nations even more incentive to dump the dollar in international trade.
So what will happen if the reign of the U.S. dollar as the world reserve currency comes to an end?
Well, some of the potential effects were described in a recent article by Michael Payne....
"The demise of the dollar will also bring radical changes to the American lifestyle. When this economic tsunami hits America, it will make the 2008 recession and its aftermath look like no more than a slight bump in the road. It will bring very undesirable changes to the American lifestyle through massive inflation, high interest rates on mortgages and cars, and substantial increases in the cost of food, clothing and gasoline; it will have a detrimental effect on every aspect of our lives."
Most Americans don't realize how low the price of gasoline in the United States is compared to much of the rest of the world.
There are areas in Europe where they pay about twice what we do for gasoline. Yes, taxes have a lot to do with that, but the fact that the U.S. dollar is used for almost all oil transactions also plays a significant role.
Today, America consumes nearly a quarter of the world's oil. Our entire economy is based upon our ability to cheaply transport goods and services over vast distances.
So what happens if the price of gasoline doubles or triples from where it is at now?
In addition, if the reign of the U.S. dollar as global reserve currency ends, the U.S. government is going to have a much harder time financing its debt.
Right now, there is a huge demand for U.S. dollars and for U.S. government debt since countries around the world have to keep huge reserves of U.S. currency lying around for the sake of international trade.
But what if that all changed?
What if the appetite for U.S. dollars and U.S. debt dried up dramatically?
That is something to think about.
At the moment, the global financial system is centered on the United States.
But that will not always be the case.
The things talked about in this article will not happen overnight, but it is important to note that these changes are picking up steam.
Under the right conditions, a shift in momentum can become a landslide or an avalanche.
Clearly, the conditions are right for a significant move away from the U.S. dollar in international trade.
So when will this major shift occur?
Only time will tell.
Nice, I like It!
JER1
Nice to meet you as well and have a nice trip!
JER1
Hello MiamiGent Welcome to the board! Thanks for your post and please feel free to post more often.
JER1
Executive Order -- National Defense Resources Preparedness
http://www.whitehouse.gov/the-press-office/2012/03/16/executive-order-national-defense-resources-preparedness
EXECUTIVE ORDER
March 16, 2012.
NATIONAL DEFENSE RESOURCES PREPAREDNESS
By the authority vested in me as President by the Constitution and the laws of the United States of America, including the Defense Production Act of 1950, as amended (50 U.S.C. App. 2061 et seq.), and section 301 of title 3, United States Code, and as Commander in Chief of the Armed Forces of the United States, it is hereby ordered as follows:
PART I - PURPOSE, POLICY, AND IMPLEMENTATION
Section 101. Purpose. This order delegates authorities and addresses national defense resource policies and programs under the Defense Production Act of 1950, as amended (the "Act").
Sec. 102. Policy. The United States must have an industrial and technological base capable of meeting national defense requirements and capable of contributing to the technological superiority of its national defense equipment in peacetime and in times of national emergency. The domestic industrial and technological base is the foundation for national defense preparedness. The authorities provided in the Act shall be used to strengthen this base and to ensure it is capable of responding to the national defense needs of the United States.
Sec. 103. General Functions. Executive departments and agencies (agencies) responsible for plans and programs relating to national defense (as defined in section 801(j) of this order), or for resources and services needed to support such plans and programs, shall:
(a) identify requirements for the full spectrum of emergencies, including essential military and civilian demand;
(b) assess on an ongoing basis the capability of the domestic industrial and technological base to satisfy requirements in peacetime and times of national emergency, specifically evaluating the availability of the most critical resource and production sources, including subcontractors and suppliers, materials, skilled labor, and professional and technical personnel;
(c) be prepared, in the event of a potential threat to the security of the United States, to take actions necessary to ensure the availability of adequate resources and production capability, including services and critical technology, for national defense requirements;
(d) improve the efficiency and responsiveness of the domestic industrial base to support national defense requirements; and
(e) foster cooperation between the defense and commercial sectors for research and development and for acquisition of materials, services, components, and equipment to enhance industrial base efficiency and responsiveness.
Sec. 104. Implementation. (a) The National Security Council and Homeland Security Council, in conjunction with the National Economic Council, shall serve as the integrated policymaking forum for consideration and formulation of national defense resource preparedness policy and shall make recommendations to the President on the use of authorities under the Act.
(b) The Secretary of Homeland Security shall:
(1) advise the President on issues of national defense resource preparedness and on the use of the authorities and functions delegated by this order;
(2) provide for the central coordination of the plans and programs incident to authorities and functions delegated under this order, and provide guidance to agencies assigned functions under this order, developed in consultation with such agencies; and
(3) report to the President periodically concerning all program activities conducted pursuant to this order.
(c) The Defense Production Act Committee, described in section 701 of this order, shall:
(1) in a manner consistent with section 2(b) of the Act, 50 U.S.C. App. 2062(b), advise the President through the Assistant to the President and National Security Advisor, the Assistant to the President for Homeland Security and Counterterrorism, and the Assistant to the President for Economic Policy on the effective use of the authorities under the Act; and
(2) prepare and coordinate an annual report to the Congress pursuant to section 722(d) of the Act, 50 U.S.C. App. 2171(d).
(d) The Secretary of Commerce, in cooperation with the Secretary of Defense, the Secretary of Homeland Security, and other agencies, shall:
(1) analyze potential effects of national emergencies on actual production capability, taking into account the entire production system, including shortages of resources, and develop recommended preparedness measures to strengthen capabilities for production increases in national emergencies; and
(2) perform industry analyses to assess capabilities of the industrial base to support the national defense, and develop policy recommendations to improve the international competitiveness of specific domestic industries and their abilities to meet national defense program needs.
PART II - PRIORITIES AND ALLOCATIONS
Sec. 201. Priorities and Allocations Authorities. (a) The authority of the President conferred by section 101 of the Act, 50 U.S.C. App. 2071, to require acceptance and priority performance of contracts or orders (other than contracts of employment) to promote the national defense over performance of any other contracts or orders, and to allocate materials, services, and facilities as deemed necessary or appropriate to promote the national defense, is delegated to the following agency heads:
(1) the Secretary of Agriculture with respect to food resources, food resource facilities, livestock resources, veterinary resources, plant health resources, and the domestic distribution of farm equipment and commercial fertilizer;
(2) the Secretary of Energy with respect to all forms of energy;
(3) the Secretary of Health and Human Services with respect to health resources;
(4) the Secretary of Transportation with respect to all forms of civil transportation;
(5) the Secretary of Defense with respect to water resources; and
(6) the Secretary of Commerce with respect to all other materials, services, and facilities, including construction materials.
(b) The Secretary of each agency delegated authority under subsection (a) of this section (resource departments) shall plan for and issue regulations to prioritize and allocate resources and establish standards and procedures by which the authority shall be used to promote the national defense, under both emergency and non-emergency conditions. Each Secretary shall authorize the heads of other agencies, as appropriate, to place priority ratings on contracts and orders for materials, services, and facilities needed in support of programs approved under section 202 of this order.
(c) Each resource department shall act, as necessary and appropriate, upon requests for special priorities assistance, as defined by section 801(l) of this order, in a time frame consistent with the urgency of the need at hand. In situations where there are competing program requirements for limited resources, the resource department shall consult with the Secretary who made the required determination under section 202 of this order. Such Secretary shall coordinate with and identify for the resource department which program requirements to prioritize on the basis of operational urgency. In situations involving more than one Secretary making such a required determination under section 202 of this order, the Secretaries shall coordinate with and identify for the resource department which program requirements should receive priority on the basis of operational urgency.
(d) If agreement cannot be reached between two such Secretaries, then the issue shall be referred to the President through the Assistant to the President and National Security Advisor and the Assistant to the President for Homeland Security and Counterterrorism.
(e) The Secretary of each resource department, when necessary, shall make the finding required under section 101(b) of the Act, 50 U.S.C. App. 2071(b). This finding shall be submitted for the President's approval through the Assistant to the President and National Security Advisor and the Assistant to the President for Homeland Security and Counterterrorism. Upon such approval, the Secretary of the resource department that made the finding may use the authority of section 101(a) of the Act, 50 U.S.C. App. 2071(a), to control the general distribution of any material (including applicable services) in the civilian market.
Sec. 202. Determinations. Except as provided in section 201(e) of this order, the authority delegated by section 201 of this order may be used only to support programs that have been determined in writing as necessary or appropriate to promote the national defense:
(a) by the Secretary of Defense with respect to military production and construction, military assistance to foreign nations, military use of civil transportation, stockpiles managed by the Department of Defense, space, and directly related activities;
(b) by the Secretary of Energy with respect to energy production and construction, distribution and use, and directly related activities; and
(c) by the Secretary of Homeland Security with respect to all other national defense programs, including civil defense and continuity of Government.
Sec. 203. Maximizing Domestic Energy Supplies. The authorities of the President under section 101(c)(1) (2) of the Act, 50 U.S.C. App. 2071(c)(1) (2), are delegated to the Secretary of Commerce, with the exception that the authority to make findings that materials (including equipment), services, and facilities are critical and essential, as described in section 101(c)(2)(A) of the Act, 50 U.S.C. App. 2071(c)(2)(A), is delegated to the Secretary of Energy.
Sec. 204. Chemical and Biological Warfare. The authority of the President conferred by section 104(b) of the Act, 50 U.S.C. App. 2074(b), is delegated to the Secretary of Defense. This authority may not be further delegated by the Secretary.
PART III - EXPANSION OF PRODUCTIVE CAPACITY AND SUPPLY
Sec. 301. Loan Guarantees. (a) To reduce current or projected shortfalls of resources, critical technology items, or materials essential for the national defense, the head of each agency engaged in procurement for the national defense, as defined in section 801(h) of this order, is authorized pursuant to section 301 of the Act, 50 U.S.C. App. 2091, to guarantee loans by private institutions.
(b) Each guaranteeing agency is designated and authorized to: (1) act as fiscal agent in the making of its own guarantee contracts and in otherwise carrying out the purposes of section 301 of the Act; and (2) contract with any Federal Reserve Bank to assist the agency in serving as fiscal agent.
(c) Terms and conditions of guarantees under this authority shall be determined in consultation with the Secretary of the Treasury and the Director of the Office of Management and Budget (OMB). The guaranteeing agency is authorized, following such consultation, to prescribe: (1) either specifically or by maximum limits or otherwise, rates of interest, guarantee and commitment fees, and other charges which may be made in connection with such guarantee contracts; and (2) regulations governing the forms and procedures (which shall be uniform to the extent practicable) to be utilized in connection therewith.
Sec. 302. Loans. To reduce current or projected shortfalls of resources, critical technology items, or materials essential for the national defense, the head of each agency engaged in procurement for the national defense is delegated the authority of the President under section 302 of the Act, 50 U.S.C. App. 2092, to make loans thereunder. Terms and conditions of loans under this authority shall be determined in consultation with the Secretary of the Treasury and the Director of OMB.
Sec. 303. Additional Authorities. (a) To create, maintain, protect, expand, or restore domestic industrial base capabilities essential for the national defense, the head of each agency engaged in procurement for the national defense is delegated the authority of the President under section 303 of the Act, 50 U.S.C. App. 2093, to make provision for purchases of, or commitments to purchase, an industrial resource or a critical technology item for Government use or resale, and to make provision for the development of production capabilities, and for the increased use of emerging technologies in security program applications, and to enable rapid transition of emerging technologies.
(b) Materials acquired under section 303 of the Act, 50 U.S.C. App. 2093, that exceed the needs of the programs under the Act may be transferred to the National Defense Stockpile, if, in the judgment of the Secretary of Defense as the National Defense Stockpile Manager, such transfers are in the public interest.
Sec. 304. Subsidy Payments. To ensure the supply of raw or nonprocessed materials from high cost sources, or to ensure maximum production or supply in any area at stable prices of any materials in light of a temporary increase in transportation cost, the head of each agency engaged in procurement for the national defense is delegated the authority of the President under section 303(c) of the Act, 50 U.S.C. App. 2093(c), to make subsidy payments, after consultation with the Secretary of the Treasury and the Director of OMB.
Sec. 305. Determinations and Findings. (a) Pursuant to budget authority provided by an appropriations act in advance for credit assistance under section 301 or 302 of the Act, 50 U.S.C. App. 2091, 2092, and consistent with the Federal Credit Reform Act of 1990, as amended (FCRA), 2 U.S.C. 661 et seq., the head of each agency engaged in procurement for the national defense is delegated the authority to make the determinations set forth in sections 301(a)(2) and 302(b)(2) of the Act, in consultation with the Secretary making the required determination under section 202 of this order; provided, that such determinations shall be made after due consideration of the provisions of OMB Circular A 129 and the credit subsidy score for the relevant loan or loan guarantee as approved by OMB pursuant to FCRA.
(b) Other than any determination by the President under section 303(a)(7)(b) of the Act, the head of each agency engaged in procurement for the national defense is delegated the authority to make the required determinations, judgments, certifications, findings, and notifications defined under section 303 of the Act, 50 U.S.C. App. 2093, in consultation with the Secretary making the required determination under section 202 of this order.
Sec. 306. Strategic and Critical Materials. The Secretary of Defense, and the Secretary of the Interior in consultation with the Secretary of Defense as the National Defense Stockpile Manager, are each delegated the authority of the President under section 303(a)(1)(B) of the Act, 50 U.S.C. App. 2093(a)(1)(B), to encourage the exploration, development, and mining of strategic and critical materials and other materials.
Sec. 307. Substitutes. The head of each agency engaged in procurement for the national defense is delegated the authority of the President under section 303(g) of the Act, 50 U.S.C. App. 2093(g), to make provision for the development of substitutes for strategic and critical materials, critical components, critical technology items, and other resources to aid the national defense.
Sec. 308. Government-Owned Equipment. The head of each agency engaged in procurement for the national defense is delegated the authority of the President under section 303(e) of the Act, 50 U.S.C. App. 2093(e), to:
(a) procure and install additional equipment, facilities, processes, or improvements to plants, factories, and other industrial facilities owned by the Federal Government and to procure and install Government owned equipment in plants, factories, or other industrial facilities owned by private persons;
(b) provide for the modification or expansion of privately owned facilities, including the modification or improvement of production processes, when taking actions under sections 301, 302, or 303 of the Act, 50 U.S.C. App. 2091, 2092, 2093; and
(c) sell or otherwise transfer equipment owned by the Federal Government and installed under section 303(e) of the Act, 50 U.S.C. App. 2093(e), to the owners of such plants, factories, or other industrial facilities.
Sec. 309. Defense Production Act Fund. The Secretary of Defense is designated the Defense Production Act Fund Manager, in accordance with section 304(f) of the Act, 50 U.S.C. App. 2094(f), and shall carry out the duties specified in section 304 of the Act, in consultation with the agency heads having approved, and appropriated funds for, projects under title III of the Act.
Sec. 310. Critical Items. The head of each agency engaged in procurement for the national defense is delegated the authority of the President under section 107(b)(1) of the Act, 50 U.S.C. App. 2077(b)(1), to take appropriate action to ensure that critical components, critical technology items, essential materials, and industrial resources are available from reliable sources when needed to meet defense requirements during peacetime, graduated mobilization, and national emergency. Appropriate action may include restricting contract solicitations to reliable sources, restricting contract solicitations to domestic sources (pursuant to statutory authority), stockpiling critical components, and developing substitutes for critical components or critical technology items.
Sec. 311. Strengthening Domestic Capability. The head of each agency engaged in procurement for the national defense is delegated the authority of the President under section 107(a) of the Act, 50 U.S.C. App. 2077(a), to utilize the authority of title III of the Act or any other provision of law to provide appropriate incentives to develop, maintain, modernize, restore, and expand the productive capacities of domestic sources for critical components, critical technology items, materials, and industrial resources essential for the execution of the national security strategy of the United States.
Sec. 312. Modernization of Equipment. The head of each agency engaged in procurement for the national defense, in accordance with section 108(b) of the Act, 50 U.S.C. App. 2078(b), may utilize the authority of title III of the Act to guarantee the purchase or lease of advance manufacturing equipment, and any related services with respect to any such equipment for purposes of the Act. In considering title III projects, the head of each agency engaged in procurement for the national defense shall provide a strong preference for proposals submitted by a small business supplier or subcontractor in accordance with section 108(b)(2) of the Act, 50 U.S.C. App. 2078(b)(2).
PART IV - VOLUNTARY AGREEMENTS AND ADVISORY COMMITTEES
Sec. 401. Delegations. The authority of the President under sections 708(c) and (d) of the Act, 50 U.S.C. App. 2158(c), (d), is delegated to the heads of agencies otherwise delegated authority under this order. The status of the use of such delegations shall be furnished to the Secretary of Homeland Security.
Sec. 402. Advisory Committees. The authority of the President under section 708(d) of the Act, 50 U.S.C. App. 2158(d), and delegated in section 401 of this order (relating to establishment of advisory committees) shall be exercised only after consultation with, and in accordance with, guidelines and procedures established by the Administrator of General Services.
Sec. 403. Regulations. The Secretary of Homeland Security, after approval of the Attorney General, and after consultation by the Attorney General with the Chairman of the Federal Trade Commission, shall promulgate rules pursuant to section 708(e) of the Act, 50 U.S.C. App. 2158(e), incorporating standards and procedures by which voluntary agreements and plans of action may be developed and carried out. Such rules may be adopted by other agencies to fulfill the rulemaking requirement of section 708(e) of the Act, 50 U.S.C. App. 2158(e).
PART V - EMPLOYMENT OF PERSONNEL
Sec. 501. National Defense Executive Reserve. (a) In accordance with section 710(e) of the Act, 50 U.S.C. App. 2160(e), there is established in the executive branch a National Defense Executive Reserve (NDER) composed of persons of recognized expertise from various segments of the private sector and from Government (except full time Federal employees) for training for employment in executive positions in the Federal Government in the event of a national defense emergency.
(b) The Secretary of Homeland Security shall issue necessary guidance for the NDER program, including appropriate guidance for establishment, recruitment, training, monitoring, and activation of NDER units and shall be responsible for the overall coordination of the NDER program. The authority of the President under section 710(e) of the Act, 50 U.S.C. App. 2160(e), to determine periods of national defense emergency is delegated to the Secretary of Homeland Security.
(c) The head of any agency may implement section 501(a) of this order with respect to NDER operations in such agency.
(d) The head of each agency with an NDER unit may exercise the authority under section 703 of the Act, 50 U.S.C. App. 2153, to employ civilian personnel when activating all or a part of its NDER unit. The exercise of this authority shall be subject to the provisions of sections 501(e) and (f) of this order and shall not be redelegated.
(e) The head of an agency may activate an NDER unit, in whole or in part, upon the written determination of the Secretary of Homeland Security that an emergency affecting the national defense exists and that the activation of the unit is necessary to carry out the emergency program functions of the agency.
(f) Prior to activating the NDER unit, the head of the agency shall notify, in writing, the Assistant to the President for Homeland Security and Counterterrorism of the impending activation.
Sec. 502. Consultants. The head of each agency otherwise delegated functions under this order is delegated the authority of the President under sections 710(b) and (c) of the Act, 50 U.S.C. App. 2160(b), (c), to employ persons of outstanding experience and ability without compensation and to employ experts, consultants, or organizations. The authority delegated by this section may not be redelegated.
PART VI - LABOR REQUIREMENTS
Sec. 601. Secretary of Labor. (a) The Secretary of Labor, in coordination with the Secretary of Defense and the heads of other agencies, as deemed appropriate by the Secretary of Labor, shall:
(1) collect and maintain data necessary to make a continuing appraisal of the Nation's workforce needs for purposes of national defense;
(2) upon request by the Director of Selective Service, and in coordination with the Secretary of Defense, assist the Director of Selective Service in development of policies regulating the induction and deferment of persons for duty in the armed services;
(3) upon request from the head of an agency with authority under this order, consult with that agency with respect to: (i) the effect of contemplated actions on labor demand and utilization; (ii) the relation of labor demand to materials and facilities requirements; and (iii) such other matters as will assist in making the exercise of priority and allocations functions consistent with effective utilization and distribution of labor;
(4) upon request from the head of an agency with authority under this order: (i) formulate plans, programs, and policies for meeting the labor requirements of actions to be taken for national defense purposes; and (ii) estimate training needs to help address national defense requirements and promote necessary and appropriate training programs; and
(5) develop and implement an effective labor management relations policy to support the activities and programs under this order, with the cooperation of other agencies as deemed appropriate by the Secretary of Labor, including the National Labor Relations Board, the Federal Labor Relations Authority, the National Mediation Board, and the Federal Mediation and Conciliation Service.
(b) All agencies shall cooperate with the Secretary of Labor, upon request, for the purposes of this section, to the extent permitted by law.
PART VII - DEFENSE PRODUCTION ACT COMMITTEE
Sec. 701. The Defense Production Act Committee. (a) The Defense Production Act Committee (Committee) shall be composed of the following members, in accordance with section 722(b) of the Act, 50 U.S.C. App. 2171(b):
(1) The Secretary of State;
(2) The Secretary of the Treasury;
(3) The Secretary of Defense;
(4) The Attorney General;
(5) The Secretary of the Interior;
(6) The Secretary of Agriculture;
(7) The Secretary of Commerce;
(8) The Secretary of Labor;
(9) The Secretary of Health and Human Services;
(10) The Secretary of Transportation;
(11) The Secretary of Energy;
(12) The Secretary of Homeland Security;
(13) The Director of National Intelligence;
(14) The Director of the Central Intelligence Agency;
(15) The Chair of the Council of Economic Advisers;
(16) The Administrator of the National Aeronautics and Space Administration; and
(17) The Administrator of General Services.
(b) The Director of OMB and the Director of the Office of Science and Technology Policy shall be invited to participate in all Committee meetings and activities in an advisory role. The Chairperson, as designated by the President pursuant to section 722 of the Act, 50 U.S.C. App. 2171, may invite the heads of other agencies or offices to participate in Committee meetings and activities in an advisory role, as appropriate.
Sec. 702. Offsets. The Secretary of Commerce shall prepare and submit to the Congress the annual report required by section 723 of the Act, 50 U.S.C. App. 2172, in consultation with the Secretaries of State, the Treasury, Defense, and Labor, the United States Trade Representative, the Director of National Intelligence, and the heads of other agencies as appropriate. The heads of agencies shall provide the Secretary of Commerce with such information as may be necessary for the effective performance of this function.
PART VIII - GENERAL PROVISIONS
Sec. 801. Definitions. In addition to the definitions in section 702 of the Act, 50 U.S.C. App. 2152, the following definitions apply throughout this order:
(a) "Civil transportation" includes movement of persons and property by all modes of transportation in interstate, intrastate, or foreign commerce within the United States, its territories and possessions, and the District of Columbia, and related public storage and warehousing, ports, services, equipment and facilities, such as transportation carrier shop and repair facilities. "Civil transportation" also shall include direction, control, and coordination of civil transportation capacity regardless of ownership. "Civil transportation" shall not include transportation owned or controlled by the Department of Defense, use of petroleum and gas pipelines, and coal slurry pipelines used only to supply energy production facilities directly.
(b) "Energy" means all forms of energy including petroleum, gas (both natural and manufactured), electricity, solid fuels (including all forms of coal, coke, coal chemicals, coal liquification, and coal gasification), solar, wind, other types of renewable energy, atomic energy, and the production, conservation, use, control, and distribution (including pipelines) of all of these forms of energy.
(c) "Farm equipment" means equipment, machinery, and repair parts manufactured for use on farms in connection with the production or preparation for market use of food resources.
(d) "Fertilizer" means any product or combination of products that contain one or more of the elements nitrogen, phosphorus, and potassium for use as a plant nutrient.
(e) "Food resources" means all commodities and products, (simple, mixed, or compound), or complements to such commodities or products, that are capable of being ingested by either human beings or animals, irrespective of other uses to which such commodities or products may be put, at all stages of processing from the raw commodity to the products thereof in vendible form for human or animal consumption. "Food resources" also means potable water packaged in commercially marketable containers, all starches, sugars, vegetable and animal or marine fats and oils, seed, cotton, hemp, and flax fiber, but does not mean any such material after it loses its identity as an agricultural commodity or agricultural product.
(f) "Food resource facilities" means plants, machinery, vehicles (including on farm), and other facilities required for the production, processing, distribution, and storage (including cold storage) of food resources, and for the domestic distribution of farm equipment and fertilizer (excluding transportation thereof).
(g) "Functions" include powers, duties, authority, responsibilities, and discretion.
(h) "Head of each agency engaged in procurement for the national defense" means the heads of the Departments of State, Justice, the Interior, and Homeland Security, the Office of the Director of National Intelligence, the Central Intelligence Agency, the National Aeronautics and Space Administration, the General Services Administration, and all other agencies with authority delegated under section 201 of this order.
(i) "Health resources" means drugs, biological products, medical devices, materials, facilities, health supplies, services and equipment required to diagnose, mitigate or prevent the impairment of, improve, treat, cure, or restore the physical or mental health conditions of the population.
(j) "National defense" means programs for military and energy production or construction, military or critical infrastructure assistance to any foreign nation, homeland security, stockpiling, space, and any directly related activity. Such term includes emergency preparedness activities conducted pursuant to title VI of the Robert T. Stafford Disaster Relief and Emergency Assistance Act, 42 U.S.C. 5195 et seq., and critical infrastructure protection and restoration.
(k) "Offsets" means compensation practices required as a condition of purchase in either government to government or commercial sales of defense articles and/or defense services as defined by the Arms Export Control Act, 22 U.S.C. 2751 et seq., and the International Traffic in Arms Regulations, 22 C.F.R. 120.1 130.17.
(l) "Special priorities assistance" means action by resource departments to assist with expediting deliveries, placing rated orders, locating suppliers, resolving production or delivery conflicts between various rated orders, addressing problems that arise in the fulfillment of a rated order or other action authorized by a delegated agency, and determining the validity of rated orders.
(m) "Strategic and critical materials" means materials (including energy) that (1) would be needed to supply the military, industrial, and essential civilian needs of the United States during a national emergency, and (2) are not found or produced in the United States in sufficient quantities to meet such need and are vulnerable to the termination or reduction of the availability of the material.
(n) "Water resources" means all usable water, from all sources, within the jurisdiction of the United States, that can be managed, controlled, and allocated to meet emergency requirements, except "water resources" does not include usable water that qualifies as "food resources."
Sec. 802. General. (a) Except as otherwise provided in section 802(c) of this order, the authorities vested in the President by title VII of the Act, 50 U.S.C. App. 2151 et seq., are delegated to the head of each agency in carrying out the delegated authorities under the Act and this order, by the Secretary of Labor in carrying out part VI of this order, and by the Secretary of the Treasury in exercising the functions assigned in Executive Order 11858, as amended.
(b) The authorities that may be exercised and performed pursuant to section 802(a) of this order shall include:
(1) the power to redelegate authorities, and to authorize the successive redelegation of authorities to agencies, officers, and employees of the Government; and
(2) the power of subpoena under section 705 of the Act, 50 U.S.C. App. 2155, with respect to (i) authorities delegated in parts II, III, and section 702 of this order, and (ii) the functions assigned to the Secretary of the Treasury in Executive Order 11858, as amended, provided that the subpoena power referenced in subsections (i) and (ii) shall be utilized only after the scope and purpose of the investigation, inspection, or inquiry to which the subpoena relates have been defined either by the appropriate officer identified in section 802(a) of this order or by such other person or persons as the officer shall designate.
(c) Excluded from the authorities delegated by section 802(a) of this order are authorities delegated by parts IV and V of this order, authorities in section 721 and 722 of the Act, 50 U.S.C. App. 2170 2171, and the authority with respect to fixing compensation under section 703 of the Act, 50 U.S.C. App. 2153.
Sec. 803. Authority. (a) Executive Order 12919 of June 3, 1994, and sections 401(3) (4) of Executive Order 12656 of November 18, 1988, are revoked. All other previously issued orders, regulations, rulings, certificates, directives, and other actions relating to any function affected by this order shall remain in effect except as they are inconsistent with this order or are subsequently amended or revoked under proper authority. Nothing in this order shall affect the validity or force of anything done under previous delegations or other assignment of authority under the Act.
(b) Nothing in this order shall affect the authorities assigned under Executive Order 11858 of May 7, 1975, as amended, except as provided in section 802 of this order.
(c) Nothing in this order shall affect the authorities assigned under Executive Order 12472 of April 3, 1984, as amended.
Sec. 804. General Provisions. (a) Nothing in this order shall be construed to impair or otherwise affect functions of the Director of OMB relating to budgetary, administrative, or legislative proposals.
(b) This order shall be implemented consistent with applicable law and subject to the availability of appropriations.
(c) This order is not intended to, and does not, create any right or benefit, substantive or procedural, enforceable at law or in equity by any party against the United States, its departments, agencies, or entities, its officers, employees, or agents, or any other person.
BARACK OBAMA
THE WHITE HOUSE,
March 16, 2012.
Awesome Post I love it!
JER1
BLUE CIGS TRY EM!!!!!!!!!
http://www.urefer.com/referral/1395/974609
JER1
Gas Prices Aren't Rising, the Dollar is Falling
When people say “gas prices keep rising”, they've got it all wrong – gas prices are technically stagnant at worst.
It feels like an energy crisis is weighing us down. However, the real crisis is of a much larger scale – it's the economic inflation crisis and the devaluing dollar that you should really be concerned about.
Overall, oil prices right now are unseasonably low. In order for gasoline prices to be considered “normal” they would have to increase by at least another 65-75 cents from where they are today.
Unfortunately, that means it's plausible to assume that prices are going to spike upwards in a very short time.
Prices are not merely one-dimensional. No, prices suggest ratios of value. For comprehension, take a look at this real-life example, courtesy of Forbes:
As this is written, West Texas Intermediate crude oil (WTI) is trading at $105.88/bbl. All this means is that the market value of a barrel of WTI is 105.88 times the market value of “the dollar”. It is also true that WTI is trading at €79.95/bbl, ¥8,439.69/barrel, and £67.13/bbl. In all of these cases, the market value of WTI is the same. What is different in each case is the value of the monetary unit (euros, yen, and British pounds, respectively) being used to calculate the ratio that expresses the price.
In terms of judging whether the price of WTI is high or low, here is the price that truly matters: 0.0602 ounces of gold per barrel (which can be written as Au0.0602/bbl). What this number means is that, right now, a barrel of WTI has the same market value as 0.0602 ounces of gold.
In order for gas prices to settle a little lower, gold prices too would have to take a bit of a nosedive. Ultimately, gas prices will go up – rather dramatically – if gold prices continue to rise at historic rates.
The scariest part of it all is that there's really no “ceiling” for gasoline prices. The dollar is an undefined fiat currency, so gold can continue rise to an unlimited value (in dollars).
Meanwhile, gold will hold strong in it's famous position as “the golden constant”.
In order to combat the rising gasoline costs, some experts worry that politicians may take some drastic measures...
This time around, the government may advocate for further payroll cuts while initiating higher taxes for energy producers. A similar scenario took place in the 70s:
During the 1970s, the toxic combination of a weak dollar, high tax rates, and onerous regulations introduced a new word into America’s economic vocabulary: stagflation. Reaganomics banished this word to the history books. Now, President Obama and Fed Chairman Bernanke are teaming up to give stagflation another try. It is not likely that Americans will like it any more this time around than they did 40 years ago.
Ron Paul: Have We Lost Our Minds?
Not So Fast On That Whole Economic Recovery Thing
Not so fast. Those that are publicly declaring that an economic recovery has arrived are ignoring a whole host of numbers that indicate that the U.S. economy is in absolutely horrendous shape. The truth is that the health of an economy should not be measured by how well the stock market is doing. Rather, the truth health of an economy should be evaluated by looking at numbers for things like jobs, housing, poverty and debt. Some of the latest economic statistics indicate that unemployment is getting a little bit worse, that the housing market continues to deteriorate, that poverty in America continues to soar and that our debt problem is worse than ever. If we were truly experiencing the kind of economic recovery that the United States has experienced after every other post-World War II recession we would see a sharp improvement across the board in most of our economic statistics. But that simply is not happening. Sadly, this is about as much of an "economic recovery" as we are going to get because soon the economy will be getting much worse. So enjoy this period of relative stability while you can.
The Obama administration would have us believe that unemployment in the United States has declined, but the truth is that the percentage of working age Americans that are employed has stayed very, very flat for more than two years and now there are some measures of unemployment that are actually getting worse.
For example, according to Gallup the unemployment rate in the United States has risen from 8.5% in December to 8.6% in January to 9.1% in February. The Obama administration would have us believe that it is actually going the other direction.
Initial unemployment claims are rising again. For the week ending March 3rd, they increased by 8,000 over the previous week to 362,000. This is not the kind of good news that people were hoping for.
What the U.S. economy could really use are millions of good jobs. But those are being shipped out of the country at a staggering pace.
Right now there are millions of Americans in their prime working years that are sitting at home wondering what to do with their lives. The average duration of unemployment in the United States continues to hover near a record high, and if we were truly experiencing an economic recovery it should have been falling by now.
But a lot of Americans have bought into the propaganda about an economic recovery and they are out running up huge amounts of debt once again. In January, consumer credit increased by much more than expected. The following is from a recent Reuters report....
Nonrevolving credit, which includes auto loans as well as student loans made by the government, rose $20.723 billion during the month. That was the biggest increase in dollar terms since November 2001, when credit was surging in the wake of the September 11 attacks in New York and Washington.
Don't fall into the trap of debt slavery. During the last recession millions of Americans lost their homes and most of what they owned because they got overextended.
Don't do it.
The U.S. housing market continues to deeply struggle as well. If we were really in an economic recovery housing would be bouncing back. But that is not happening. Just consider the following facts....
*The number of new homes sold in the United States continues to hover near a record low.
*U.S. home prices in the 4th quarter of 2011 were four percent lower than they were during the 4th quarter of 2010.
*According to CoreLogic, 22.8 percent of all homes with a mortgage in the United States were in negative equity as of the end of the 4th quarter of 2011. That was an increase from 22.1 percent in the third quarter.
Why are things still getting worse for the U.S housing market?
That is a really good question.
We should have seen some improvement by now.
But it isn't happening.
Also, poverty in America continues to explode.
For example, the number of Americans on food stamps has increased to 46.5 million - a brand new all-time record.
If we really were in an economic recovery, wouldn't that number be going down?
We should be thankful that the U.S. economy is not declining as rapidly as it was during 2008 and 2009. But what we are experiencing right now is not an economic recovery. It is simply just a bubble of false hope.
The big problem is that our nation is covered in an ocean of constantly expanding debt.
U.S. consumers are drowning in debt, U.S. businesses have pushed debt levels to the red line, and the U.S. financial system is massively overleveraged.
Of course government debt is our biggest debt problem of all.
All over the nation, state and local governments are on the verge of financial ruin.
If we were in the middle of an economic recovery, so many states would not be in crisis mode. A recent article in the Los Angeles Times declared that "California could run out of cash in March". As the economy continues to crumble we are going to hear a lot more of this kind of thing.
A lot of local governments around the nation are on the verge of total financial collapse. Stockton, California has announced that they will be defaulting on some debt payments, and Suffolk County in New York recently declared a fiscal emergency after discovering that it would rack up more than 500 million dollars of debt between 2011 and 2013.
Keep your eyes open for more news items like this in the months ahead.
Of course the biggest problem of all is the U.S. national debt and it continues to rapidly get worse.
According to the Congressional Budget Office, the U.S. government had a budget deficit of 229 billion dollars in the month of February. That is the worst one month budget deficit in the history of the United States.
The Congressional Budget Office also says that the U.S. government is now borrowing 42 cents of every single dollar that it spends.
Ouch.
The U.S. national debt has gotten more than 59 times larger since 1950.
The U.S. national debt is now more than 22 times larger than it was when Jimmy Carter became president.
Are there any words in the English language that are strong enough to describe how foolish we have been?
Of course we won't be able to accumulate so much debt indefinitely. At some point the trillion dollar deficits will stop and our false prosperity will disappear.
If you want to get an idea of what happens then, just take a look at Greece.
But Barack Obama and most members of the U.S. Congress don't really care about what they are doing to our future.
What they care about is winning the next election so that they can continue living their fabulous lives.
Barack Obama is supposed to be taking care of the American people, but instead he has been very busy taking care of the people who helped him get elected. Politics in America is all about money. Just check out the following very short excerpt from a recent article in the Washington Post....
More than half of Obama’s 47 biggest fundraisers, those who collected at least $500,000 for his campaign, have been given administration jobs. Nine more have been appointed to presidential boards and committees.
At least 24 Obama bundlers were given posts as foreign ambassadors, including in Finland, Australia, Portugal and Luxembourg. Among them is Don Beyer, a former Virginia lieutenant governor who serves as ambassador to Switzerland and Liechtenstein.
Washington D.C. is deeply corrupt and if you are waiting for our politicians to fix our problems you are going to be deeply disappointed.
The federal government is not going to save you.
Our politicians are not going to save you.
You better figure out how you are going to take care of yourself and your family in the years ahead because this is about as good as things are going to get.
This "economic recovery" is about to end and more pain is about to begin.
Time to Accumulate Gold and Silver?
Do you own enough gold and silver for what lies ahead?
If 10% of your total investable assets (i.e., excluding equity in your primary residence) aren't held in various forms of gold and silver, we at Casey Research think your portfolio is at risk.
After speaking at the Cambridge House conference last month and talking with many attendees, I came away convinced that most investors fall into one of two categories: those that hold an abundance of gold and silver (which tends to be physical forms only), and those with little or none. While both groups need to diversify, I'm a little more concerned about the second group. Here's why.
Regardless of what you think will happen over the remainder of this decade, one thing seems virtually certain: the value of paper money will be affected, perhaps dramatically. Even if the economy slips into deflation, the deflation wouldn't last long. A panicked Fed would print to the max and set off a wild rise in prices. This is why we're convinced currency dilution will not only continue but accelerate.
Let's take a look at what's happened so far with the value of our currency vs. gold, after accounting for the loss in purchasing power.

Both the US and Canadian dollar, after adjusting for their respective CPIs, have lost about a quarter of their purchasing power just since 2000. Concurrently, gold has increased dramatically in buying power, far outpacing the effects of inflation.
This is the core reason why I'm convinced we should hold our savings in gold and silver instead of dollars. Let's take a brief look at how gold and gold stocks might perform if the economy takes a turn for the worse…
What If We Enter a Recession or Depression?
Mayan prophecies aside, many of our panelists last month, including most of the senior Casey staff, believe economic, monetary, and fiscal pressures could come to a head this year. The massive build-up of global debt, continued reckless deficit spending, and the lack of sound political leadership to reverse either trend point to a potentially ugly tipping point. What happens to our investments if we enter another recession or – gulp – a depression?
Here's an updated snapshot of the gold price during each recession since 1955.

Clearly, one should not assume that gold will perform poorly during a recession. Even in the crash of 2008, gold still ended the year with a 5% gain. And with the amount of currency dilution we've undergone since that time, it seems more likely gold will rise in any economic contraction than fall. Indeed, if the response of government to a recession is more money printing, precious metals will be a critical asset to have in your possession.
Even if the gold price ends up flat or down this year, the CPI won't. Gold's enduring purchasing power is why we hold the metal.
How about gold stocks?

In spite of the debilitating 1970s that suffered from stagflation, price controls, three recessions, and the Vietnam war, gold producers rose over 600% while the S&P was basically flat. And that includes a roughly 65% fire-sale correction, much like we saw in 2008. To be clear, gold and silver stocks won't be immune to selloffs if a recession or worse temporarily clobbers our industry. But in the end, we're convinced they will prevail.
Don't lose patience with, or confidence in, your gold holdings. What happens to the price over any short period of time is only one chapter in the book of this bull market, and we think you'll be happy by the time that last chapter is written.
GOLD 1980 Vs. TODAY MUST WATCH!
GOLD 1980 Vs. TODAY MUST WATCH!
Gold "Trigger" Could Make Prices Explode
Gold just needs a trigger to launch it for the most spectacular rally since the late 70’s. I believe that trigger is likely to be the crash (or decline) of the stock markets.
This crash, if it occurs, is in anticipation of the inevitable bursting of the debt bubble. This is much like during the Great Depression when the stock markets crashed and bottomed before Total Debt as a % of GDP peaked in 1933. The Sovereign Debt-Crisis (especially in Europe) is the obvious sign that the debt bubble is bursting; with every additional unit of debt producing less or no increased GDP.
We do not have to only look that far, for an example of what is likely to come. Below, is a graphic that compares gold and the Dow, from June 2008 to May 2009.

The reason that I took these dates is because the period is similar (based on fractal analysis) to the current period. Gold bottomed in October 2008, more than four months before the Dow made a bottom. From the time of gold’s bottom, gold and Dow moved together at first, where after gold continued its rally, while the Dow was falling. It was also during this period that the gold stocks started a rally. However, this time, conditions are even better for gold stocks (more in the Gold Stocks Update).
Gold Long-Term
Currently, it is macro factors that are driving gold; therefore, once it starts moving up, it will often not make sense when compared to what other assets like stocks are doing. This is what greed and fear do: they make people to act irrationally. Fear and greed will push gold and silver higher at a phenomenal rate, despite major economic decline.
We, therefore, have to keep a close eye on the long-term charts, since the evidence for a massive rise should be there. I have done extensive analysis on gold and silver’s long term charts.
Update on bullish gold fractals:
The fractals identified in the previous alert appear to be playing out as predicted. Below, is an updated version of the chart from that alert:

The two patterns are indicated by points 1 to 10, to show how they are similar. Point 10 appears to be in now. The next important barrier is the downtrend line. Note that a short-term reaction, before piercing the line is possible.
Furthermore, should price pierce the line and rally, I would expect some kind of retest of the breakout area. Please note that these are just short-term movements, and it is anybody’s guess what will really happen. We have to focus on the big move, which is a significantly higher price over the coming months.
Gold/Silver Ratio
Below is a chart of the gold/silver ratio:

I have drawn a support line that was violated recently. This is a good signal for silver and gold price. We could see a quick move to 45, however, we are likely to see a retest of that 54 area, before that.
This could also mean that we could have a risk-aversion episode when we retest the breakdown level, with gold and the dollar rallying. A retest will be a good opportunity to load up on silver, since price is likely to pullback.
At some point - after retesting the breakdown area (if it does) – this ratio is likely to fall very fast. That might be the point when silver and gold really start to take-off.
Gold "Trigger" Could Make Prices Explode
Gold just needs a trigger to launch it for the most spectacular rally since the late 70’s. I believe that trigger is likely to be the crash (or decline) of the stock markets.
This crash, if it occurs, is in anticipation of the inevitable bursting of the debt bubble. This is much like during the Great Depression when the stock markets crashed and bottomed before Total Debt as a % of GDP peaked in 1933. The Sovereign Debt-Crisis (especially in Europe) is the obvious sign that the debt bubble is bursting; with every additional unit of debt producing less or no increased GDP.
We do not have to only look that far, for an example of what is likely to come. Below, is a graphic that compares gold and the Dow, from June 2008 to May 2009.
The reason that I took these dates is because the period is similar (based on fractal analysis) to the current period. Gold bottomed in October 2008, more than four months before the Dow made a bottom. From the time of gold’s bottom, gold and Dow moved together at first, where after gold continued its rally, while the Dow was falling. It was also during this period that the gold stocks started a rally. However, this time, conditions are even better for gold stocks (more in the Gold Stocks Update).
Gold Long-Term
Currently, it is macro factors that are driving gold; therefore, once it starts moving up, it will often not make sense when compared to what other assets like stocks are doing. This is what greed and fear do: they make people to act irrationally. Fear and greed will push gold and silver higher at a phenomenal rate, despite major economic decline.
We, therefore, have to keep a close eye on the long-term charts, since the evidence for a massive rise should be there. I have done extensive analysis on gold and silver’s long term charts.
Update on bullish gold fractals:
The fractals identified in the previous alert appear to be playing out as predicted. Below, is an updated version of the chart from that alert:
The two patterns are indicated by points 1 to 10, to show how they are similar. Point 10 appears to be in now. The next important barrier is the downtrend line. Note that a short-term reaction, before piercing the line is possible.
Furthermore, should price pierce the line and rally, I would expect some kind of retest of the breakout area. Please note that these are just short-term movements, and it is anybody’s guess what will really happen. We have to focus on the big move, which is a significantly higher price over the coming months.
Gold/Silver Ratio
Below is a chart of the gold/silver ratio:
I have drawn a support line that was violated recently. This is a good signal for silver and gold price. We could see a quick move to 45, however, we are likely to see a retest of that 54 area, before that.
This could also mean that we could have a risk-aversion episode when we retest the breakdown level, with gold and the dollar rallying. A retest will be a good opportunity to load up on silver, since price is likely to pullback.
At some point - after retesting the breakdown area (if it does) – this ratio is likely to fall very fast. That might be the point when silver and gold really start to take-off.
Whole Lot Of Charts here ;)-
$PALL
$CAD
$USD
$SILVER
$GOLD
$WTIC - Daily Chart
$EUR Chart
$VIX - Daily Chart
$HUI - Daily Chart
$NYA - Daily Chart
$NDX - Daily Chart
$COMPQ - Daily Chart
$INDU - Daily Chart
$SPX - Daily Chart
FXCM
BOOM
BIB
RTIX
IGXT
IBM
ALU
PFE
CHK
IDCC
DUK
JEF
MTD
SNP
ALJ
UPL
AWH
PXP
OIS
DTG
N
BRY
YRCW
SIRI
GRPN
INTC
YHOO
CSCO
MSFT
INHX
CLWR
RIMM
PANL
HANS
GMCR
EVEP
MELI
ULTA
HIFS
SBUX
GBG
CME
RTK
GSX
RNN
NGD
CBG
LNG
NG
GSS
YMI
VTG
GHM
DSLV
NOG
BTI
SLI
MFN
CHOC
EIO
MCF
TIS
PENNY STOCKS
TSNP
SRCP
LBSR
THRA
FFGO
SAPX
EXPU
ENTI
TRDY
MMTE
FOGC
MASP
EPTI
KNOS
ACTN
ANSH
RAYS
CBAI
MFGLQ
TPIV
CAMS
LJWY
MDFI
MPX
HAR
MEG
OCZ
QQQ
CIM
JPM
GIII
AAPL
FTWR
WFC
S
GE
F
BAC
JBII
WAMUQ
MLXO
CAMS
EVCA
THWI
FOGC
PSPW
CMGO
BIEL
SRSR
RBTI
PMI
GRDO
DUSS
ZPCM
SDRC
SRRY
SPOR
PPRW
PHAR
PDOS
PDGO
NTUR
NRTI
NVIV
ONTC
NPHC
NEON
NCEN
MDGC
CVSL
CBBD
CHBT
CLSP
CNLG
DRFO
EDIG
EXTO
FCCN
FEEL
HKFI
ICBU
VELA
VSHC
WQNI
XCEL
ZMTP
WGBS
WWAG
VMCI
VCTY
UYMG
TEMO
HLCS
BVTI
CBWP
BMPI
BLVT
BORK
BUGS
COPY
CXTO
EPEO
LRTR
NDBE
OPMG
OVIT
PTSC
QMCI
RFNN
SMNG
SOON
TBBC
BRYN
CPQQ
CZFS
ENCO
IMCI
MDFI
LCHL
TLAG
SNAX
SLUP
RLTR
MCET
LLEG
LGDI
HWIC
BLQN
BKRS
BLSP
BRGO
CMXI
DUSS
ERFB
FNCX
PWSV
UCRP
ZAAP
TRUE
SOLU
SMKY
SKNY
SIOR
PFSD
OTCM
NXRA
NOEC
NGHI
MYFT
LBSR
KATX
IMGG
ICTY
HYGN
GBLE
FRMC
CONX
BNLB
FOFU
WRIT
WTKN
WWPWE
TBIO
SUGO
ABCP
AAVG
AAST
AAPT
AAPH
AAIR
AAGC
AACS Chart
AAAA Chart
CURX
PEIX
CURX
JER1
Thats a good one had my eye on it for a little while
JER1
Multi Pennies coming soon Stay tuned!'
JER1
Perspectives On A Printing Press Pause
It would appear, given the actions and rhetoric of the last week or so, that global central bank printing presses have been switched to 'pause' mode and allowed to cool as implicit inflation 'energy' rears its economic-growth-dragging head around the world (as the bears told us earlier). Whether this leads to a slow grind higher or a tactical correction is the question Morgan Stanley considers in a recent note and their answer is that bullish sentiment, 'under-appreciated' risks, and 'tranquil' markets justify a cautious asset allocation. The focus has switched much more to growth, likely why we have not seen a greater deterioration post-printing yet, but this leaves the market much more sensitive to data surprises(as the backstop of QE has been removed for now). Simply put, we tend to agree with MS' view (given our previous discussions of the volatility surface) that as event and growth risks linger, and with valuations no longer cheap in most cases, expectations of a continued grind higher without a tactical correction are overly confident.
Morgan Stanley: A Liquidity Lull
After watching last week’s events unfold, it seems that the central bank printing presses could cool off for awhile. ... The apparent success that the LTRO has had in reducing tail risks, at least in the near term, means that further ECB liquidity injections don’t appear likely any time soon. If this doesn’t come as a surprise to most investors, perhaps Chairman Bernanke’s testimony before Congress did. The market interpreted his acknowledgement that recent employment data has gotten better as a signal that QE3 is now less likely. The ripple effect of no QE by both the Fed and ECB could mean less easing in other regions.
The prospect of less monetary easing puts an even greater focus on growth. Our view has been that growth, not QE, was the primary driver of risk assets over the past few years, and the modest market reaction to the diminished prospects of more QE supports that. That direct relationship between growth and the markets should only be stronger if more QE is on hold. But growth also matters indirectly because it drives Fed action. Given the bullish sentiment of most investors, the market could continue to grind higher on a “heads we win, tails you lose” mentality regarding growth: the market rises with good data, but it also rises with bad data because the Fed (and ECB) will open up the liquidity spigot as needed. Nothing like having your cake and eating it too!
Alas, this sanguine view isn’t supported by the growth data sending a strong risk-on signal. Indeed, US data continues to be mixed, with labor market improvement offset by weakness in personal spending and income. Most confusing is that we had a sizable drop in our US 1Q GDP tracking estimate from 2.2% in late January down to 1% today, at the same time that Chairman Bernanke acknowledged the stronger data.
Now with the price of oil rising on Middle East tensions, and gasoline prices potentially reaching demand-destructive levels during the summer driving season, the risks to growth can’t be downplayed.
Grinding Higher or Tactical Correction?
The economic data is providing a bounty for investors and strategists alike: there is something for everyone to justify their view. Bulls can point to the improving labour market conditions, while bears can emphasize weak income growth, persistently high leverage, or looming fiscal tightening. Thus, there is ammunition to argue both that markets can continue to grind higher and that a tactical correction is likely. Putting aside these subjective economic assessments, the price action also provides context for assessing the potential near term market outcomes. For starters, volatility for all asset classes has fallen significantly over the past few months, returning to the lows prior to last summer’s sell-off, with credit being the exception (Exhibit 2).
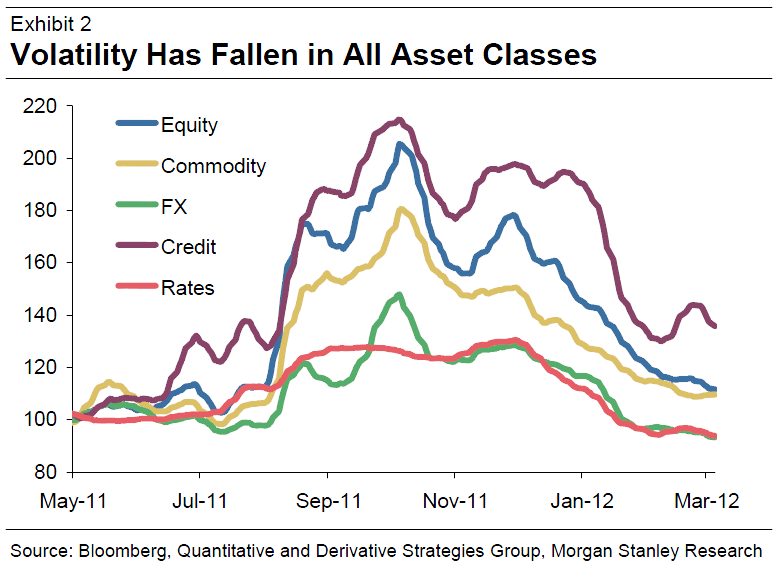
Focusing specifically on equities, three aspects of volatility tell the story of current investor thinking. First, realized volatility has fallen to exceptionally low levels. This reflects the slow steady grind higher, as well as the Fed effectively crushing volatility. However, since this is also occurring at low volumes, it suggests caution and complacency to some degree. Second, the implied volatility term structure is once again steep (its normal condition), which is a complete reversal from last August (Exhibit 4).
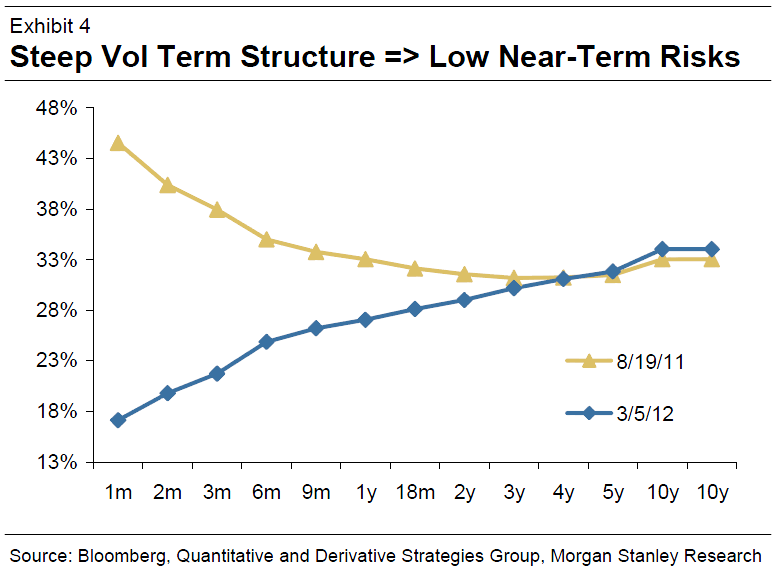
Back then, the risks appeared to be front-loaded after the US credit rating downgrade, and on fears of a double dip recession and sovereign stress in Europe. The current low short term vol speaks to the fact that investors are fairly calm about the near term. However, the third aspect of volatility, the steep skew, implies that both tails are relatively fat, with investors willing to pay for downside and upside protection.
Putting this all together, it suggests a market in which investors are fairly comfortable with the view that risk assets can continue to grind higher in the near term, but they’re also fearful of the other shoe dropping, whether on growth, Europe, or something else. And the interest in both tails is consistent with different interpretations of the growth data.
The combination of bullish sentiment, underappreciated risks, and “tranquil” markets justifies a cautious asset allocation, in our view. The low volatility suggests a complacency that isn’t warranted given the risks, specifically, on growth because of higher oil prices and in Europe after the LTRO and Greece bailout. On the latter, it’s not obvious if a firewall exists around the rest of the periphery (or how it could work). Without a proper firewall, Portugal is next in line for a potential debt restructuring, and the rise in its sovereign CDS spread in the wake of the Greece agreement is a disconcerting sign. In addition, the move by Spain to relax its deficit reduction is also a red flag.
With these risks lingering, and valuations no longer overly cheap, we are clearly cautious on the markets, even though we admittedly fret about continued grind higher without a tactical correction. Nonetheless, we maintain our view that investors should continue to take risk down on the margin and implement tail hedges.

