 News
News  Market Data
  Discover
Support: 888-992-3836
Copyright © 2023 InvestorsHub Inc.


Attempting to add nano-particles of (K) to bottle of bucky-ball (C)60 to make it float in air..what are you doing?
tothe
![]()
Attempting to add nano-particles of (K) to bottle of bucky-ball (C)60 to make it float in air..what are you doing?
Register for free to join our community of investors and share your ideas. You will also get access to streaming quotes, interactive charts, trades, portfolio, live options flow and more tools.
Register for free to join our community of investors and share your ideas. You will also get access to streaming quotes, interactive charts, trades, portfolio, live options flow and more tools.
Attempting to add nano-particles of (K) to bottle of bucky-ball (C)60 to make it float in air..what are you doing?
Tradenride; Agree, time to work on the Side Trap recovery strategy.
https://www.swing-trade-stocks.com/sidetrap-chart-pattern.html
Money Tingz ; Ask my Lawyer re. insider trading.
https://securities-law-blog.com/?s=Insider+trading
Marcis; The buying is not odd. You are witnessing Smart Traders with decades of experience doing their thing with $10,000 leveraged bets.
Surfkast..chart~~~; Thanks for heads-up promoting George Sharp. Now I see why GVSI so popular on IHUB and the Social Media venue. This past week Sharp made a few millionaires trading in GVSI just on board noise! Rule: Love-em or hate-em: George's biggest Pumpers are his Detractors.
*** Buy on this dip today...it is a gift!
*** Play the Herd of Traders with the chart, George is protecting the shareholders and keeping them informed which is more than other Pinky CEOs that I am holding& charting!
 BULLISH
https://stockcharts.com/h-sc/ui?s=EMGE&p=D&yr=0&mn=3&dy=10&id=p24986097784&listNum=23&a=1113701411

Uh no. Neither the Board nor the CEO has control over the market. Share price is determined by buying and selling. The board and the CEO have a responsibility to run the company in the best interest of the shareholders, but never does that assure an increase in the share…
— George Sharp - Advocate for truth in the OTC (@GeorgeASharp) February 7, 2024
EMGE chart~~~ Key Reversal for a retracement bottom setup... for an emphatic seller flush you cannot have it any better than that!
After 4 days retail support is back.
Today's low flipped the PSAR to the advantage of the Shorts is a bummer though. 
* A brief on chart Indicators
https://investorshub.advfn.com/boards/read_msg.aspx?message_id=146368673
chart & TA post thread
https://thepatternsite.com/KRD.html
https://thepatternsite.com/BullEngulfing.html
https://thepatternsite.com/VerticalRunUp.html
https://school.stockcharts.com/doku.php?id=technical_indicators:parabolic_sar
https://stockcharts.com/h-sc/ui?s=EMGE&p=D&yr=0&mn=3&dy=10&id=p24986097784&listNum=23&a=1113701411

Agree; Sometime in the next 26 days (March,15 BTW) we should retrace back to .0130.
* Expect 26 days of churning in a "gradual up" and plenty of entertainment on the board. 
* Primary trend is up: we have an MA50/100/200 golden pancake stack....rare in the OTC.
https://thepatternsite.com/VerticalRunUp.html
https://stockcharts.com/h-sc/ui?s=GVSI&p=D&yr=0&mn=3&dy=10&id=p24986097784&listNum=23&a=1113701411

GVSI Chart~~~ The mere mention yesterday of March,15 (the day Caesar was shot) results in the largest OTC seller flush of 2024.
** Today's candlestick pattern.
https://thepatternsite.com/TweezersBottom.html
** Six day chart pattern.... -130% Fib retracement.
https://thepatternsite.com/VerticalRunUp.html
https://stockcharts.com/h-sc/ui?s=GVSI&p=D&yr=0&mn=3&dy=10&id=p24986097784&listNum=23&a=1113701411

I agree Cross; We are so easy to chart that I am hard-pressed to find a bearish indicator.
GDVM midweek chart chart~~~ Continuation pattern, leg #1 up to a higher consolidation step possibly at 0.020 support or higher wherever the traders want to do the churning. Because Melvin is always late we may see the 10K on April fools day so we have quite a few consolidation steps ahead of us.
* A brief on chart Indicators
https://investorshub.advfn.com/boards/read_msg.aspx?message_id=146368673
chart & TA post thread
Daily~~~ I expect Measured Move Up step #1 sometime this week...with 1,000 shareholders of record, small free trading wedge to stand on a tight float things will get interesting.
https://thepatternsite.com/ThreeWhiteSoldiers.html
https://thepatternsite.com/mmu.html
https://thepatternsite.com/KRD.html
https://thepatternsite.com/pullbacks.html
https://thepatternsite.com/at.html
https://school.stockcharts.com/doku.php?id=chart_analysis:chart_patterns:ascending_triangle_continuation
https://school.stockcharts.com/doku.php?id=trading_strategies:bollinger_band_squeeze
https://investmentu.com/relative-strength-index-rsi-ultimate-overbought-oversold-indicator/
https://school.stockcharts.com/doku.php?id=technical_indicators:parabolic_sar
https://stockcharts.com/h-sc/ui?s=GDVM&p=D&yr=0&mn=3&dy=10&id=p24986097784&listNum=23&a=1113701411

EMGE charts~~~ 'Sigh'; looks like a poor scam alert Troll Bear got stopped out today on a minor low and is really pissed off. Like in Yellowstone Park stay at least 25 yards away as we hike North.
* Current .0017 low today is yesterday's support which also happens to be the MA(200).
* A brief on chart Indicators
https://investorshub.advfn.com/boards/read_msg.aspx?message_id=146368673
chart & T/A thread post
2dy 5min~~~
VWAP chart refresher. EMA(30) for 21/2 hours, EMA(79) is all day and VWAP resets each day
https://school.stockcharts.com/doku.php?id=technical_indicators:vwap_intraday
https://stockcharts.com/c-sc/sc?s=EMGE&p=5&yr=0&mn=0&dy=2&id=p69741074503&a=1100650802&listNum=23

https://stockcharts.com/h-sc/ui?s=EMGE&p=D&yr=0&mn=3&dy=10&id=p24986097784&listNum=23&a=1113701411

Morrison probably wants to do more videos but I assume with other M&A activity Counsel is advising a gag order.
https://www.investopedia.com/terms/q/quietperiod.asp
Business.Plan.Video: February 2023 with CEO Jim Morrison
https://apollobiowellness.com/month-in-review/
Note: This and section 1 & 2 has been added to the IBOX
GDVM range chart~~~ Showing Michaud group activity Oct.-Dec.2022. They make clever use of trailing stops on breakouts.
* Trailing stop placement on breakouts (or minor highs) using previous bar's higher low. Using the rule the sell was at .068 and not the previous day's high at .1108, I imagine if you used a 2hr intraday chart on day #2 you could catch bars closer to .1108. 
https://thepatternsite.com/ElevatorStop.html
* A brief on chart Indicators
https://investorshub.advfn.com/boards/read_msg.aspx?message_id=146368673
https://stockcharts.com/h-sc/ui?s=GDVM&st=2022-09-21&en=2023-01-23&dy=0&id=p24986097784&listNum=23&a=1113701411


GDVM weekly charts~~~January continuation pattern closed with four weeks of higher closing highs. This is a good start for 2024.
* A brief on chart Indicators
https://investorshub.advfn.com/boards/read_msg.aspx?message_id=146368673
chart & TA post thread
DolphinTom's 18 month weekly~~~ Forth week of higher closing highs that began with 2024 bullish Weekly Upside Reversal. PPO is about to cross the signal line... soon all our ducks will be lined up.
https://thepatternsite.com/WeeklyRevsUpside.html
https://stockcharts.com/h-sc/ui?s=GDVM&p=W&yr=1&mn=6&dy=10&id=p61375109690&a=1400342989&listNum=1

1yr weekly collinear chart~~~ MACD reset this week, PPS could close over 13 week EMA next week.
https://stockcharts.com/h-sc/ui?s=GDVM&p=W&yr=1&mn=0&dy=0&id=p46696794371

2dy 5min~~~ Checking out Fridays late action when the Bull moved to a higher pasture from the Penney.
VWAP chart refresher. EMA(30) for 21/2 hours, EMA(79) is all day and VWAP resets each day
https://school.stockcharts.com/doku.php?id=technical_indicators:vwap_intraday
https://stockcharts.com/c-sc/sc?s=GDVM&p=5&yr=0&mn=0&dy=2&id=p69741074503&a=1100650802&listNum=23

Daily~~~ I think someone was testing investor patience to sell all week as close to testing .010 to elicit a reaction. Well you have a lot of investors locked here in the float and if a Bear wants play stupid games the Bulls will take so much poking in the ass before you get a snorting reaction!
https://thepatternsite.com/KRD.html
https://thepatternsite.com/pullbacks.html
https://thepatternsite.com/at.html
https://school.stockcharts.com/doku.php?id=chart_analysis:chart_patterns:ascending_triangle_continuation
https://school.stockcharts.com/doku.php?id=trading_strategies:bollinger_band_squeeze
https://investmentu.com/relative-strength-index-rsi-ultimate-overbought-oversold-indicator/
https://school.stockcharts.com/doku.php?id=technical_indicators:parabolic_sar
https://stockcharts.com/h-sc/ui?s=GDVM&p=D&yr=0&mn=3&dy=10&id=p24986097784&listNum=23&a=1113701411

Well, I slapped the .0020 ask today and got filled at .0019 but the 3,000 share trade #82 shows up as a sell! Something tells me that the OTC is not exactly a Bambi and Thumper playground. All I wanted to do was average down and poke the monster 800,000 share ask with a small stick to see what happens.
Order Date 02/02/2024 03:04:11 PM ET
EMGE weekly charts~~~ Perfect breakout week and closing over 50 week MA.
* A brief on chart Indicators
https://investorshub.advfn.com/boards/read_msg.aspx?message_id=146368673
chart & T/A thread post
1yr technical weekly~~~ For what it is worth August 2022 was the last close over the MA(50).
https://thepatternsite.com/rectbots.html
https://thepatternsite.com/PPRD.html
https://stockcharts.com/h-sc/ui?s=EMGE&p=W&yr=1&mn=6&dy=10&id=p61375109690&a=1400342989&listNum=1

1yr weekly;
See the BB squeeze...not to be confused with the other type of squeeze. 
https://school.stockcharts.com/doku.php?id=trading_strategies:bollinger_band_squeeze
https://stockcharts.com/h-sc/ui?s=EMGE&p=W&yr=1&mn=0&dy=0&id=p59798003225

EMGE charts~~~ Three days into the Bull PSAR flip results. So we experience more noise with expected social reaction by Broker Dealers whom are being hit with the ominous signal to cover.
Why is the DTC continuing to allow distribution of counterfeit unsolicited shares?
Outlook: We are still in retracement mode so hang on with dollar cost averaging accumulation. Sellers will get flushed out eventually, watch Level2 for support and resistance to flip into a higher continuation step North.
* A brief on chart Indicators
https://investorshub.advfn.com/boards/read_msg.aspx?message_id=146368673
chart & T/A thread post
2dy 5min~~~
https://www.swing-trade-stocks.com/traders-action-zone.html
VWAP chart refresher. EMA(30) for 21/2 hours, EMA(79) is all day and VWAP resets each day
https://school.stockcharts.com/doku.php?id=technical_indicators:vwap_intraday
https://stockcharts.com/c-sc/sc?s=EMGE&p=5&yr=0&mn=0&dy=2&id=p69741074503&a=1100650802&listNum=23

Daily chart~~~ Read about the Shorting tool.
https://school.stockcharts.com/doku.php?id=technical_indicators:parabolic_sar
https://thepatternsite.com/VerticalRunUp.html
https://stockcharts.com/h-sc/ui?s=EMGE&p=D&yr=0&mn=3&dy=10&id=p24986097784&listNum=23&a=1113701411

EMGE charts~~~ Intraday & daily shows price action & Vertical Run Up now in retracement step..
* A brief on chart Indicators
https://investorshub.advfn.com/boards/read_msg.aspx?message_id=146368673
chart & T/A thread post
2dy 5min~~~
https://www.swing-trade-stocks.com/traders-action-zone.html
VWAP chart refresher. EMA(30) for 21/2 hours, EMA(79) is all day and VWAP resets each day
https://school.stockcharts.com/doku.php?id=technical_indicators:vwap_intraday
https://stockcharts.com/c-sc/sc?s=EMGE&p=5&yr=0&mn=0&dy=2&id=p69741074503&a=1100650802&listNum=23

https://thepatternsite.com/VerticalRunUp.html
https://stockcharts.com/h-sc/ui?s=EMGE&p=D&yr=0&mn=3&dy=10&id=p24986097784&listNum=23&a=1113701411

Good idea Gail. In 2007 on the KOIL board I gifted Moderator xZx with an one year IHUB subscription all for a $100,000 tip.
This was his first IHUB subscription too and he has been a  subscribed member ever since. He first introduced me to charts and is one of Giants whose shoulders I stand on.

EMGE 3yr monthly chart~~~ I think we have an impressive start for a January. It took 5 months for the R/S cancellation and 9 months of no dilution to be finally realized by the OTC market. If we were in a higher exchange where DD & Research drives the mentality we would not see a January like this. Reaction time in the OTC sort of lags, IMO, except for PB whom I think we all owe a finders fee.
* A brief on chart Indicators
https://investorshub.advfn.com/boards/read_msg.aspx?message_id=146368673
chart & T/A thread post
Log scale~~~ September was Reverse Split cancellation month and the start of a 4 month consolidation leading to a January breakout.
https://stockcharts.com/c-sc/sc?s=EMGE&p=M&yr=3&mn=3&dy=10&id=p99448199858&a=1474492466&listNum=1

https://stockcharts.com/c-sc/sc?s=EMGE&p=M&yr=3&mn=0&dy=0&i=p04068199646&a=548294540&r=1507082382884

EMGE charts(s)~~~ Intraday showing Position Traders are buying the break out but the float is so tight that any attempt for discreet buying is out the window.
Daily chart showing huge momentum volume with PVO, all other indicators are squiggly lines going haywire with breakout.., we are having fun though.
* A brief on chart Indicators
https://investorshub.advfn.com/boards/read_msg.aspx?message_id=146368673
chart & T/A thread post
2dy 5min~~~ Thank goodness we have sellers so the Position Traders can move in without disrupting the tight float.... too much that is.
https://www.swing-trade-stocks.com/traders-action-zone.html
VWAP chart refresher. EMA(30) for 21/2 hours, EMA(79) is all day and VWAP resets each day
https://school.stockcharts.com/doku.php?id=technical_indicators:vwap_intraday
https://stockcharts.com/c-sc/sc?s=EMGE&p=5&yr=0&mn=0&dy=2&id=p69741074503&a=1100650802&listNum=23

* PVO is a MOMO indicator for VOLUME ~~~ we are way,way over the signal line.
https://school.stockcharts.com/doku.php?id=technical_indicators:percentage_volume_oscillator_pvo
https://stockcharts.com/h-sc/ui?s=EMGE&p=D&yr=0&mn=3&dy=10&id=p24986097784&listNum=23&a=1113701411

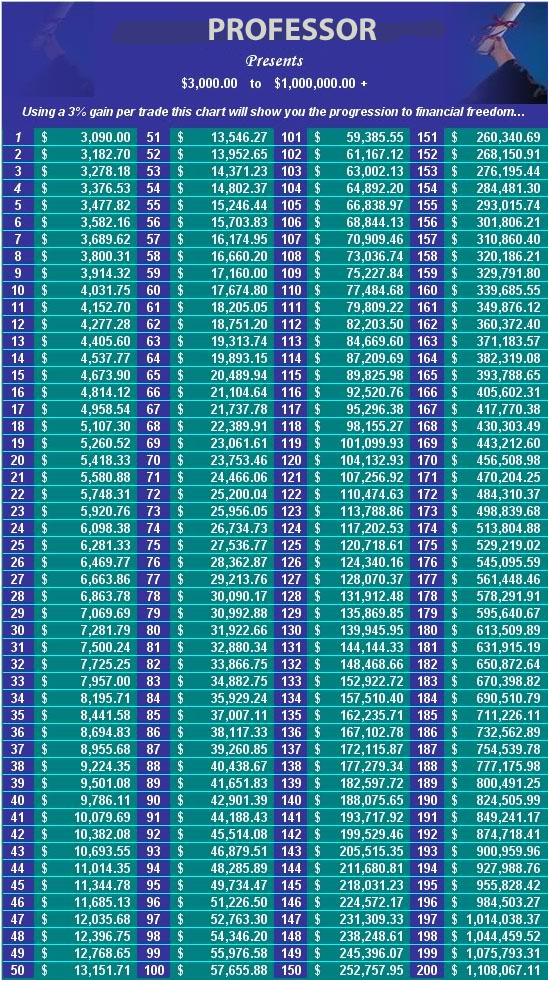
Hey Chuck and eb0783 , 90 days compounded at 3% would be more a realistic target price, right?
this post is NOT on my chart thread
https://edgarsolutions.com/resources/sec-filing-calendar/
https://stockcharts.com/h-sc/ui?s=GDVM&p=W&yr=1&mn=0&dy=0&id=p62916881569

EMGE last.month.float was 4mil..and today volume 10mil.? Ripple effect from August 14 is showing up, IMO
   Authorized Shares   7,500,000,000 01/26/2024
 Outstanding Shares      426,951,112 05/10/2023
         Restricted      134,427,516 01/26/2024
       Unrestricted      292,523,596 01/26/2024
       Held at DTC       220,620,568 01/26/2024
             Float         4,083,089 12/29/2023
 https://www.otcmarkets.com/stock/EMGE/security

GDVM weekly chart(s)~~~January reversal pattern in effect showing higher highs and lows. The daily chart is 'more exciting' with it's Ascending Triangle and one month BB pinch.... this is a screaming sideways continuation pattern, nothing to get excited about so far.
* A brief on chart Indicators
https://investorshub.advfn.com/boards/read_msg.aspx?message_id=146368673
chart & TA post thread
 BULLISH
DolphinTom's 18 month weekly ~~~ with it's eye opening AccumDist line and locked float, then there is that MACD bull reset this month.
https://thepatternsite.com/WeeklyRevsUpside.html
https://stockcharts.com/h-sc/ui?s=GDVM&p=W&yr=1&mn=6&dy=10&id=p61375109690&a=1400342989&listNum=1

Daily~~~ Locked in for April 10K.
https://school.stockcharts.com/doku.php?id=chart_analysis:chart_patterns:ascending_triangle_continuation
https://school.stockcharts.com/doku.php?id=trading_strategies:bollinger_band_squeeze
https://investmentu.com/relative-strength-index-rsi-ultimate-overbought-oversold-indicator/
https://school.stockcharts.com/doku.php?id=technical_indicators:parabolic_sar
https://stockcharts.com/h-sc/ui?s=GDVM&p=D&yr=0&mn=3&dy=10&id=p24986097784&listNum=23&a=1113701411

EMGE chart(s)~~~ Bull PSAR now on daily, a Shorting tool that says "cover ASAP" !
* A brief on chart Indicators
https://investorshub.advfn.com/boards/read_msg.aspx?message_id=146368673
chart & T/A thread post
2dy 5min~~~
VWAP chart refresher. EMA(30) for 21/2 hours, EMA(79) is all day and VWAP resets each day
https://school.stockcharts.com/doku.php?id=technical_indicators:vwap_intraday
https://stockcharts.com/c-sc/sc?s=EMGE&p=5&yr=0&mn=0&dy=2&id=p69741074503&a=1100650802&listNum=23

https://school.stockcharts.com/doku.php?id=technical_indicators:parabolic_sar
https://stockcharts.com/h-sc/ui?s=EMGE&p=D&yr=0&mn=3&dy=10&id=p24986097784&listNum=23&a=1113701411

INQD chart~~~ Two patterns for January effect . Well earned 50% retrace from profit taking but Long term Position/Momentum Traders are keeping the Scalpers hanging at .0012 support that has a testing history that stretches into November!
* A brief on chart Indicators
https://investorshub.advfn.com/boards/read_msg.aspx?message_id=146368673
chart & TA post thread
BULLISH
https://school.stockcharts.com/doku.php?id=chart_analysis:fibonacci_retracemen
https://www.swing-trade-stocks.com/traders-action-zone.html
https://thepatternsite.com/flags.html
https://school.stockcharts.com/doku.php?id=chart_analysis:chart_patterns:flag_pennant_continuation
https://thepatternsite.com/VerticalRunUp.html
https://stockcharts.com/h-sc/ui?s=INQD&p=D&yr=0&mn=6&dy=10&id=p24986097784&listNum=23&a=1113701411

EMGE share structure re-edit to reflect May 10. Thanks for the heads up, I found that in the filings too but needed you to urge me to repost it.
* Also in agreement that there is no distribution in the last nine months. Chart shows positive diversion of OBV from AccumDist.
https://www.otcmarkets.com/otcapi/company/financial-report/370108/content
   Authorized Shares   7,500,000,000 01/26/2024
 Outstanding Shares      426,951,112 05/10/2023
         Restricted      134,427,516 01/26/2024
       Unrestricted      292,523,596 01/26/2024
       Held at DTC       220,620,568 01/26/2024
             Float         4,083,089 12/29/2023
 https://www.otcmarkets.com/stock/EMGE/security
Looks promising
EMGE share structure
   Authorized Shares   7,500,000,000 01/26/2024
 Outstanding Shares      426,951,112 01/26/2024
         Restricted      134,427,516 01/26/2024
       Unrestricted      292,523,596 01/26/2024
       Held at DTC       220,620,568 01/26/2024
             Float         4,083,089 12/29/2023
 https://www.otcmarkets.com/stock/EMGE/security
EMGE chart (s)
~~~ OBV shows no dilution after August dump. CMF showing sporadic accumulation... pre loading?
https://stockcharts.com/h-sc/ui?s=EMGE&p=D&yr=1&mn=0&dy=10&id=p24986097784&listNum=23&a=1113701411

~~~ August 14 detail
https://stockcharts.com/h-sc/ui?s=EMGE&st=2023-08-01&en=2023-09-05&dy=0&id=p24986097784&listNum=23&a=1113701411

weekly~~~ BB squeeze and PPO signal line crossover.
https://stockcharts.com/h-sc/ui?s=EMGE&p=W&yr=2&mn=0&dy=10&id=p61375109690&a=1400342989&listNum=1

ABQQ chart~~~ Measured Move Up consolidation step# 3. So we see a new high in 27 days if we go with the conservative book?
** The PSAR is about to flip bullish telling the shorts to cover so expect some noise from Crowin.
https://school.stockcharts.com/doku.php?id=technical_indicators:parabolic_sar
https://thepatternsite.com/VerticalRunUp.html
https://thepatternsite.com/mmu.html
https://stockcharts.com/h-sc/ui?s=ABQQ&p=D&yr=0&mn=6&dy=10&id=p24986097784&listNum=23&a=1113701411

GDVM chart~~~ We closed today at a four week overhead resistance which is exactly at MA(50)... this is bound to happen in a continuation pattern where CMF(20) showing positive buying pressure pushing over 20%. Tomorrow is Friday, Friday's are usually red so I believe we will be testing overhead resistance all day.... it depends on one million volume days and I don't care if it is red or green days as long as I have my fuzzy dice on the dashboard of my car with my plastic JC.
* A brief on chart Indicators
https://investorshub.advfn.com/boards/read_msg.aspx?message_id=146368673
chart & TA post thread
** "Regardless of where they form, ascending triangles are bullish patterns that indicate accumulation".
* We have gone five consecutive days at 1mil. volume traded over the vertical volume bars EMA(30)...I don't know when we last saw that.
https://thepatternsite.com/CPRD.html
https://thepatternsite.com/at.html
https://school.stockcharts.com/doku.php?id=chart_analysis:chart_patterns:ascending_triangle_continuation
https://stockcharts.com/h-sc/ui?s=GDVM&p=D&yr=0&mn=3&dy=10&id=p24986097784&listNum=23&a=1113701411

GDVM collinear chart~~~ Second White Marubozo in.a.week. Today was the highest close of 2024 so lets call it 'blue sky 2024'. So the Bearish Naysayers keep calling a plunge into the trips...but funny, we have not had any PPS erosion starting from all of December into today! It looks like we are locking into a Continuation Pattern that should last into the first quarter '24. CMF(20) shows increasing buying pressure since December's Pearl Harbor Day.
* A brief on chart Indicators
https://investorshub.advfn.com/boards/read_msg.aspx?message_id=146368673
chart & TA post thread
https://thepatternsite.com/WhiteMarubozu.html
https://stockcharts.com/h-sc/ui?s=GDVM&p=D&yr=0&mn=3&dy=0&id=p63902367605&a=642509717

GDVM midweek chart(s)~~~ We closed over .014 for the first time in four weeks. Indicators are bullish and we are in a three week BB squeeze.
* A brief on chart Indicators
https://investorshub.advfn.com/boards/read_msg.aspx?message_id=146368673
chart & TA post thread
2d 5min~~~~ So all day buys over sells 6:1 then at 3:37 repeated slamming .014 overhead resistance until we broke and then closed at $.0142.
VWAP chart refresher. EMA(30) for 21/2 hours, EMA(79) is all day and VWAP resets each day
https://school.stockcharts.com/doku.php?id=technical_indicators:vwap_intraday
https://stockcharts.com/c-sc/sc?s=GDVM&p=5&yr=0&mn=0&dy=2&id=p69741074503&a=1100650802&listNum=23

Daily
https://school.stockcharts.com/doku.php?id=trading_strategies:bollinger_band_squeeze
https://investmentu.com/relative-strength-index-rsi-ultimate-overbought-oversold-indicator/
https://school.stockcharts.com/doku.php?id=technical_indicators:parabolic_sar
https://stockcharts.com/h-sc/ui?s=GDVM&p=D&yr=0&mn=3&dy=10&id=p24986097784&listNum=23&a=1113701411

IQST share structure & chart~~~ November-December wash sales done. We did have late December buyers profit taking this week. January is the Pre-Loader's month with Traders doing serious decision making to set targets or just go long for 2024... That two weeks in December with repeated testing of $0.140 was very, very encouraging.
* A brief on chart Indicators
https://investorshub.advfn.com/boards/read_msg.aspx?message_id=146368673
chart & TA post thread
       Authorized Shares: 300,000,000 09/30/2021
      Outstanding Shares: 171,529,630 01/08/2024
                          151,530,378 08/15/2022
                          151,319,011 06/20/2022
                          149,357,358 04/11/2022
                          147,357,358 01/17/2022
                          141,717,358 09/30/2021
                          118,133,432 12/31/2020
             Restricted:  6,514,999 01/08/2024
                          7,085,341 08/15/2022
                          7,068,974 06/20/2022
                          5,107,321 04/11/2022
                          5,530,207 01/17/2022
           Unrestricted: 165,014,631 01/08/2024
                         144,445,037 08/15/2022
                         144,250,037 04/11/2022
                         141,827,151 01/17/2022
            Held at DTC: 161,211,889 01/08/2024
                         144,247,309 06/20/2022
                         143,117,931 04/11/2022
                         139,361,923 01/17/2022
                  Float: 150,436,297 11/29/2023
                         144,250,037 04/22/2022
                         131,363,757 04/21/2021

            https://www.otcmarkets.com/stock/IQST/security

INQD weekly chart(s)~~~ CMF's on the daily shows Pre-Loading for 2024. Wash sales from November- December means pent-up cash buying in January and any late 2023 buyers will be waiting to sell into the momentum like seen in Friday's Doji.
* Indicator remedial school
https://investorshub.advfn.com/boards/read_msg.aspx?message_id=146368673
chart thread post
18mo technical~~~ January is coming in with a bang!
https://stockcharts.com/h-sc/ui?s=INQD&p=W&yr=1&mn=6&dy=10&id=p61375109690&a=1400342989&listNum=1

collinear
https://stockcharts.com/h-sc/ui?s=INQD&p=W&yr=1&mn=0&dy=0&id=p01182311994

technical
https://stockcharts.com/h-sc/ui?s=INQD&p=W&yr=1&mn=0&dy=0&id=p39859557949&listNum=23&a=1115064471

Pot stocks
https://stockcharts.com/h-sc/ui?s=YOLO&p=D&yr=1&mn=1&dy=0&i=p09997572329&a=584808910&r=1521936220768

Daily
https://stockcharts.com/h-sc/ui?s=INQD&p=D&yr=0&mn=6&dy=10&id=p24986097784&listNum=23&a=1113701411

GDVM weekly charts~~~ We never had this particular Upside Weekly Reversal candle pattern in last 18 months. We also been flirting with $0.010 support for four weeks and never getting her to dance below it.
* A brief on chart Indicators
https://investorshub.advfn.com/boards/read_msg.aspx?message_id=146368673
chart & TA post thread
DolphinToms 18mo weekly~~~ MACD reset (fast signal crossed slow signal line), RSI is in goldilocks and Volume Money is.... well, you know.
* Note with the logarithmic chart scale you can see how this week's candle body overlaps last week body confirming Weekly Upside Reversal setup.... we have a 70% chance to be green in the next 35 calendar days.....
https://thepatternsite.com/WeeklyRevsUpside.html
https://investmentu.com/relative-strength-index-rsi-ultimate-overbought-oversold-indicator/
https://stockcharts.com/h-sc/ui?s=GDVM&p=W&yr=1&mn=6&dy=10&id=p61375109690&a=1400342989&listNum=1

Technical Weekly~~~ That ODRB pattern at $0.0080 that started December off I don't think we will ever see that again. The reversal was confirmed in the last six weeks. This week's Outside Day pattern also has an 82% chance of being green in the next 29 calendar days.
https://thepatternsite.com/OutsideDays.html
https://thepatternsite.com/ODRB.html
https://stockcharts.com/h-sc/ui?s=GDVM&p=W&styr=1&mn=0&dy=0&id=p34307943936&a=1105106922&listNum=2

CMF(20) has 10% buying pressure for two weeks. Someone has been buying, more money inflow than outflow. Also MFI(14) the RSI of volume money has been waltzing in it's goldilocks zone all of December. Yes, I know volume has been awful and sometimes it looked like the MMs were playing with us for two weeks...the only seller we had was the Benz 280E driver.
https://stockcharts.com/h-sc/ui?s=GDVM&p=D&yr=0&mn=6&dy=10&id=p24986097784&listNum=23&a=1113701411.

GDVM intraday chart(s)~~~ Marubozu on the daily, first big green one since December 12! This cements our continuation pattern kicking off 2024 using three weeks repeated testing $0.010 support. Next week we should make a run to the MA(50) since we are flush out of sellers.... nothing but fresh powder on the ground to sled Northward.
* A brief on chart Indicators
https://investorshub.advfn.com/boards/read_msg.aspx?message_id=146368673
chart & T/A thread post
VWAP chart refresher. EMA(30) for 21/2 hours, EMA(79) is all day and VWAP resets each day
https://school.stockcharts.com/doku.php?id=technical_indicators:vwap_intraday
https://stockcharts.com/c-sc/sc?s=GDVM&p=5&yr=0&mn=0&dy=2&id=p69741074503&a=1100650802&listNum=23

https://thepatternsite.com/WhiteMarubozu.html
https://stockcharts.com/h-sc/ui?s=GDVM&p=D&yr=0&mn=3&dy=0&id=p57013211906&a=642509717

A quick look into the future & Technology Investment. .
* My Son is an Engineer at SUNY College of Nanotechnology, Science, and Engineering. At lunch yesterday he tells me they will be building another plant in the parking lot with parking garage to be added later. Employees have to use a shuttle bus from alternate parking at Crossgates Mall to get to work... a temporary bummer.
* As a guess on my part it may have something to do with the manufacture of GsAs and application to AI technology..
https://en.wikipedia.org/wiki/Gallium_arsenide#:~:text=Some%20electronic%20properties%20of%20gallium,in%20excess%20of%20250%20GHz.


