 News
News  Market Data
  Discover
Support: 888-992-3836
Copyright © 2023 InvestorsHub Inc.


CIO, SignalPoint Asset Management, 2008 to 2024, Retired
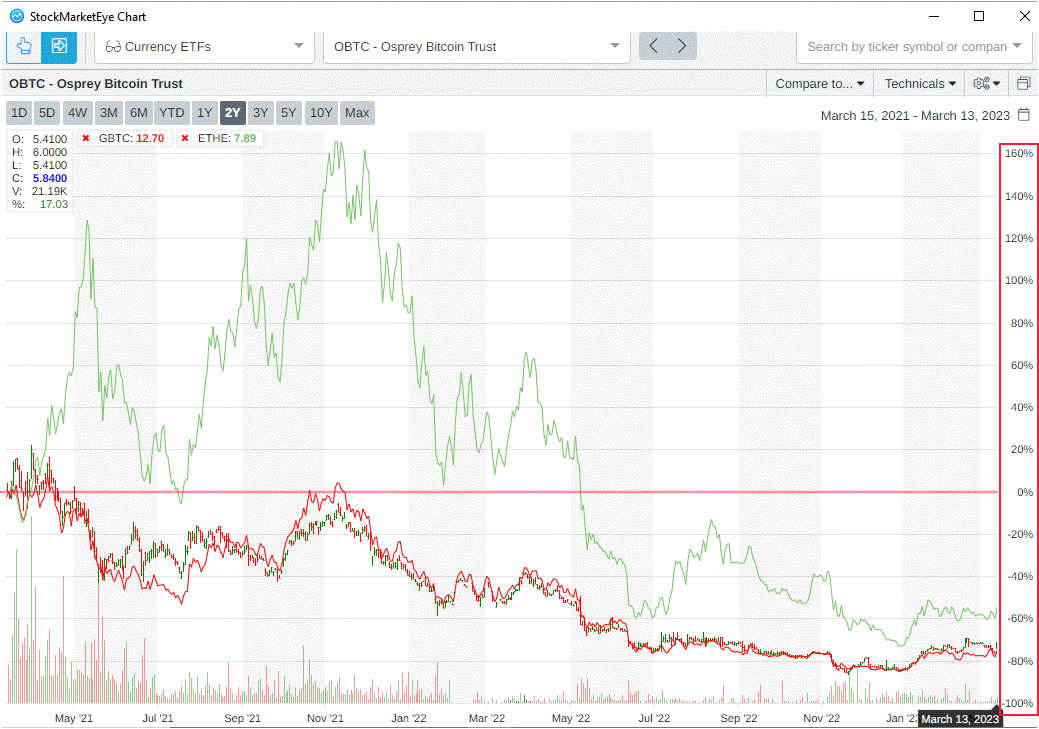
OldAIMGuy
![]()
CIO, SignalPoint Asset Management, 2008 to 2024, Retired
Register for free to join our community of investors and share your ideas. You will also get access to streaming quotes, interactive charts, trades, portfolio, live options flow and more tools.
Register for free to join our community of investors and share your ideas. You will also get access to streaming quotes, interactive charts, trades, portfolio, live options flow and more tools.
CIO, SignalPoint Asset Management, 2008 to 2024, Retired
Quote from Elaine G:
"The markets don't go down because of (only) overvaluation. You have to have the FED tighten as well....."
Well, what does this say about the current situation? We have seen a year of FED tightening and a market that's been, by Elaine's consideration, overvalued. Maybe that's why 2022 was the way it was!
In the words of Paul Carrack:
.....and don't forget Toonces The Driving Cat!........
W$W Spoof!
Hi LT, Re: Schwab trading........................
I've used Schwab for a long time and TDAM before that. I like the Schwab site just fine. Not hard to navigate, all the trade features I like (GTC and Limit, Do Not Reduce, etc) and the site seems pretty fast (relative to my ancient DSL line).
Hope this helps,
OAG
Hi K, Re: Activity........................
We bought in the Financial sector, too. I guess I can include Schwab (SCHW) in Financials and it, too, triggered some effective buys.
Linking BETA to minimum transaction size is a clever idea. Thanks for posting it.
Best wishes,
OAG Tom
Hi Toof, Re: Value LIne Price Earnings value....................

They calculate the median of all stocks "with earnings."
I like the Value Line P/E in that their database is of ~1700 stocks instead of the S&P500 or Dow 30.
As we head toward expected poorer earnings with the inflation and higher interest rates, there will be a difference in how many companies are included each week. I don't have access to that info, however. Some companies will experience reduced positive earnings and some will report losses. Of course, some will show improved earnings, too.
I find it informative that 26 weeks ago the median P/E was 14.4, at the market low of 3/23/2020 it was 11.0 and at the 2022 market high it showed 19.3. Part of the reason Ms Garzarelli's index is so good is it doesn't depend just on P/E but the combination of "risk free rate of return" plus Price to Earnings. In her study (and mine) she showed that a neutral risk market was "20" with 18 and below being bullish and 22 and above being bearish. Now, that "20" could be a combination of a P/E of 19.5 plus 0.5% interest. Or, it could be a P/E of 10 and interest rates of 10.
Most people only look at the P/E and could be fooled by a 10 P/E and think it's bullish or 19.5 and think it is bearish. Only with the combination does one see that the 10 or 19.5 P/Es are just neutral in my example above.
When I put in the CPI inflation rate as a potential substitute for interest rates the Relative Valuation Index corrected itself from the mischief of the Federal Reserve Bank's manipulations. The spreadsheet uses the larger of either the 13 Week Treasury or the CPI inflation value. The result shows RV has been in its Caution zone almost continuously since the start of 2021.
But, my Market Risk Indicator isn't dependent upon just the RV. There are the other three risk components included in the MRI. Of those, two are neutral and one is bullish. The bullish one helps cancel the bearish one and the other two are adrift in the sea of doldrums. Overall, my Market Risk Indicator is currently on the higher end of its neutral range.
Thanks for the question,
OAG Tom
Hi Toof,
I've not had much activity in either the Purchasing or Sales Departments. I'll post my Q1 portfolio results later but need to update the graphs through March 31.
Best wishes,
OAG Tom
Hi Ken and John, Re: W$W................
It was just before the crash of '87 when Elaine Garzarelli was a W$W guest and brought to my attention her "Magic Number" of 20 as the long average value of P/E + ST Interest Rates. I tested it and then added it to my weekly data collection for market risk. I still call it "Relative Valuation" and here's what it looks like currently:

With its color coordinated border, it's not hard to see that Elaine is probably a bit worried at this time. However, please note that my Relative Valuation Index is slightly different from Elaine's. She used just the 13 Week Treasury in her assessment. Starting early in the New Millennium and the FED's crazy easy money policies I added an "either/or" statement to my spreadsheet. It was to compensate for the FED insanity. I put in "the larger of either Interest Rates or CPI Inflation" as the adder to Price / Earnings instead of just ST interest rates. Historically ST rates have almost always been above CPI Inflation. So, when the FED pushed ST rates below inflation it felt 'unholy' to me. So, the histogram shown above is using the larger of the two, CPI Inflation, for this period since it was a higher value than ST rates.
21.75 is the "Caution" level for my Rel Val index. The current value is 23.77 with my modification. 20 is still the median and below 18 is the classic "Proactive" value. We're a long way beyond that right now.
Elaine's method would put her index at 21.51 or on the high side of its neutral range. (16.7 P/E from Value Line plus 4.81%/yr for the 13 Week Treasury) Mine is higher since CPI Inflation is a greater number than current interest rates.
My modified version of Elaine's excellent work now takes into account the lack of real world thinking by the FED. If short term interest rates were still more market driven I wouldn't have to do this. I'll have to remember to post a note when interest rates return to being something above the inflation rate. It's been a very long time.
Thanks for the Memories about LR and W$W in Review,
OAG Tom
Hi Ken, Re: W$W with Lou Rukeyser..........................
It was a classy show with very interesting guests every week - through thick and thin.
Those collectables are nice things to keep around!
Best wishes,
OAG Tom
The v-Wave has been in a tight range right around the Median value even with the banking "crisis."

NASDAQ was beaten the hardest in 2022 so had the best Q1 performance this year so far.
Best wishes,
OAG Tom
I've added GNRC to my IRA account as of yesterday. Preliminary settings for my AIM algorithm are derived from another GNRC holding that has existed since 2014 and seem to have worked well over that time frame.
The 3-5 year potential for price appreciation looks attractive as they continue to pursue their business expansion. That is tempered a bit by rising interest rates, but where available power isn't nearly as reliable as other places, demand should keep business growing even in a higher interest rate environment.
Best wishes,
OAG
I sold all my AAPL shares. I've owned the position since 2014 and done well with lumps and bumps along the way. In looking at the next 3-5 years I think there are other places for my money which might provide better total return. It's pretty rare that I give up on a company's stock. There is potential for share price gain and there's a very modest dividend. That said, I'm moving on.
Thank you to all who have provided timely and insightful commentary on AAPL for the last 9 years.
Best wishes,
OAG
I added 12% to my MESA position this AM at $2.095. That's a 44% discount from my latest sale about 2 weeks ago.
Best wishes,
OAG
As Market Worries
confuse investor actions,
Speculation drops.
Thanks Jon, Re: v-Wave dipping in risk.......................
It's nice to see both the shorter and longer term v-Wave values drift toward lower risk. The 3-5 year forecast is currently one point below its Median value. This is in contrast to all the headlines in the financial press recently. On "Laugh In" years ago they would have said, "You bet your Bippie" but today we say, "You bet your Bitcoin!!!" What's been bad news for one area of the market is shifting $$$ to more traditional investments thereby making it good news for other sectors.

Best wishes,
OAG Tom
He thinks he has it tough!!! I have a Triple Mandate!
1) Price Appreciation over Time
2) Dividend Capture over Time
3) Profitable Volatility Capture over Time
That's where the 3X leveraged funds don't cut it. No #2, Questionable #1 while working #3 as hard as possible. Plus high annual expense ratios.
Thanks for that new Greatest Hits from the Fed!
OAG Tom
Re: AIM Yoyo string..............................
After 2022 I looked at the strings of my AIM Yoyo and it was looking a bit frayed. So, I restrung it with a new Carbon Fiber string with even stronger tensile peak. These last couple of weeks the Yoho has been very busy but the new string is holding up well.
Instead of a Dead Cat Bounce, I'm working on my "Cat's Cradle."

OAG
Hi LO,
Nice move on your part! I'm glad to hear your Purchasing Department was on the job.
F is close to my next 'accumulate' target price. I should double check that the GTC Limit I had in hasn't timed out.
Thanks for the reminder!
OAG
Okay, this isn't haiku, but it popped into my head.......
There once was a concept called "Crypto"
and Speculators all did a Flip-to
When it was climbing
they all were chiming
but not when it turned down to Dip-to
Nice move Steve,
It's pretty quiet today at V.I.E.W. The Sales Dept is taking an extended break while it waits for IAU (Gold surrogate) to climb another 10% or so.
Over in the Purchasing Department there's a lot of phone activity as those looking for liquidity are begging us to take some stock shares off their hands. We're holding tough on our cost targets for adding more inventory, however. Exceptions have been in the Energy and Financial Sector ETFs where on Monday we made some 6% purchases. The 30 Day Rule has been discussed and implemented for sequential buys.
Volatile International Equity Warehouse (VIEW) has performed okay for the year to date but the recent slippage is noticeable. The International division had been doing well but the recent "Drone vs Fighter" action seems to have upset that marketplace. That division has been down almost daily since the start of March. Even so, there's still some discount desired before we start to rebuild inventory.
Keep up the good work,
OAG Tom
Today Mesa shares traded down over a buck/share from my selling price last week. That's almost a 30% discount from last week's price.
Best regards,
OAG Tom
Good morning East,
Pre-Market SCHW looks pretty good on my $52+ addition to the position yesterday. It's been getting trashed since around $80+/share back in January.
Where will sanity price this stock once the dust settles? I'll lessen inventory when the price/share gets back near $75. It at least has a modest dividend while we wait.
Best wishes,
OAG
v-Wave in Living Color!

Best wishes,
OAG Tom
Here's my history since AMTD converted to SCHW shares:

All that time with boring sales and accumulating cash has now been followed by far more exciting times of buying into the weakness.
Best wishes,
OAG Tom
Here's my AIM/Schwab history since it converted from AMTD.
A long, boring wave of Selling followed by some more exciting Buying!
Best wishes,
OAG Tom
I was able to add 30% to my position this AM. Price/share seems to now be holding.
Best wishes,
OAG
Extraordinary
Popular Delusions And
The Madness Of Crowds
Is this 'Chapter 666' of this book?
What the Devil is going on here?
smile
OAG Tom
https://www.amazon.com/Extraordinary-Popular-Delusions-Madness-Illustrated-ebook/dp/B003I84MBO/ref=sr_1_1?crid=2QAASM7OW2O07&keywords=extraordinary+popular+delusions&qid=1678727739&s=books&sprefix=extraordinary+popular+delusions%2Cstripbooks%2C447&sr=1-1
Hi Jon, Re: Recent activity.....................
I purchased 10% more of a solar company's stock last Friday. This AM I added 30% to my SCHW position as it swooned along with many a 'financial' stock. I see Raymond James Financial also stubbed a toe.
I put up a new haiku today relative to crypto. It seemed fitting!
Extraordinary
Popular Delusions And
The Madness Of Crowds
Is this 'Chapter 666' of this book?
What the Devil is going on here?
OAG Tom
https://www.amazon.com/Extraordinary-Popular-Delusions-Madness-Illustrated-ebook/dp/B003I84MBO/ref=sr_1_1?crid=2QAASM7OW2O07&keywords=extraordinary+popular+delusions&qid=1678727739&s=books&sprefix=extraordinary+popular+delusions%2Cstripbooks%2C447&sr=1-1
It appears there are plenty "Scared" around today!
OAG
Hmmmm, it seems someone turned up the Stink Machine today. I did one 12% buy in an alternative energy stock after it sold off heavily today.
I guess I should check. Maybe the sun's not going to shine ever again!
OAG
Hi Steve,
I did manage one sale yesterday in an airline company stock. It was almost 3x AIM's lowest buy price last December! Mr. Lichello was correct again.....
OAG Tom
The halls at iHub are echoing!!!
Stinky markets make for quiet posting.
This AM MESA traded at my target sell price of $3.76. I liberated 10% of the position and stored the proceeds in my cash reserve. My best buy was at $1.38 but my starting price was $7.20. As of this sale the holding has recovered all but 10% of the initial starting amount. I still have over 3X the starting number of shares, so if MESA continues its climb-out to cruising altitude the holding should do well over time.
Best wishes,
OAG
Getting closer!
OAG
Pains of '22
have already been realized.
'23 better?
OAG
Perspective matters
Information presented
Different point of view
OAG
MESA's stock price is now only about 10% away from where my GTC Limit order is. That order will sell 10% of my current share inventory. I don't use moving averages to determine 'next buy' and 'next sell' targets but it is interesting to note that MESA is currently above both the 130 Day and the 20 Day EMA in price/share.

Share inventory management has been almost all on the Accumulation side for me since starting this investment. If/When this share distribution occurs it will only be the 4th one since August of 2021.
Best wishes,
OAG
Good morning Jon,
Here's the v-Wave histogram:

Right on the Median this week.
Best wishes,
OAG Tom
February turned out to be a breath holding month for most of my various portfolios.
Simple Contributory IRA

9 International "Style" ETFs

U.S. Sector ETF Portfolio

10 Stock Composite (Individually managed with AIM)

Most were flat to down less than 3% for February but still up for the YTD.
Cash held in reserve was flat to up slightly for February.
Best regards,
OldAIMGuy Tom
I still need an additional 12% discount before I add to my holding.
OAG

