 News
News  Market Data
  Discover
Support: 888-992-3836
Copyright © 2023 InvestorsHub Inc.


Buying low, Selling High
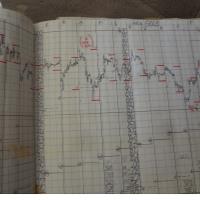
Chartmaster
![]()
Buying low, Selling High
Register for free to join our community of investors and share your ideas. You will also get access to streaming quotes, interactive charts, trades, portfolio, live options flow and more tools.
Register for free to join our community of investors and share your ideas. You will also get access to streaming quotes, interactive charts, trades, portfolio, live options flow and more tools.
Buying low, Selling High
* * $PAOG Daily Chart * * What you would normally see
Daily chart shows nice up channel, looks like PAOG will challenge the old high of .0290 very soon imo

* * $OMVS Daily Chart * * "What you would normally see"
Simple daily charting shows the breakout over .10 and retest..... now onward and upward in the channel with target of .32 this week, OMVS

So Much going on with this chart!!!
1. "Breakout" above .0080,
2. 20 day MA crossing the 50 day and the 20 day is about to cross the 100 day MA(Red circles),
3. 50 and 100 day MA's turning higher(Light blue and purple lines), 4. the 20 day (Green center line) also called the center Bollinger Band has been trending higher since 6/29,
5. and the bigger picture shows that the 200 day MA(Dark green line) has been trending higher ever since the big rally to .0290 earlier this year and now provided support shown by the red arrows.....God I love CHARTS!!! Oh, and
6. notice the high volume on the breakout day shown with the red star! RSII

MMEX sentiment has gotten overly bearish, now is the time for a rally because everyone gave up on MMEX so now the market will rip higher frustrating the masses because that is what the market likes to do to people, Go MMEX!!! .0550 again here we come!!!
Updated chart shows about to breakout over the 100 day MA (Blue Arrow), and Sweet chart breakout over 1 cent!!! Plus the 20 day MA is about to cross the 50 day MA(Red circle), and the 100 day MA (Purple line) has been trending higher since the breakout earlier this year(Red arrows), remember on 3/29 MMEX closed .0082, 3 trading days later on 4/3 MMEX closed .0532!!! This could happen again right now!!!

TMPS went from .03 to $1.07 in less than 2 weeks so I think we could be trading $1.50 in a couple of weeks, then probably a pullback to $1, then onto $2.50++ so say 10-24 weeks for the longer term target price imo
CEO said there is an audit, and it was verified with the company doing the audit in previous posts, I guess you just don't believe them but I say give them a chance before any legal action. PGPM
When the audit results are published, where do you think price will go??? Remember the question answered by the CEO:
- What verifiable assets does the company currently have? I appreciate your time and still am hoping for the best here.
A: The Verification of Financials and assets will be presented at once when the audit is completed, we are not going to make any representations other than a compilation of our financials already disclosed at this time; the audit will provide an independent opinion to the shareholders on the going concerns and fairness of the financial statements this will include adjustments on the balance sheet, non-financial disclosures, changes on a company's assets, liabilities opinions, etc.
Here's the link:
https://www.prlog.org/12650884-pilgrim-petroleum-corporation-announce-update-to-shareholders.html
Holding all my shares for the big move up next week, ASTI
Sweet chart breakout over 1 cent!!! Plus the 20 day MA is about to cross the 50 day MA(Red circle), and the 100 day MA (Purple line) has been trending higher since the breakout earlier this year(Red arrows), remember on 3/29 MMEX closed .0082, 3 trading days later on 4/3 MMEX closed .0532!!! This could happen again right now!!! MMEX near the top 20 most posted alone is a reason to buy imo!!!

So Much going on with this chart!!! 1. "Breakout" above .0080, 2. 20 day MA crossing the 50 day and the 20 day is about to cross the 100 day MA(Red circles), 3. 50 and 100 day MA's turning higher(Light blue and purple lines), 4. the 20 day (Green center line) also called the center Bollinger Band has been trending higher since 6/29, 5. and the bigger picture shows that the 200 day MA(Dark green line) has been trending higher ever since the big rally to .0290 earlier this year and now provided support shown by the red arrows.....God I love CHARTS!!! Oh, and 6. notice the high volume on the breakout day shown with the red star! RSII
This daily chart shows the bottoming process in detail, the 20 day MA crossing the 50 day and the 20 day crossing the 100 day (Red circles), and the whole TRTC chart pattern is a classic Cup and Handle formation

Weekly chart projects move to the 100 week MA around $3.25, there is also weekly chart gaps starting at $2.94-$3.30, I think since we actually closed over the 50 week MA(Hard to see it) that $2.50 to $3.30 is a reasonable target price for TMPS....Plus see the weekly stochastics momentum oscillator has just turned higher confirming momentum force

See the chart breakout over the 200 and 20 day MA's yesterday, now today found support at the breakout point, this is classical technical analysis, going to $$$$$ TMPS
PS: Born in Pontiac Michigan, grew up in Clarkston Waterford area, don't miss the humidity, mosquitoes, or the snow that stays all winter

Wrong! TMPS is on a tear here, it's not going to .14 where you said it had to go fill the phony gap posted b4
Gut tells me to stay away from this bankrupt company, plus never tried Joe's crab shack but friends told me I ain't missing nothing. IRGTQ
This should be higher by now, I'm out FRZT
Huge rally continues, wish I would have bought more at .0426 OMVS
Great buying op here at the .0040 support imo UHLN
Breakout started yesterday, now on to $$$$ TMPS
$1 next target, then $2.50-$3.30, Go TMPS!!!
With today's breakout price is above all the daily MA's, no resistance above only blue skies, TMPS
It's like deja vu, RSII & PAOG running again like they were when PAOG was NWAV earlier this year
.0290 was the old high, Bet we challenge that and exceed it this run then .05 imo RSII
Here comes the Volume finally, nice move today!!! PAOG
Big up day due Friday, I Like the momentum, chart, and company DDDX
GREAT NEWS!!! Should see .0010 soon for SANP!!!
Today's quick dip to support and bounce back looks telling on the chart, It's a continuation signal day, I forget what they call in in Candles, a morning glory star or something, anyways in bar charts I call it a continuation signal and usually marks the low (.0085) for the next leg higher imo, MMEX

Chart shows breakout's just starting with today being the 4th day above the 20 day MA and the 20 day MA again ticked higher today..... MMEX hasn't done that since April
Sweet breakout over the MA's!!! Go TMPS!!!
BRAND NEW REVERSE MERGER INTO OIL AND GAS INDUSTRY COMING SOON! Holding all my shares for the PR!!! LGBS
Loaded more share today at .0086 and .0090, seems like easy money to be made here imo RSII
Charts work great, PGPM was over extended on the up side and trading above the top Bollinger Band, now it's over corrected to the downside and has a down gap from .0010-.0031 that I think will fill with the audit results and more PR's.....Sure everyone lost money here including myself but I loaded up on 3's and averaged down my cost to the point that I expect to make great money when the gap is filled and by the end of the year PGPM will be trading pennies again imo PGPM
See the chart breaking above the 20 and 200 day moving averages today, here we go!!! TMPS

Here comes the breakout, next stop .48, TMPS
Past 3 days price has surged above the 20 and 50 day MA's and today we tested the 50 and held then rallied.....and the 20 day MA today has ticked up again, MMEX

Once we break over .30, then .50 comes quick here TRTC
More I look at the BULLISH STOCHASTICS DIVERGENCE the more I see a sizable rally coming for FRZT

Bought a weekly 340 call today at 2.64, now just need to know where to take profits when TSLA trades between 355-370 in the next 2 days
3 Month chart shows the detail of the 50 day MA (Light blue line) that has just turned up the last 3 days and that's the first time that has happened since April!!! RSII


