 News
News  Market Data
  Discover
Support: 888-992-3836
Copyright © 2023 InvestorsHub Inc.


dindindon
![]()
Register for free to join our community of investors and share your ideas. You will also get access to streaming quotes, interactive charts, trades, portfolio, live options flow and more tools.
Register for free to join our community of investors and share your ideas. You will also get access to streaming quotes, interactive charts, trades, portfolio, live options flow and more tools.
10/11/15 Shanghai Composite Index
after 1 and half month consolidation, will Shanghai Composite Index break out upwardly?

Review:
08/27/15 02:11:19 PM
link
Shanghai Composite Index re-test the former support zone
An upward breakout (3324-3121) would be very bullish.

Monday, 06/15/15 10:39:45 PM
link
FTSE China 50 Index is deteriorating obviously.
any one bought Yang/FXP?
chart: http://forexrainbow.com/images/31897513726341415006.jpg
Re: snootmagruder 2213/1.618
Thank You for the chart
Your calculation is the same as the one in my chart & table, it is a simple Fibonacci play. Most of the traders are trading in a small swing, 2213 is still way ahead of the curve. Quite a few technicians are calling 2020 as the possible short term "top", one step higher is 2032/33, below 2020, we have 2014.75 (0.382 1820.66-ATH), session high 2016.50, i did not check intraday wave numbers, looks skirmish too me.
R. N. Elliott's analysis of the mathematical properties of waves and patterns eventually led him to conclude that "The Fibonacci Summation Series is the basis of The Wave Principle.".
- Fibonacci relationships http://en.wikipedia.org/wiki/Elliott_wave_principle
10/08/15 "The combat Zone"
Use large reference, "The combat zone" (see note) is 1944.65-2047.41.
Taking a quad division, we get:
1944.65 1970.34 1996.03 2021.72 2047.41
Using standard Fib. retracement, the 1st support is 1984.28-1984.55
- recent high low 2020.86-1867.01
- 0.2360 1984.55
- 0.3236 1971.07 (1.618/5), session low 10/06 1071.77
- 0.3820 1962.09
Note:
comments:
- this note gives a pictorial/cursory view. not +/- 1 accuracy.
- use large frame Fibonacci extensions
- The ATH 2134.72 vs. 2130.46
- The recent low 1867.01 vs. 1861.61
- Bull has a pending High target 2213.50
- So far, 2213.50 remains a pipe dream for E-wavers.
Date Uploaded: September 30, 2012, 3:24:46 PM
Time stamp link
( EDIT: pivotal 1829.17 +/- one Fib ratio )

02/08/14 12:24:01 PM
link
You also can find some “popular” numbers such as 1880, 1860, 1944, 2213 .. etc, These are just the wave Fibonacci extensions, not that cryptic.

11/21/14 11:00:28 AM
link
2079.76 A gauge to see 2100-2130
2130.46 Middle term upper target
01/17/15 04:53:59 PM
link
While the general consensus has reached an overwhelmed bullishness level. To be bullish, the serious test remains in between 2069.93 and 2130.46.
Saturday, 03/14/15 03:09:01 PM
link

10/07/15 SPX Poking into the resistance zone 1994.49-2019.49
session high 1999.31, ongoing data
10/06/15 10:40:09 AM
2019.49 0.2360 2134.72-1646.47
1994.49 0.4465 2134.72-1820.66 (1.786/4=0.4465)
a few Fib points in the Fib cluster 1994.49 - 2019.49 (resistance zone)

10/06/15 SPX
session high 1991.62, Ongoing
review:
09/08/15 08:50:01 PM
link
Pumps a bit, bull will make the 2nd attempt on the old battle zone 1994-2019, 2032/2033. The first attempt on 1994 was a failure on 08/28, it breached 1993.48.
RE: This site is always slow and jerky
Try to turn off the Java Script
10/05/15 Closing remak
- SPX closing number 1987.04 (non official number)
- floating above 1st resistance, flat, no action taken.
10/05/15 01:50:45 PM
SPX
1st resistance cluster
1985.71 0.764 2020.86-1871.91
1983.14 0.382 2134.72-1737.92
2nd
1988.98 0.786 2020.86-1871.91 actual 1989.17
SPY intraday 1st resistance 198.11-198.38
SPX * 0.099899 = SPY
SPX
1st resistance cluster
1985.71 0.764 2020.86-1871.91
1983.14 0.382 2134.72-1737.92
2nd
1988.98 0.786 2020.86-1871.91
10/02/15 SPX
review:

 - 10/01/15 12:30:56 PM
 - link
 -
 - key level to watch is the daily close
   above 1929.16 (09/28, Monday High)
   If so, it might invalidate or affect
   Eric Hadik's call (low in between Oct. 6-12)
 -
 - Long term frame 1929.88 0.236 2134.72-1266.74
 -
 - intraday supports:
   1902.38 0.4045 2134.72-1560.33
   1899.93 0.7640 2020.86-1867.01
   1894.78 0.7640 2134.72-1820.66
   .... etc ...

 prognosis:

 - session 10/02
   high 1935.82, ongoing
        1935.56, 0.786 1952.89 (08/25H)-1871.91(08/29L)
   low  1893.70, Ongoing

 chart  as of 10/01

RE: Missed opportunities?
traders are increasingly unsettling ....
for example:
To list just a few:
(1)
09/30 MEDIUM TERM: uptrend
https://caldaro.wordpress.com/2015/09/30/wednesday-update-511/
09/29 MEDIUM TERM: downtrend
https://caldaro.wordpress.com/2015/09/29/tuesday-update-509/
AK2
Yesterday, 11:56 AM
http://indexcalls.com/index.php?showtopic=4093&st=80&p=807983&#
Ideally, I would hope prices would fall back to the opening but this is a corrective wave upwards and could subdivide and become more complex before doing so. One of the main purposes of corrective waves is to chew up time.
After the fall back to 1850, we reach an inflection point. If the market continues down, it's seriously bad. If you are Tony Caldaro, you believe there are new highs >2131 in our future.
Taking into account the "situation", I would think markets would fall due to the sickness both fundamentally and technically, but rigged markets and free money have a way of defying the rules.
I am truly undecided at this point in time, but as this unwinds, the larger trend direction will reveal itself. Very hard to shake off one's biases. Sorry I can't be more definitive.
10/01/15 SPX
 review:

 09/28/15 11:04:55 AM
 - First phase, 2nd Trough targets:
   no change since 08/28/15,
   timing see Note.
   1854-1804-1784
   1771-1705
   chart: link

   Note:
   Timing: according to Eric Hadik:
   link
   Stock Indices Confirm Sept. 16/17 Cycle High…
   Drop Into Oct 6-12 Expected. Sept 28 Ushers In Key Period

 prognosis:

 - key level to watch is the daily close
   above 1929.16 (09/28, Monday High)
 - If so, it might invalidate or affect
   Eric Hadik's call (low in between Oct. 6-12)
 -
 - Long term frame 1929.88 0.236 2134.72-1266.74
 -
 - intraday supports:
   1902.38 0.4045 2134.72-1560.33
   1899.93 0.7640 2020.86-1867.01
   1894.78 0.7640 2134.72-1820.66
   .... etc ...

Congress averts government shutdown
US | Wed Sep 30, 2015 5:58pm EDT
Congress averts government shutdown, sends funding measure to Obama
http://www.reuters.com/article/2015/09/30/us-usa-fiscal-idUSKCN0RU1V420150930
CARL-ICAHN WARNS: market is being-supported by an-unsustainable-earnings-mirage
CARL ICAHN WARNS: The red-hot stock market is being supported by an unsustainable earnings mirage
Sam Ro Sep. 29, 2015, 5:14 AM
http://www.businessinsider.com/carl-icahns-warning-on-stock-market-2015-9
Senate passes legislation to avert a shutdown
Senate passes legislation to avert a shutdown, House expected to act later today
By Kelsey Snell September 30 at 12:11 PM
http://www.washingtonpost.com/news/powerpost/wp/2015/09/30/congress-set-to-pass-legislation-averting-a-shutdown/
The Senate on Wednesday passed a short-term spending bill that would avert a government shutdown and fund federal agencies through mid-December.
Goldman Sachs "new order", LOL
prior updates: 09/21, 09/08, 8/18, 05/19, 04/20
Goldman Sachs just cut its outlook for the stock market
09/29/15 6 pm, Sam Ro
Kostin now sees the S&P 500 ending the year at 2,000, down from his previous target of 2,100.
full text & chart: http://www.businessinsider.com/goldman-sachs-cuts-sp-500-outlooks-2015-9
One of Wall-Street's stock-market uber-bulls just tapped out
09/28/15 Akin Oyedele
http://www.businessinsider.com/rbc-jonathan-golub-lowers-sp-500-target-2015-9
i am waiting for Tony Caldaro to trim down his bullish PV (5) call again. (He adjusted PV on 08/29.). So far, his lowest number for PV is 2214-2219, a big 1.618 Fibonacci point, i think it is still too high.
Tony Caldaro September 26, 2015
https://caldaro.wordpress.com/2015/09/26/weekend-update-519/
target numbers in this chart: https://caldaro.files.wordpress.com/2015/09/spxweekly3.png?w=640&h=485
session low 1879.21, the nearby support is 1878.25, the action proved 1560.33 is the dominant route. The recent low 1867.01 is in between 1878.25 and 1847.53
1779.75 0.618
1695.89 0.764

A blank POST <EOM>
RE: keepsinvesting - calculate local retracements
The recent local high is 2020.86 (09/17)
Assume the local low (intraday low) is XYZ
The bounce use standard retracement is:
= XYZ + (2020.86-XYZ) * Ratios
assume session low is 1894.78 (=XYZ)
where: 1894.78 = { 0.7640, [2134.72, 1820.66] }
constraints: subjects to pattern aspect, trend-lines, moving averages.
at this writing, session low is 1896.67.
1924.53 0.2360 minimum bounce
1935.58 0.3236
1942.94 0.3820
1945.78 0.4045
1951.07 0.4465
1957.82 0.5000
1965.01 0.5570
1972.70 0.6180
1983.92 0.7070
1991.11 0.7640
1993.88 0.7860
2003.97 0.8660
2020.86 1.0000
discussion:
Tuesday, 09/08/15 08:50:01 PM
link
since Bull has gained some "positive score", to be short term bearish, the pivot moves down to around 1894.78, some technicians say 1890. not much difference.
09/28/15 SPX at critical juncture
- No new update, just a reminder.
- See red colored highlights
- session low 1902.85 Ongoing
- Fibonacci projection 1902.38, see bottom chart
review:
 - 08/09/15
 - The (active) retracement coordinate
   is 1560.33 (root) and 2134.72.
   0.3820 @ 1915.30,
   0.4045 @ 1902.38.
 - I mentioned 1905 couple times in Q4/2014.
 - an old chart gives you an overall picture
   http://www.chartupload.com/images/99280192870917928554.jpg

 - 09/02/15
 - daily closes below these levels (1915-1902)
   to signal a new wave down is unfolding.
 - the way to use Fibonacci series:
   (1) set up multiple initial target zones
   (2) and then zooms in the corresponding Fib points.
 - First phase, 2nd Trough targets:
   no change since 08/28/15,
   timing see Note.
   1854-1804-1784
   1771-1705
   chart:
   http://www.chartupload.com/images/48831330145277015582.jpg

 Note:
 Timing: according to Eric Hadik:
 - Stock Indices Confirm Sept. 16/17 Cycle High…
 - Drop Into Oct. 6-12 Expected. Sept 28 Ushers In Key Period!
 - http://www.consensus-inc.com/002001i/knay1537/tech/0923tec-itt.htm
09/24/15 Gold
prior update 09/18/15
 review:
 - 09/18/15
 - the action confirmed 1098.20 on 09/11
   (projected 1096.38 0.764) is a short term low
 - chart 1 gives supports and resistance
 - assume "all pulses" riding on the right track,
 - then the middle term target is 1249.26
 - Gold price is very speculative,
 - Fibonacci points/Cycle projections provide rough guides,
   not a crystal ball.

 synopsis
 Gold Futures - Dec 15 (GCZ5)
 session range: 1129.90 - 1156.30
 16:13:50 GMT - 1,152.00 +20.50 +1.81%

 - resistance zone 1150.90-1152.90 is accessed, see chart
 - last swing (03/17) 1144.30-(05/18) 1228.1, length 83.80
 - recent low 1073.7, today's high 1156.30, length 82.60
 - so, after some minor pullback
   if Gold price displacement from 1073.7
   can move longer than 83.80 and then
   be closed above 1169.8, ... these are the
   "pulses" required to see target 1249.26 (L=175.57)
 - next cycle high could be Oct 23-26
 - i am a technician, i use "how much evidence i got"
 - to say "how much extrapolation i could perceive"

 Sep 24, 1155.80	1129.90
 Sep 23, 1132.20	1128.30
 Sep 22, 1135.00	1122.50
 Sep 21, 1138.50	1130.80
 Sep 20, 1139.40	1136.60
 Sep 18, 1141.20	1127.80
 Sep 17, 1130.50	1117.10
 Sep 16, 1119.90	1109.80
 Sep 15, 1104.50	1103.00
 Sep 14, 1108.60	1104.10
 Sep 13, 1107.90	1103.90
 Sep 11, 1111.70	1098.20<-- swing low

09/22/15 SPX
session low 1932.20, ongoing
Use my calculation method, SPX 1729.12, 1818.93, 1904.12 are important pivots; Since SPX 1700-1900 could be the potential Trough target Zones, I give a complete enumerations. We observed the First phase first Trough 1867.01 on 08/24 (projection 1862.84).
This method has good resolution on higher numbers, it deteriorates slightly in lower numbers; By combining with Fibonacci ratio, pattern aspect, & other TAs, it will give better result for quick traders. For example, for Today's session, the Fibonacci clusters are: 1935.17, 1925.78, 1912.09, 1903.32.
Usage: Terminal points in daily chart, see bottom chart
 04 0.64000 1366.22
 08 0.79012 1686.69
 09 0.81000 1729.12
 10 0.82645 1764.23
 11 0.84028 1793.76
 12 0.85207 1818.93 (1820.66 10/15/14)
 13 0.86224 1840.65
 14 0.87111 1859.58
 ---------- 1862.84 (1867.01 08/24)
 15 0.87891 1876.22
 16 0.88581 1890.96
 17 0.89198 1904.12 (1903.07 09/01)
 18 0.89751 1915.93
 19 0.90250 1926.58
 20 0.90703 1936.25
 29 0.93444 1994.78 (1993.48 08/28)
 36 0.94668 2020.89 (2020.86 09/17)
 40 0.95181 2031.86
 46 0.95790 2044.85 (2044.02 07/07)
The running of the bulls will continue
By Avi Gilburt
Published: Sept 21, 2015 12:31 p.m. ET
http://www.marketwatch.com/story/the-running-of-the-bulls-will-continue-2015-09-21?link=MW_TD
Next, I want to note that this wave iv of 3 suggests that we have lower to go before it is completed. In fact, the ideal targets which seem to keep coming up though my multiple calculations are the 1737 and 1775SPX levels, with the potential to overshoot down to the 1694SPX level.

RE: 'jumanji0881 a H&S pattern
Here is the link:
HSBC WARNS: The stock market 'is putting in a bigger top than eight years ago'
Mike Bird September 21, 2015
Murray Gunn, the head of technical analysis at HSBC Bank, is out with the call, which says the Dow has put it a massive "head and shoulders" top.
full text & chart:
http://www.businessinsider.com/hsbcs-technical-us-stock-market-top-2015-9
September 16, 2015 (freeware)
"1--3 & 3--6 month traders should be on the short side of Stock Indices - from when the DJIA was trading at 17,950 up to 18,288/DJIA. Hold these until a weekly close above 17,050/DJIA."
http://www.consensus-inc.com/002001i/knay1537/tech/0916tec-itt.htm
Goldman Sachs "new order", LOL
prior updates: 09/08, 8/18, 05/19, 04/20
Goldman sees S&P at 2,100 by year’s end after Fed stands pat
By Victor Reklaitis
Published: Sept 21, 2015 7:57 a.m. ET
http://www.marketwatch.com/story/goldman-sees-sp-at-2100-by-years-end-after-fed-stands-pat-2015-09-21
Analysts at Goldman Sachs expect the S&P 500 will climb to 2,100 by the end of this year, partly due to the Federal Reserve’s decision last week to keep interest rates at historically low levels.
The analysts — led by the bank’s chief U.S. equity strategist, David Kostin — are reiterating an S&P target that they detailed a month ago.
HD168 Thursday, 11/13/14 11:05:30 AM
http://investorshub.advfn.com/boards/read_msg.aspx?message_id=108127645
So when GS ask people to jump the cliff, no one will question GS.
Fed Audit Shocker: They Come from Planet Klepto
The clearest presentation about FED's QE aftermath A mush better documentary efforts than Doug Noland's & David Stockman's.
19 mins 49 seconds.
>> Sovereign debt is the Achilles-heel-of the DMs
Thank You for you reply,
may be to your surprise, at least for China, the story is quite straightforward.
Here are 3 commentaries i wrote, no particular reading order, but part 5 gave all the answers you want. Don't under estimate the integrity of Chinese leaders, they talk little, did a lot.
What’s wrong with China? part 5
http://www.siliconinvestor.com/readmsg.aspx?msgid=30234251
What’s wrong with China? part 3
http://www.siliconinvestor.com/readmsg.aspx?msgid=30233273
What’s wrong with China? part 6
http://www.siliconinvestor.com/readmsg.aspx?msgid=30235465
Finally, here is an open invitation by Kublai Khan in 1293/94?!
What’s wrong with China? part 4
http://www.siliconinvestor.com/readmsg.aspx?msgid=30234019
China trade surplus will reach all time high $600 billion in 2015 http://www.tradingeconomics.com/china/balance-of-trade, lots room to adjust the fiscal policies.
UK and German are realistic politicians, old foxes.
George Osborne: It’s in Britain’s interest to bond with China now
The future prosperity of this country depends on us strengthening our relationship with the world’s next superpower
http://www.theguardian.com/commentisfree/2015/sep/19/george-osborne-britain-should-bond-china-now
Background info:
US anger at Britain joining Chinese-led investment bank AIIB
http://www.theguardian.com/us-news/2015/mar/13/white-house-pointedly-asks-uk-to-use-its-voice-as-part-of-chinese-led-bank
Nicholas Watt, Paul Lewis and Tania Branigan
Thursday 12 March 2015 20.12 EDT
The US administration made clear in no uncertain terms its displeasure about Osborne’s decision to join the AIIB. A US official told the Financial Times: “We are wary about a trend toward constant accommodation of China, which is not the best way to engage a rising power.”
Britain was unsurprised by the decision of the US administration to air its concerns in public after the formal announcement that the UK would join the new investment bank.
The fate of the dollar’s status is in-America’s-hands
Washington, China, and the Rise of the Renminbi: Are the Dollar’s Days as the Global Reserve Currency Numbered?
William T. Wilson, Ph.D. Aug 17, 2015
link
By far the greatest threat to the dollar’s reserve status is the U.S. budget deficit and projected federal unfunded liabilities. In surplus as recently as the late 1990s, the U.S. budget deficit currently exceeds 100 percent of GDP. The federal debt has more than tripled since the turn of the millennium. Worse yet, according to the U.S. Debt Clock, the total value of future unfunded liabilities is $96 trillion—$812,000 per person. This does not include state liabilities, and some economists consider the figure to be considerably higher.
If this current scenario persists, it is clear that American debt will fail to hold its value. While it is difficult to predict when this will occur, if sovereign debt fails to hold its value, investors will lose confidence and the dollar will likely lose its global reserve status. But the RMB is not likely to fill the void any time soon.
The fate of the dollar’s status and all it means to American prestige and global leadership is in America’s hands. The RMB is not the threat to the dollar.
SPX breaks an important intraday support 1962.09
- still in struggling ..
- session low 1958.89 (1958.63, another 0.4045), ongoing.
- .... inconclusive
- stick save? . will see.
important reference 1904(1903.07), 1994 (1993.48)

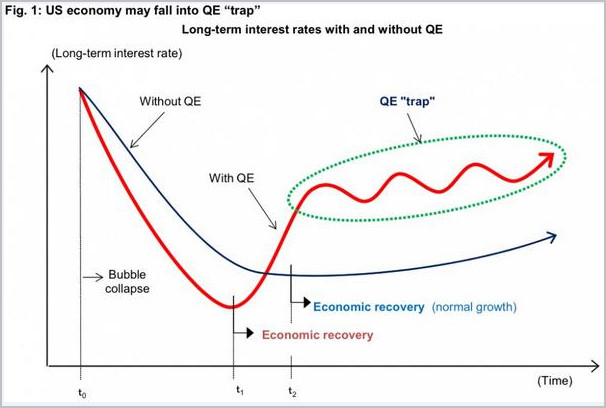
Perspective: The 'struggle-between-markets-and-central-banks has only just begun'
RICHARD KOO: The 'struggle between markets and central banks has only just begun'
David Scutt, Business Insider Australia
Sep. 16, 2015, 7:27 AM
http://www.businessinsider.com/richard-koo-struggle-between-markets-and-central-banks-has-only-just-begun-2015-9?r=UK&IR=T


09/18/15 Gold
all price make reference to:
http://www.investing.com/commodities/gold-historical-data
Gold Futures - Dec 15 (GCZ5)
In session, Sep 18: High 1141.20, Low 1126.90, ongoing
as of 15:58:38 GMT - 1,136.50 +19.50
review:
Tuesday, 09/01/15 12:02:55 PM
- tested the support 1116.27 (chart 2) successfully
- if it stays above 1132-1134
- good odds to test 1150.9. (chart 3)
Outlook:
- On 09/03 Gold price closed below 1132-1134
- On 09/16 Gold price re-claimed (closed above) 1116.27, the action
- confirmed 1098.20 on 09/11 (projected 1096.38 0.764) is a short term low
- chart 1 gives supports and resistance
- assume "all pulses" riding on the right track,
- then the middle term target is 1249.26
- Gold price is very speculative,
- Fibonacci points/Cycle projections provide rough guides, not a crystal ball
 -------    High     Low
 Sep 18, 1141.20 1126.90
 Sep 17, 1130.50 1117.10
 Sep 16, 1119.90 1109.80
 Sep 15, 1104.50 1103.00
 Sep 14, 1108.60 1104.10
 Sep 13, 1107.90 1103.90
 Sep 11, 1111.70 1098.20 <-- swing low
 Sep 10, 1113.50 1105.50
 Sep 09, 1123.50 1102.10
 Sep 08, 1122.50 1116.40
 Sep 07, 1124.00 1115.20
 Sep 06, 1123.10 1119.60
 Sep 04, 1125.20 1116.20
 Sep 03, 1132.90 1120.30 <- closed below 1132-1134
 Sep 02, 1140.40 1130.80
 Sep 01, 1144.70 1133.50
 Aug 31, 1134.00 1124.80
 Aug 30, 1133.80 1130.80
 Aug 28, 1139.00 1123.60
 Aug 27, 1127.40 1118.40
 Aug 26, 1143.00 1119.60


09/17/15 SPX
- session high 2020.86, ongoing.
- re-accessed the full old battle zone 1994-2019 in 2 sessions
- Now is meeting the resistance 2021/50ema & 2032/2033 (0.618)
- may fizzle out soon.
Tuesday, 09/08/15 08:50:01 PM
Pumps a bit, bull will make the 2nd attempt on the old battle zone 1994-2019, 2032/2033

FOMC Release
Release Date: September 17, 2015
For immediate release
Information received since the Federal Open Market Committee met in July suggests that economic activity is expanding at a moderate pace. Household spending and business fixed investment have been increasing moderately, and the housing sector has improved further; however, net exports have been soft. The labor market continued to improve, with solid job gains and declining unemployment. On balance, labor market indicators show that underutilization of labor resources has diminished since early this year. Inflation has continued to run below the Committee's longer-run objective, partly reflecting declines in energy prices and in prices of non-energy imports. Market-based measures of inflation compensation moved lower; survey-based measures of longer-term inflation expectations have remained stable.
Consistent with its statutory mandate, the Committee seeks to foster maximum employment and price stability. Recent global economic and financial developments may restrain economic activity somewhat and are likely to put further downward pressure on inflation in the near term. Nonetheless, the Committee expects that, with appropriate policy accommodation, economic activity will expand at a moderate pace, with labor market indicators continuing to move toward levels the Committee judges consistent with its dual mandate. The Committee continues to see the risks to the outlook for economic activity and the labor market as nearly balanced but is monitoring developments abroad. Inflation is anticipated to remain near its recent low level in the near term but the Committee expects inflation to rise gradually toward 2 percent over the medium term as the labor market improves further and the transitory effects of declines in energy and import prices dissipate. The Committee continues to monitor inflation developments closely.
To support continued progress toward maximum employment and price stability, the Committee today reaffirmed its view that the current 0 to 1/4 percent target range for the federal funds rate remains appropriate. In determining how long to maintain this target range, the Committee will assess progress--both realized and expected--toward its objectives of maximum employment and 2 percent inflation. This assessment will take into account a wide range of information, including measures of labor market conditions, indicators of inflation pressures and inflation expectations, and readings on financial and international developments. The Committee anticipates that it will be appropriate to raise the target range for the federal funds rate when it has seen some further improvement in the labor market and is reasonably confident that inflation will move back to its 2 percent objective over the medium term.
The Committee is maintaining its existing policy of reinvesting principal payments from its holdings of agency debt and agency mortgage-backed securities in agency mortgage-backed securities and of rolling over maturing Treasury securities at auction. This policy, by keeping the Committee's holdings of longer-term securities at sizable levels, should help maintain accommodative financial conditions.
When the Committee decides to begin to remove policy accommodation, it will take a balanced approach consistent with its longer-run goals of maximum employment and inflation of 2 percent. The Committee currently anticipates that, even after employment and inflation are near mandate-consistent levels, economic conditions may, for some time, warrant keeping the target federal funds rate below levels the Committee views as normal in the longer run.
Voting for the FOMC monetary policy action were: Janet L. Yellen, Chair; William C. Dudley, Vice Chairman; Lael Brainard; Charles L. Evans; Stanley Fischer; Dennis P. Lockhart; Jerome H. Powell; Daniel K. Tarullo; and John C. Williams. Voting against the action was Jeffrey M. Lacker, who preferred to raise the target range for the federal funds rate by 25 basis points at this meeting.
"What Happened At 6:12 AM This Morning?"
FYI
S&P 500 e-mini futures have been halted twice (0551ET anbd 0612ET) in what one market observer exclaimed "looks like manipulation to me." So what exactly happened at 6:12am? .... ....
http://www.zerohedge.com/news/2015-09-10/what-happened-612-am-morning
09/09/15 SPX after close
dindindon Tuesday, 09/08/15 08:50:01 PM
The real test is the resistance 1969.28/0.382. Pumps a bit, bull will make the 2nd attempt on the old battle zone 1994-2019, 2032/2033. The first attempt on 1994 was a failure on 08/28, it breached 1993.48. Now, support is near 1960. since Bull has gained some "positive score", to be short term bearish, the pivot moves down to around 1894.78
blustar Today, 05:49 PM
http://charts.blustarmarkettimer.com/
http://www.traders-talk.com/mb2/index.php?showtopic=161418
Update 9-9-15 : SPX looks lower into Thursday 1898 then higher into Monday over 1993 to as high as 2020.
chart: http://blustarcharts.weebly.com/uploads/4/7/3/6/47366129/5200615_orig.png
dindindon 06/18/15
Utility sector is rate sensitive (.. .. XLU). imho, if an Utility position has no safe margin, better sell it on any bounce opportunity.

Avi Gilburt & Larry Edelson
RE: Avi Gilburt
Not much difference among the technicians' numbers.
FYI FWIW
Action suggests 1700 on the S&P more likely than not
By Avi Gilburt Published: Sept 8, 2015 12:03 p.m. ET
http://www.marketwatch.com/story/action-suggests-1700-on-the-sp-more-likely-than-not-2015-09-08
More Big Losses Coming for Miners …
Larry Edelson | Wednesday, September 9, 2015 at 7:30 am
http://www.moneyandmarkets.com/big-losses-coming-miners-73221#.VfBj3n1BAwA
09/08/15 SPX After close
09/07/15 SPX, a morphing pattern
SPX index closed above the upward breakout point 1962.82 +/-. The real test is the resistance 1969.28/0.382. Pumps a bit, bull will make the 2nd attempt on the old battle zone 1994-2019, 2032/2033. The first attempt on 1994 was a failure on 08/28, it breached 1993.48. Now, support is near 1960. since Bull has gained some "positive score", to be short term bearish, the pivot moves down to around 1894.78, some technicians say 1890. not much difference.
Direxion 6 Leveraged ETFs Reverse-Share-Splits extend to October 1
Direxion Investments has announced it will extend the date for executing reverse share splits for six of its leveraged exchange-traded funds ("ETFs") to October 1, 2015.
(includes TZA NUGT ... )
http://finance.yahoo.com/news/direxion-announces-date-extension-october-225300302.html
Goldman Sachs "new order", LOL
prior update: 8/18
Goldman's entire outlook for markets and the economy in one big slide
Akin Oyedele 21m
According to chief equity strategist David Kostin, the S&P 500 is forecast to rally 8% to close the year at 2100. On Friday, the index closed about 3% above the most recent low of 1868 reached on August 25.
full text & chart: http://www.businessinsider.com/goldman-sachs-global-macro-forecasts-2015-9
HD168 Thursday, 11/13/14 11:05:30 AM
http://investorshub.advfn.com/boards/read_msg.aspx?message_id=108127645
So when GS ask people to jump the cliff, no one will question GS.
09/07/15 SPX, a morphing pattern
- upward breakout point 1962.82 +/-
- downward breakout confirmation point 1903.07
- prior chart
- reference chart for conceptual illustration
- horizontal lines are delimiters for wave counting

Labor Day long weekend - Fibonacci zones
 Recent low    1,867.08     Aug 25,2015
 ATH           2,134.72     May 20,2015

Post No. 999
On session 08/28, SPX hit 1993.48 and reversed, then marked an low 1903.07 on 09/01.
See how the the old numbers are recurring
dindindon Thursday, 12/18/14 12:50:27 AM
This is a reminder that:
- 1994-2019 is the old battle zone back to late August
- major support 1904.78 +/-
- supports see chart:
http://www.chartupload.com/images/66935499426303984992.jpg
xxx Thursday, December 18, 2014 10:52:58
I am amazed that the same perma-bear positions keep the same focus no matter how many times the market destroys that view.
I don't understand why people don't incorporate technical and fundamental data.
dindindon Sunday, 11/23/14 01:28:34 PM
http://investorshub.advfn.com/boards/read_msg.aspx?message_id=108443538
Post No. 500
(1) 2079.76 A gauge to see 2100-2130
(2) 2130.46 Middle term upper target

