 News
News  Market Data
  Discover
Support: 888-992-3836
Copyright © 2023 InvestorsHub Inc.


dindindon
![]()
Register for free to join our community of investors and share your ideas. You will also get access to streaming quotes, interactive charts, trades, portfolio, live options flow and more tools.
Register for free to join our community of investors and share your ideas. You will also get access to streaming quotes, interactive charts, trades, portfolio, live options flow and more tools.
zulu re: FB
Firstly, we will need to put earning announcement date into consideration because it is too close to a cycle cutoff date; FB first Quarter Earnings Announcement will tentatively be announced on 04/30/2014 (with 40 analysts covering FB, the consensus EPS estimate is $0.24.). The polarity for general market before April 15/16 was expected to be negative (low). Now, it seems the polarity might be positive (to be confirmed), A confirmed positive polarity gives the odd to see FB @52 before earning announcement date is below 50%. A big miss on earning is a different story
first open gap 54.95-60.17, filled to 57.98
retracement
43.55-72.59 (0.500/58.07) (0.618/54.64)
17.55-72.59 (0.382/51.58) (0.500/45.07) (0.618/38.58)
recent low 57.98 (03/27)
FB has a very clear 9 months cycle (39 weeks), half cycle is 19/20 weeks (19.6), and 9/10 weeks (9.8), together with the bearish gauge 54.81 that gives you a rough idea whether & when the price will fall into 39-45.

one of the wave projection 57.66 has been met, no decisive wave factors say the decline will continue for near future.
The intraday Symmetrical Triangle is a continuation pattern.
more details can be found in via this link

03/31/14 Archer Daniels Midland Company (ADM)
current price 43.46
-info only-
Will This Upgrade Help Archer-Daniels-Midland (ADM) Today?
BY Shawn Ingram | 03/10/14 - 09:18 AM EDT
BMO Capital set a $50 price target for the farm products company. According to BMO analysts Archer-Daniels-Midland was upgraded because it is in the early stages of turning its business around.
http://www.thestreet.com/story/12522981/1/will-this-upgrade-help-archer-daniels-midland-adm-today.html?puc=yahoo&cm_ven=YAHOO
Auntie Yellen just gave a dovish speech
David Zervos of Jefferies — in his typically restrained manner — says this speech ends any debate about where Yellen stands:
full text http://www.businessinsider.com/zervos-on-yellen-2014-3
sharpshorts - Karma
Good intent and good deed contribute to good karma and future happiness
Best wishes for you
dindin
03/31/14 BRIZF - a Gold And Uranium Double Play
information only - Penny Stock - small cap
Brazil Resources Inc. (BRIZF)
Avg Vol (3m): 121,345
Brazil Resources: A Gold And Uranium Double Play
Mar. 20, 2014 1:29 PM ET
http://seekingalpha.com/article/2100223-brazil-resources-a-gold-and-uranium-double-play
Here are four reasons why I think Brazil Resources Inc. (BRIZF) is a 'buy' now.
https://finance.yahoo.com/news/time-buy-undervalued-stock-102407687.html

03/31/14 FB
The gap is half-filled

>> Red & Blue China
The civil war (1945-1949) between
Red China (CPC http://en.wikipedia.org/wiki/Chinese_Communist_Party ) and Blue China (KMT http://en.wikipedia.org/wiki/Kuomintang )
was a generational tragedy.
my father was captured by Chinese Red army in 1948. He escaped and fled to Taiwan in 1949. Nostalgia let him visit his home town in middle 90, ... ... The built-in preference recognition (Prejudices), it is well known, are most difficult to eradicate from the heart.
03/31/14 SPX & DJI
>> 03/29 Saturday, 03/29/14 04:48:32 PM
>> For a complete view, it is necessary to put dual gauges:
>> 1874.47 (bull) and 1849.50 (bear).
SPX intraday high 1874.04, this is an in-progress data.
In between 1874.74 & 1849.50 is the neutral zone.
The divergence between DJI and SPX (NDX RUT) worth attention,
DJI has an unrealized wave extension high target 16810. Now, it is struggling to test the recent high 16588.25.
>> charted on Friday, 03/28/14 11:54:46 AM

>> Friday, 02/14/14 03:15:02 PM
>> link

How China Keeps Fooling New York Times, BBC
>> 03/27/14 cue-master
>> link
>> great watch on china from the bbc
>> china blues
>> 03/27/14 dindindon
>> link
>> It is full of elegant Montage technique. ..... ..... that try to (.....) you.
Robert Peston “How China Fooled The World – Documentary” has been translated into Chinese in http://www.guancha.cn/economy/2014_03_31_217175.shtml. from their translation, I found the following interesting commentary:
(Forbes)
Upside-Down Propaganda: How China Keeps Fooling The New York Times, The BBC, And Other Wishful Thinkers
Eamonn Fingleton 2/23/2014
http://www.forbes.com/sites/eamonnfingleton/2014/02/23/a-lesson-in-propaganda-how-china-fooled-the-bbc-the-new-york-times-and-other-wishful-thinkers/
One of the most hilarious media hoaxes of all time was the BBC’s famous “spaghetti harvest” spoof of 1957. .... Last week the BBC again hoaxed millions. ....... But this time, far from being the instigator of the spoof, the presenter, BBC economics editor Robert Peston, was as much a victim as his viewers.
03/29/14 SPX
On 03/12, I expected a (rather milder) low target in between 1806.84-1836.44 around the first half of April +/-. Ever since then, the lowest intraday low was observed on 03/14 @1839.57, It seems the S&P index is running tight in terms of time to see a sizable low.
For a complete view, it is necessary to put dual gauges: 1874.47 (bull) and 1849.50 (bear). The unrealized (intermediate term) high target is 1903.59. For short term (2 weeks) bearish scenario, 1806.84 - 1793.58 +/- is a good reversal zone. see the following chart.
For bullish scenario, the middle term high target is 1944.65 (1931.41-1944.65).
imho, the decisive fight will be in the first half of May +/-. a new high or a lower high will give a better guide for the long term consequence. Time is a magic machine. let’s see what will happen.


03/15/14 long term perspective link
Let’s check what is the minimum high so that its 0.618 pullback with reference to 1343.35 will not be lower than 1560.33? The answer is 1911.36. , very close to the unrealized intermediate term high target 1903.59.
In my 02/08’s analysis, I came out a range 1450-1620 as the gauge for “the End of Bull”. the afore mentioned gauge 1560.33 is in the range.
>> 02/08/14
>> IMHO, the Long term weekly chart hints a possible recurring rhythm.
>> long term weekly chart:
>> http://forexrainbow.com/images/83483000717942621362.jpg
>> In overall, it is still very bullish.
>> As long as bull can hold the critical support zone 1450-1620 +/- .
>> the bull market (since 2009) is firmly intact.
03/29/14 Gold
Gold future ( http://www.investing.com/commodities/gold-historical-data )
drops into the support zone 1298.5-1282.2, the next support is 1262.35 (0.618 1392.5-1181.9)
note: 1287.2 is the mean (50%) in between 1392.5 and 1181.9
>> 03/24/14
>> The latest data suggest the near term support is
>> 1305, 1298.5-1282.2, +/-.
>> Without closing above 1328 +/- in the next 2 weeks, the chance to
>> see 1425 +/- is getting slimmer in the high window in coming
>> April/May thru July/August.

ECRI Recession Watch: Weekly Update By Doug Short
ECRI Recession Watch: Weekly Update
By Doug Short March 28, 2014
The Weekly Leading Index (WLI) of the Economic Cycle Research Institute (ECRI) is at 133.5, up from 133.0 last week (a revision from 132.9).
http://www.advisorperspectives.com/dshort/updates/ECRI-Weekly-Leading-Index.php
03/28/14 SPX
intraday high 1866.63, this is an in progress data.
breaches 0.618/1867.01 (1839.57-1883.97) technically.
>> 03/12/14
>> The minimum gauge to say a sizable pullback is commencing
>> is 1849.20 (0.236 1737.92-1883.57)
>> great watch on china from the bbc
It is full of elegant Montage technique. ..... ..... that try to (.....) you.
The background music in the last 28 seconds was dubbing from
the very dark music theme:
Requiem for a Tower
03/26/14 SPX
since I quoted SilentOne's (John) Hurst cycle work on 03/15/14,
Here is his latest outlook
March 24, 2014 by SilentOne.
$SPX 18 month Hurst cycle low
.... .... ..... We should decline from here into an 18 month Hurst cycle low. This decline will probably not be your garden variety correction in a bull market. ... ..... The next 10 week Hurst low is due by mid-April ... ....
SilentOne Wednesday, 03/26/14 09:55:47 PM
full text & chart: http://hurstcycles.com/spx-18-month-hurst-cycle-low/#sthash.WxvNz96v.u9hOuXnl.dpbs
03/26/14 FB & EXPE
>> 03/02
>> imho: EXPE & FB look ripe for a pullback.
Edwards & Magee. Gaps to be filled


03/25/14 HSBC bounces off the supportive trendline

03/25/14 BP bounces off the supportive trendline

Once upon a time
in a galaxy far, far away. ...
A few Sword man surround da_chief, He lifts off & his 'Logo' falls apart.
(the 'renowned' Avatar disappeared)
http://www.traders-talk.com/mb2/index.php?showuser=321
http://www.siliconinvestor.com/readmsg.aspx?msgid=29455392
http://www.siliconinvestor.com/readmsg.aspx?msgid=29453707
http://www.siliconinvestor.com/readmsg.aspx?msgid=29454066
http://www.siliconinvestor.com/readmsg.aspx?msgid=29454266

-- Ole Clear Station Entertainment News --
03/24/14 Gold
Gold accessed and closed below the critical support 1312
http://www.investing.com/commodities/gold-historical-data
The latest data suggest the near term support is 1305, 1298.5-1282.2, +/-.
Without closing above 1328 +/- in the next 2 weeks, the chance to
see 1425 +/- is getting slimmer in the high window in April/May thru July/August.
>> 03/19
>> barring unexpected factors, gold is on schedule to the target zone
>> (1423.51-1427.72) – 1432.92 (prefer 1425 +/-), (chart 1)
>> timing: is around the juncture of April/May +/-.
>> critical support is 1312 (chart 1, 0.382) – 1315.4 (chart 2)
>> highly speculative
chart 1: http://forexrainbow.com/images/63883976708704353660.jpg
chart 2: http://forexrainbow.com/images/58046267499052648810.jpg
03/24/14 SPX
intraday 1849.69, this is an in-progress data
Gauge to enter the pullback zone: 1849.50 (0.236 1737.92-1883.97)
>> 03/12/14
>> The minimum gauge to say a sizable pullback is commencing
>> is 1849.20 (0.236 1737.92-1883.57)
intraday
daily
http://forexrainbow.com/images/04581936204342494138.jpg
(I am not an E-wave advocator, use it to exchange ideas)
BP hitting supportive trend line
information only

>> Why the bull market could end tomorrow
quote two paragraphs via the link provided by jumanji
Why the bull market could end tomorrow
Jen Wieczner March 21, 2014: 6:00 AM ET
http://finance.fortune.cnn.com/2014/03/21/why-the-bull-market-could-end-tomorrow/?iid=HP_LN
he circled a specific point at which he expects the market to pivot: 1,931 on the index. "Its pretty clear that this next rally, the one we're currently in, will be a good top," DeMark says. "And it looks like it's going to be a pretty important top that should last at least three months." During that time, brace for a decline of at least 11%, he adds.
To be sure, the "top" DeMark foresees now may just portend a bigger breather than stocks have had for the last few years, before the bull comes roaring back.

market hears only 3 words: “Around six months”
based on the following commentaries,
i guess bulls are running out of luck, their shield is coming down.
Yellen speaks for an hour, market hears only 3 words
Commentary: “Around six months” implied Fed would probably raise rates earlier than expected.
http://www.marketwatch.com/story/yellen-speaks-for-hour-market-only-hears-three-words-2014-03-19
The taper of the Fed’s bond purchases is on course to end in October or November. Six months after that would be April or May. So Yellen said the first rate hike could come in April or May, depending on how the economy is doing.
FOMC economic projections

http://www.federalreserve.gov/monetarypolicy/files/fomcprojtabl20140319.pdf
Note: In the upper panel, the height of each bar denotes the number of FOMC participants who judge that, under appropriate monetary policy, the first increase in the target federal funds rate from its current range of 0 to 1/4 percent will occur in the specified calendar year. In December 2013, the numbers of FOMC participants who judged that the first increase in the target federal funds rate would occur in 2014, 2015, and 2016 were, respectively, 2, 12, and 3. In the lower panel, each shaded circle indicates the value (rounded to the nearest 1/4 percentage point) of an individual participant’s judgment of the appropriate level of the target federal funds rate at the end of the specified calendar year or over the longer run.
03/19/14 S&P500 continuation
>> 03/12/14
>> The minimum gauge to say a sizable pullback is commencing
>> is 1849.20 (0.236 1737.92-1883.57),
>> tentative target is 1806.84-1836.44
refer to the chart, red color number is theoretical value, black is the actual. Index is doing ping-pong in between Fibonacci points
Timing is an important criteria.
Timing chart March 2, 2014, 8:05:07 PM
http://forexrainbow.com/images/50814681873205259793.jpg
numbers can be realized in the table (see chart)
range 1 1836.44-1818.54
pivot 1793.58
range 2 1806.84-1777.70
strong support 1739.24-1737.04
There is an unrealized intermediate high 1903.59 ( = 1737.92 + 1.618*(1729.86-1627.47) ) and middle term high 1944.65
The projected peak in May (05/12 +/-) is very important for the long term consequence, the judgement will base on if it is a lower high (<= 1903.59) or new high. (>=1944.65)

FOMC economic projections (GDP, Target federal funds rate ... etc)
Release Date: March 19, 2014
For release at 2:00 p.m. ET
The attached table and charts released on Wednesday summarize the economic projections and the target federal funds rate projections made by Federal Reserve Board members and Federal Reserve Bank presidents for the March 18-19 meeting of the Federal Open Market Committee.
The table will be incorporated into a summary of economic projections released with the minutes of the March 18-19 meeting. Summaries of economic projections are released quarterly.
http://www.federalreserve.gov/monetarypolicy/files/fomcprojtabl20140319.pdf
03/19/14 FOMC Press Release
Release Date: March 19, 2014
For immediate release
http://www.federalreserve.gov/newsevents/press/monetary/20140319a.htm
Information received since the Federal Open Market Committee met in January indicates that growth in economic activity slowed during the winter months, in part reflecting adverse weather conditions. Labor market indicators were mixed but on balance showed further improvement. The unemployment rate, however, remains elevated. Household spending and business fixed investment continued to advance, while the recovery in the housing sector remained slow. Fiscal policy is restraining economic growth, although the extent of restraint is diminishing. Inflation has been running below the Committee's longer-run objective, but longer-term inflation expectations have remained stable.
Consistent with its statutory mandate, the Committee seeks to foster maximum employment and price stability. The Committee expects that, with appropriate policy accommodation, economic activity will expand at a moderate pace and labor market conditions will continue to improve gradually, moving toward those the Committee judges consistent with its dual mandate. The Committee sees the risks to the outlook for the economy and the labor market as nearly balanced. The Committee recognizes that inflation persistently below its 2 percent objective could pose risks to economic performance, and it is monitoring inflation developments carefully for evidence that inflation will move back toward its objective over the medium term.
The Committee currently judges that there is sufficient underlying strength in the broader economy to support ongoing improvement in labor market conditions. In light of the cumulative progress toward maximum employment and the improvement in the outlook for labor market conditions since the inception of the current asset purchase program, the Committee decided to make a further measured reduction in the pace of its asset purchases. Beginning in April, the Committee will add to its holdings of agency mortgage-backed securities at a pace of $25 billion per month rather than $30 billion per month, and will add to its holdings of longer-term Treasury securities at a pace of $30 billion per month rather than $35 billion per month. The Committee is maintaining its existing policy of reinvesting principal payments from its holdings of agency debt and agency mortgage-backed securities in agency mortgage-backed securities and of rolling over maturing Treasury securities at auction. The Committee's sizable and still-increasing holdings of longer-term securities should maintain downward pressure on longer-term interest rates, support mortgage markets, and help to make broader financial conditions more accommodative, which in turn should promote a stronger economic recovery and help to ensure that inflation, over time, is at the rate most consistent with the Committee's dual mandate.
The Committee will closely monitor incoming information on economic and financial developments in coming months and will continue its purchases of Treasury and agency mortgage-backed securities, and employ its other policy tools as appropriate, until the outlook for the labor market has improved substantially in a context of price stability. If incoming information broadly supports the Committee's expectation of ongoing improvement in labor market conditions and inflation moving back toward its longer-run objective, the Committee will likely reduce the pace of asset purchases in further measured steps at future meetings. However, asset purchases are not on a preset course, and the Committee's decisions about their pace will remain contingent on the Committee's outlook for the labor market and inflation as well as its assessment of the likely efficacy and costs of such purchases.
To support continued progress toward maximum employment and price stability, the Committee today reaffirmed its view that a highly accommodative stance of monetary policy remains appropriate. In determining how long to maintain the current 0 to 1/4 percent target range for the federal funds rate, the Committee will assess progress--both realized and expected--toward its objectives of maximum employment and 2 percent inflation. This assessment will take into account a wide range of information, including measures of labor market conditions, indicators of inflation pressures and inflation expectations, and readings on financial developments. The Committee continues to anticipate, based on its assessment of these factors, that it likely will be appropriate to maintain the current target range for the federal funds rate for a considerable time after the asset purchase program ends, especially if projected inflation continues to run below the Committee's 2 percent longer-run goal, and provided that longer-term inflation expectations remain well anchored.
When the Committee decides to begin to remove policy accommodation, it will take a balanced approach consistent with its longer-run goals of maximum employment and inflation of 2 percent. The Committee currently anticipates that, even after employment and inflation are near mandate-consistent levels, economic conditions may, for some time, warrant keeping the target federal funds rate below levels the Committee views as normal in the longer run.
With the unemployment rate nearing 6-1/2 percent, the Committee has updated its forward guidance. The change in the Committee's guidance does not indicate any change in the Committee's policy intentions as set forth in its recent statements.
Voting for the FOMC monetary policy action were: Janet L. Yellen, Chair; William C. Dudley, Vice Chairman; Richard W. Fisher; Sandra Pianalto; Charles I. Plosser; Jerome H. Powell; Jeremy C. Stein; and Daniel K. Tarullo.
Voting against the action was Narayana Kocherlakota, who supported the sixth paragraph, but believed the fifth paragraph weakens the credibility of the Committee's commitment to return inflation to the 2 percent target from below and fosters policy uncertainty that hinders economic activity.
03/19/14 S&P500
>> 03/12/14
>> The minimum gauge to say a sizeable pullback is commencing
>> is 1849.20 (0.236 1737.92-1883.57),
>> tentative target is 1806.84-1836.44
intraday high 1874.14, this is in-progress data
synopsis:
frame 1883.57 - 1839.57 (03/14), 0.786 @ 1874.15
wait for auntie Janet's Posture
03/19/14 Gold & GDX
update from prior post
>> 03/14 Gold
>> Gold has a resistance around 1396, support is around 1370-1376
>>
>> 02/28 GDX
>> a minimum bounce requirement is 0.236/28.50,
(1) Gold
Day's Range: 1,337.70 - 1,360.10
source: http://www.investing.com/commodities/gold-historical-data
Gold future breached 1392.5 (03/16), fit the second up "pulse" in chart 3 roughly, however, the pullback is deeper than expected.
In overall:
- barring unexpected factors, gold is on schedule to the target zone (1423.51-1427.72) – 1432.92 (prefer 1425 +/-)
- timing: is around the juncture of April/May +/-.
- critical support is 1312 (chart 1, 0.382) – 1315.4 (chart 3)
- highly speculative
(2) GDX
GDX deployed an intraday high 28.03 on 03/14 then reversed, this action proved 28.5/0.236 is a meaningful pivot.
chart 1

chart 2 the 50-day SMA is going to cross above the 200-day SMA

chart (3) 03/01/14

chart 4 GDX intraday high 28.03 on 03/14

>> Rotor: I read the article via your link.
Re: exporting natural gas and geopolitics
it is amazing that author can link LNG to Energy to Ukraine to ... Gee!
I put my reply into 3 parts
(1) LNG
Whether there is a federal level regulation & Law that define the safety for LNG terminals is beyond my scope. Apparently, there are more than hundred terminals in operational worldwide.
LNG - Frequently Asked Questions
How is LNG shipped?
Where do ships unload LNG?
How is public safety addressed?
Full text: http://www.cheniere.com/sabine_liquefaction/frequently_asked_questions.shtml
List of LNG terminals
http://en.wikipedia.org/wiki/List_of_LNG_terminals#United_States_and_Puerto_Rico
LNG Terminals
http://www.cheniere.com/LNG_terminals/terminals.shtml
World's LNG Liquefaction Plants and Regasification Terminals
http://www.globallnginfo.com/World%20LNG%20Plants%20&%20Terminals.pdf
(2) Russia China oil/Gas pipeline
Russia-China oil pipeline opens
http://www.bbc.co.uk/news/world-asia-pacific-12103865
The first oil pipeline linking the world's biggest oil producer, Russia, and the world's biggest consumer of energy, China, has begun operating.
Altai gas pipeline
http://en.wikipedia.org/wiki/Altai_gas_pipeline
The Altai gas pipeline is a proposed natural gas pipeline to export natural gas from Russia's Western Siberia to North-Western China.
The memorandum on deliveries of Russian natural gas to China was signed by Gazprom CEO Alexei Miller and CNPC CEO Chen Geng during Russian president Vladimir Putin's visit to China in March 2006. The project was put on hold due to disagreements over natural gas price and competition from other gas sources in the Chinese market.
China and Russia seem genuinely close to a game-changing natural gas deal
By Steve LeVine @stevelevine January 7, 2014
http://qz.com/164163/china-and-russia-seem-genuinely-close-to-a-game-changing-natural-gas-deal/
The idea is to ship Russian gas into four dispersed Chinese entry points along the 2,500-mile route of a new pipeline called the Power of Siberia (jpg). The price of the gas—which has been the sticking point the whole time—will be between $10 and $11 per thousand British thermal units, about the same as it costs in Europe, according to the Financial Times. This represents a compromise by China, which had insisted on a lower price close to the $9 per thousand BTUs that it pays for its piped gas from Turkmenistan.
Gazprom Says China Natural Gas Deal Delayed to Putin’s May Visit
By Elena Mazneva Jan 22, 2014 5:50 AM PT
http://www.bloomberg.com/news/2014-01-22/gazprom-says-china-natural-gas-deal-delayed-to-putin-s-may-visit.html
“We expect the contract to be signed in the course of 2014,”
Ronald Smith, an oil and gas analyst at Citigroup Inc. in Moscow said by e-mail. “We continue to list the China contract as one of the three key catalysts for Gazprom in 2014.”
(3) Ukraine “incident”
The ongoing Ukraine 'incident' can be viewed in different angles. It is a ‘preemptive strategic’ plan that (someone) try to dilute the influence and significance of Germany in the future Europe power map. One obvious way is to enlarge the zone of NATO eastward.
However, there is a big 'blue print' plotted (implicitly) by Germany, China, and Russia to establish a continental to continental link among the 'Big three', therefore push the US to be an ‘isolated’ ocean power.
Europe nations 'love' to duck on the Obama’s 'supervisory principles’, they know these 'principles' will lead to an 'exhaustion' of US, in the meantime, by supporting captain Obama, Europe nations will receive ‘incentive’ from US. When the big brother becomes ‘incurable’, Their leader Germany will shake hand with Russia and China. (see background info), A new Era begins.
A few good advisers on this topic
How the Ukraine crisis ends
By Henry A. Kissinger, Published: March 5
Leaders of all sides should return to examining outcomes, not compete in posturing. Here is my notion of an outcome compatible with the values and security interests of all sides:
1. Ukraine should have the right to choose freely its economic and political associations, including with Europe.
2. Ukraine should not join NATO.
3. Ukraine should be free to create any government compatible with the expressed will of its people. (skip)
4. It is incompatible with the rules of the existing world order for Russia to annex Crimea. But it should be possible to put Crimea’s relationship to Ukraine on a less fraught basis. (skip)
Full text:
http://www.washingtonpost.com/opinions/henry-kissinger-to-settle-the-ukraine-crisis-start-at-the-end/2014/03/05/46dad868-a496-11e3-8466-d34c451760b9_story.html
Chess in a Minefield: The Global Implications of the Ukraine Conflict
By Uwe Klussmann
http://www.spiegel.de/international/world/the-geopolitical-implications-of-conflict-in-ukraine-a-954724.html
Brzezinski would love to have put Moscow in checkmate. In his book "The Grand Chessboard," he writes that without Ukraine, Russia "would become predominantly an Asian imperial state" at risk of being drawn into conflicts in Central Asia. But if Moscow were able to gain control of Ukraine and its resources, Brzezinski wrote, the Russian Federation would be a "powerful imperial state." He saw danger in a potential "German-Russian collusion" and in the possibility of an agreement between Europe and Russia with the goal of pushing America out of the region.
Essentially, Brzezinski's point of view is one that guides American strategy to this day: The US wants to keep Russia as far away as possible. If the Europeans get involved in Ukraine and harm their relations with Moscow, that is fine with Washington.
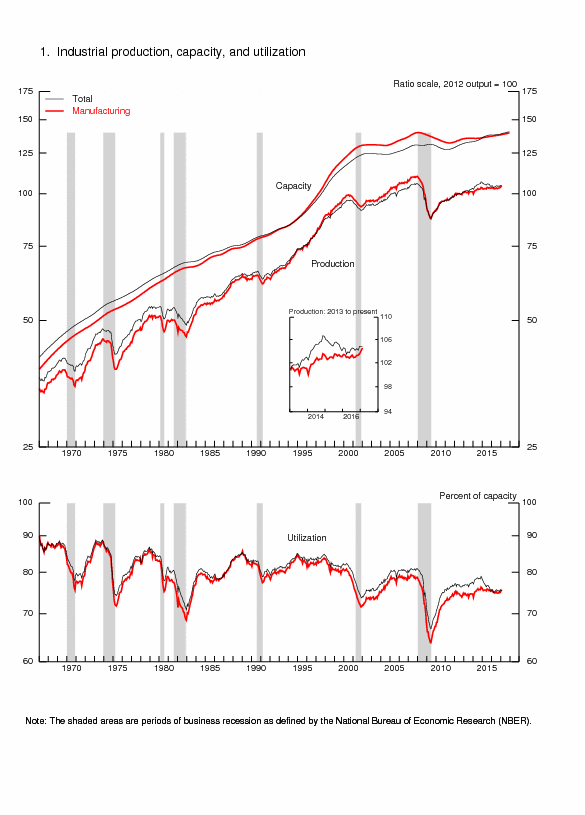
03/18/2014 On fundamentals
Industrial Production and Capacity Utilization
Release Date: March 17, 2014
http://www.federalreserve.gov/RELEASES/G17/current/default.htm
Industrial production increased 0.6 percent in February after having declined 0.2 percent in January.
In February, manufacturing output rose 0.8 percent and nearly reversed its decline of 0.9 percent in January, which resulted, in part, from extreme weather.
The gain in factory production in February was the largest since last August.
03/18/2014 HSBC
information only, do your own DD
HSBC Holdings ( NYSE ADR)
Market Capitalization (Large Cap) $187.3B
Quarterly Dividend $0.95
Forward P/E 10.93
at critical support

03/18/2014 LNG . . . . . . .
(information only, do your own DD)
GLNG - Golar LNG Ltd
TGP - Teekay LNG Partners LP
GMLP - Golar LNG Partners LP
CQP - Cheniere Energy Partners LP
3 LNG Companies To Benefit From Ukraine's Crisis
Mar. 9, 2014 6:05 AM ET
http://seekingalpha.com/article/2076473-3-lng-companies-to-benefit-from-ukraines-crisis?source=yahoo
LNG vessels (tanker, carrier) are dominated by South Korea, Japan, and China
(a relative older report but very informative)
LNG - A liquid market
Thanks to LNG, spare gas can now be sold the world over
Jul 14th 2012
http://www.economist.com/node/21558456
Chinese making a global mark in building LNG vessels
Friday, 28 February 2014 | 16:00
http://www.hellenicshippingnews.com/News.aspx?ElementId=a197bf1a-ba05-4ef0-a7b7-dd0abdeb9390
Chinese shipbuilders secured 23% of the global orders in liquefied natural gas tanker construction in 2013
South Korea’s Daewoo and Samsung Heavy Industries took 68% of the orders in 2013.
Asian LNG Tanker Builders Vie for Market Share
Chinese and Japanese Shipyards Are Set to Challenge South Korea's Market Dominance
Dec. 20, 2013 12:39 a.m. ET
http://online.wsj.com/news/articles/SB10001424052702304866904579269290895618508
"Orders of new LNG carriers in the next five years could be between 100 and 200, depending on how many North American projects come to pass," said Yoshikazu Nakaya, a shipping analyst with Mizuho Bank. "South Korean and Japanese shipbuilders will take most of them, but Chinese shipbuilders may get a small part."
Of 134 LNG tankers built since 2009, 100 were made by South Korean companies, 20 by Chinese companies and 13 by Japanese yards, according to shipping-data provider IHS Maritime.
03/15/14 long term perspective . . . . .
>> 02/28/14 link
>> Index takes out important pivots 1860.11 (highlighted in green in the wave table),
>> the 1900 zone is becoming ‘reachable’;
>> wave table: http://forexrainbow.com/images/05784777282136429201.jpg
>> whether the (middle to long term) target 1944.65 (highlighted in red) will be
>> materialized is depending on how the pullback looks like.
Let’s review an old case:
Mar 8 2012, 02:34 PM
By reviewing the 0.618 retracements for each fractals in the following chart.
It is very clear that 1269.48 is a critical check point. The index has to ‘grow’
higher so that the 0.618 pullback will not be lower than 1267.06.
0.618 1378.04 1202.37 = 1269.48
0.618 1378.04 1158.66 = 1242.46
0.618 1378.04 1074.77 = 1190.62


SilentOne
Friday, 03/07/14 11:28:21 AM
http://investorshub.advfn.com/boards/read_msg.aspx?message_id=98437832
4.5 Yr Hurst straddle trough. As I posted in Jan., I see a real risk that this market corrects hard into the next 18 month cycle low. If this is going to occur, a decline should start very soon and complete by this summer. My view hasn't changed.
SilentOne - J.M. Hurst and The 4 Year Presidential Cycle
Posted on January 28, 2014
http://sentienttrader.com/hurst-trading-room/blog/j-m-hurst-4-year-presidential-cycle/
This 4 year Presidential cycle, which runs 46-47 months, all but disappeared in 2005. While the cycle shows clearly on most DOW stocks with lows in 1994, 1998, and 2002, we never saw an appropriate low in 2006 or 2010. One could argue that this cycle was masked by larger cycles at play, and what resulted in the 2008-2009 debacle. Dewey also believed that although a cycle might disappear from view, it would eventually return with the same periodicity and rhythm as before. It is extremely likely that 2014 will see the return of this cycle which is due for a low in July 2014.

>> Shanghai Stock Exchange Composite Index . .
(a safer) buy point 1775
July 17, 2012, 5:09:19 AM
time stamp link

2013

2014

03/14/14 Gold & GDX . . . .
>> 03/01 Gold
>> detail timing & target in this post
Day's Range: 1,368.30 - 1,388.40
source: http://www.investing.com/commodities/gold-historical-data
Gold has a resistance around 1396, support is around 1370-1376
>> 02/28 GDX
>> a minimum bounce requirement is 0.236/28.50,
admittedly, if one waits till GDX breaks 28.5, a "large portion" of the "early bird preminum" is gone. It is the risk management that varies among the technicians.
chart 02/28 http://forexrainbow.com/images/44460034812378509181.jpg
Oddlot Thank You
03/13/14 S&P500 . . . . . .
>> 03/12/14 link
>> The minimum gauge to say a sizeable pullback is commencing
>> is 1849.20 (0.236 1737.92-1883.57),
>> tentative target is 1806.84-1836.44
intraday low 1846.52, this is a in-progress data
The gauge 1849.20 has been 'accessed', closing below it, the correction is commencing 'officially'.
The 50 SMA @ 1829.00 ( http://stockcharts.com/h-sc/ui?s=spx ) is flatting out
range 1 1836.44-1818.54
pivot 1793.58
range 2 1806.84-1777.70
strong support 1739.24-1737.04
timing chart:
March 2, 2014, 8:05:07 PM

03/12/14 S&P & Gold . . . .
>> 03/02 S&P
>> link
>> put together the consideration on a weekly closing basis,
>> the current ramp “should” not extend beyond 03/07.
>>
>> a spike high in this week (03/03-03/07) increases the potential for a
>> subsequent peak around 05/12 +/- (need tuning after the spike)
on 03/07, S&P500 marked an intraday high 1883.57, so, we got the spike high.
and then it reversed. The minimum gauge to say a sizeable pullback is commencing is 1849.20 (0.236 1737.92-1883.57), tentative target is 1806.84-1836.44
timing chart:
March 2, 2014, 8:05:07 PM
>> 03/01 Gold
>> link
>> (1) The critical support zone is 1315.4-1296.4 (0.236-0.382).
>>
>> (2) assume (1) holds, the mean projection for a potential high target is 1432.9 +/-.
>> If this target transpires, in overall, it is a flat expansion with double tops,
>> i.e, 1433.5 & 1432.9 (see chart)
on 03/12, Gold reaches 1369 http://www.investing.com/commodities/gold-historical-data
March 1, 2014, 7:40:22 PM
ECRI Recession Watch & FED Industrial Production .
Industrial Production and Capacity Utilization

Release Date: February 14, 2014
http://www.federalreserve.gov/RELEASES/G17/current/default.htm
Perspective. Over the 1972-2012 period, the average total industry utilization rate was 80.2 percent; for manufacturing, the average factory operating rate was 78.7 percent. Industrial plants usually operate at capacity utilization rates that are well below 100 percent: none of the broad aggregates has ever reached 100 percent. For total industry and total manufacturing, utilization rates have exceeded 90 percent only in wartime. The highs and lows in capacity utilization shown in table 11 are specific to each series and do not all occur in the same month.
ECRI Recession Watch: Weekly Update
By Doug Short March 7, 2014
The Weekly Leading Index (WLI) of the Economic Cycle Research Institute (ECRI) is at 135.5, up from 131.8 last week.
ECRI has been at the center of a prolonged controversy since publicizing its recession call on September 30, 2011. The company had made the announcement to its private clients on September 21st.
ECRI's Latest Public Commentary
The ECRI Indicator Year-over-Year
Why ECRI's Recession Forecast Was a Blunder
full text & chart:
http://www.advisorperspectives.com/dshort/updates/ECRI-Weekly-Leading-Index.php

