 News
News  Market Data
  Discover
Support: 888-992-3836
Copyright © 2023 InvestorsHub Inc.


likwit
![]()
Register for free to join our community of investors and share your ideas. You will also get access to streaming quotes, interactive charts, trades, portfolio, live options flow and more tools.
Register for free to join our community of investors and share your ideas. You will also get access to streaming quotes, interactive charts, trades, portfolio, live options flow and more tools.
BUYER BEWARE
try calling the company... LOL.. they;ve taken all the phones off the hook.. ALL BUSY ALL THE TIME...
even at 11:30p.m. on a Thursday... maybe you'll have better luck..
she's a dog... plain and simple.. IMHO OF COURSE
Contacts
Wherify Wireless
John Cunningham, 650-551-5271
(Director of Communications)
jcunningham@wherify.com
Joe Noel, 650-551-5231 (Investor Relations)
jnoel@wherify.com
Phone: (650) 551-5200
been buying under .035 since April 10th... This one will have its day SOON....
unloaded on that last pop in Feb..
reload time...
2008/02/01 2008/02/06 -4000 LEISURE DIRECT INC LDTI 0.12 470.00
2008/02/01 2008/02/06 -16000 LEISURE DIRECT INC LDTI 0.125 1989.98
2008/01/30 2008/02/04 -10000 LEISURE DIRECT INC LDTI 0.115 1139.99
2008/01/24 2008/01/29 10000 LEISURE DIRECT INC LDTI 0.06 -609.99
2007/12/03 2007/12/06 20000 LEISURE DIRECT INC LDTI 0.025 -509.99
easy money..
hot tubs?..
spring?..
did it just get brighter in here?
let's go boyzz...
Activision Reports Record Q4 and Fiscal Year 2008 Results Marking 16 Consecutive Years of Revenue Growth
THURSDAY, MAY 08, 2008 4:02 PM
- BusinessWire
ATVI 27.70 +0.21
SANTA MONICA, Calif., May 08, 2008 (BUSINESS WIRE) -- Activision, Inc. (ATVI) today announced record fiscal year 2008 and fourth quarter results.
Net revenues for the fiscal year ended March 31, 2008 were $2.90 billion, as compared to $1.51 billion for the fiscal year ended March 31, 2007. Net income for the fiscal year was $344.9 million, or $1.10 in earnings per diluted share, as compared to net income of $85.8 million, or $0.28 in earnings per diluted share reported for the last fiscal year. Excluding the impact of expenses related to equity-based compensation, the company reported non-GAAP net income of $377.5 million and non-GAAP earnings per diluted share of $1.20 for the fiscal year. This compares to non-GAAP net income of $101.3 million and non-GAAP earnings per diluted share of $0.33 for the last fiscal year, in each case excluding the impact of expenses related to equity-based compensation.
Net revenues for the fourth quarter ended March 31, 2008 were $602.5 million, as compared to $312.5 million that the company reported for the fourth quarter of the last fiscal year. For the fourth quarter, the company reported net income of $44.2 million, or earnings per diluted share of $0.14, as compared to a net loss of $14.4 million, or a loss per share of $0.05, for the fiscal year 2007 fourth quarter. Excluding the impact of expenses related to equity-based compensation expense, the company reported non-GAAP net income of $54.9 million and non-GAAP earnings per diluted share of $0.17 for the quarter. This compares to a non-GAAP net loss of $10.1 million and a non-GAAP loss per share of $0.04 for the fourth quarter of last fiscal year, in each case excluding the impact of expenses related to equity-based compensation.
Robert Kotick, Chairman and CEO of Activision, Inc. commented, "Fiscal 2008 was the best year in our history and Q4 was the largest and most profitable non-holiday quarter, even though we did not release any new titles. During the fiscal year, we were the #1 U.S. console and handheld publisher in dollars for the first time ever, according to The NPD Group, and we grew our worldwide share of the console, handheld and PC markets year over year. We achieved record financial performance significantly growing both net revenues and earnings per share. And, we delivered a record operating margin of 16.5% on a GAAP basis, and 18.4% on a non-GAAP basis, excluding the impact of equity-based compensation, and we increased stockholders' equity by 38%."
Kotick continued, "In fiscal 2009, we expect to deliver another year of growth. We remain committed to strengthening our global leadership position by continuing to execute on our growth strategies and cost-optimization initiatives. We own or control some of the most successful brands in interactive entertainment, and we will continue to focus our resources on proven properties with broad global appeal. Our solid lineup, which includes new titles based on such blockbuster brands as Call of Duty(R), Guitar Hero(R) and James Bond, should enable us to continue capitalizing on growth in interactive entertainment consumption worldwide."
Kotick added, "With respect to our pending combination with Vivendi Games, we are on track to complete our transaction, which will create the world's largest and most profitable independent video game company. We are pleased that Blizzard's business maintained its momentum, and combined with our continued business strength, we are well positioned to exceed the financial goals we have set for the combined company at the time of the deal announcement. The combination of Activision's solid portfolio and Vivendi Games proven properties should enable us to continue delivering exceptional returns to our stockholders."
Business Highlights
Activision's fiscal year results were driven by strong worldwide consumer response to Call of Duty(R) 4: Modern Warfare(TM), Guitar Hero(R) III: Legends of Rock, Spider-Man 3(TM), Shrek The Third(TM), as well as its new licensed intellectual property TRANSFORMERS: The Game.
The company's fourth quarter results were driven by strong market conditions and the continued success of Guitar Hero III: Legends of Rock and Call of Duty 4: Modern Warfare.
-- During the fiscal year, in the U.S., Activision grew its market share by 7.2% to a record 17.3%, was the #1 console and handheld software publisher in dollars, and had three top-10 best-selling titles in dollars overall according to The NPD Group.
-- For the fiscal year, Activision set an industry record for U.S. sell-through in dollars by a single publisher, according to The NPD Group.
-- Guitar Hero III: Legends of Rock was the #1 best-selling game in the U.S. and Europe in dollars during the fiscal year, according to The NPD Group, Charttrack and Gfk.
-- For the fiscal year, Call of Duty 4: Modern Warfare was the #2 best-selling game worldwide in units, selling more than 9 million units as of March 31, 2008, according to The NPD Group, Charttrack and Gfk.
-- For the fiscal year, Call of Duty 4: Modern Warfare was the #1 best-selling PC title in dollars worldwide, according to The NPD Group, Charttrack and Gfk.
-- During the fiscal year, both the Guitar Hero and Call of Duty franchises surpassed a billion dollars in life to date sales.
-- Spider-Man 3(TM) and TRANSFORMERS: The Game were the #1 and #2 best-selling movie based games in dollars worldwide for fiscal year 2008, according to The NPD Group, Charttrack and Gfk.
-- Activision grew its European market share from 4.8% to 7.4% during the fiscal year, according to Charttrack and Gfk.
-- Activision's international publishing revenues grew in excess of 100% year over year.
-- According to The NPD Group, for the fourth quarter, Activision ranked as the #1 U.S. console, handheld and PC publisher in dollars.
-- On September 26, 2007, Activision announced that it had acquired U.K.-based developer Bizarre Creations, one of the world's premier video game developers and a leader in the racing category. The acquisition enables Activision to enter the $1.5 billion racing category, which is the seventh most popular videogame genre and represented more than 7.5% of the total video game market worldwide in calendar 2007, according to The NPD Group, Charttrack and Gfk.
-- On December 1, 2007, Activision and Vivendi entered into a definitive agreement to combine Vivendi Games, Vivendi's interactive entertainment business -- which includes Blizzard Entertainment's(R) World of Warcraft(R), the world's #1 massively multiplayer online role playing game franchise with more than 10 million global subscribers -- with Activision, which at closing will create the world's largest pure-play online and console game publisher. The transaction remains subject to approval by Activision's stockholders and other customary closing conditions.
Company Outlook
For the first quarter of fiscal 2009, Activision will release Enemy Territory(TM): QUAKE WARS for the Xbox 360(R) video game and entertainment system from Microsoft and PLAYSTATION(R)3 computer entertainment system; Kung Fu Panda, on the Xbox 360 video game and entertainment system from Microsoft and PLAYSTATION 3 computer entertainment system, PlayStation 2 computer entertainment system, the Nintendo(R) Wii(TM), Games for Windows(R) and the Nintendo DS(TM); Guitar Hero(R): On Tour for the Nintendo DS; and Guitar Hero(R): Aerosmith(R) for the Xbox 360 video game and entertainment system from Microsoft, PLAYSTATION 3 computer entertainment system, PlayStation 2 computer entertainment system and the Nintendo Wii.
Activision announced today that online functionality for certain key titles to be released in the December quarter of fiscal year 2009 and thereafter is expected to become a significant component of game play for certain platforms for which the company will have continuing performance obligations beyond the sale of the game. As a result, the company expects to begin recognizing a substantial amount of net revenues and costs of sales from these online-enabled games over a service period, which we currently estimate to be six months beginning the month after shipment.
Activision anticipates that a considerable amount of net revenues and costs of sales that would have been recognized in the fiscal year ending March 2009 will be recognized later in the calendar year 2009. While this will not impact the economics of Activision's business or its cash flows, these changes will have a material impact on the company's fiscal year 2009 GAAP results.
In order to provide comparable year-over-year performance information, Activision's non-GAAP results will exclude the impact of the change in deferred net revenues and cost of sales related to those online-enabled key titles on certain platforms.
Additionally, in fiscal year 2009, Activision's non-GAAP results will exclude one-time costs related to the Vivendi transaction.
For fiscal year 2009, on a stand-alone basis, (not including Vivendi Games), Activision expects net revenues of $2.75 billion and earnings per diluted share of $0.72.
For fiscal 2009, Activision expects stand-alone non-GAAP net revenues, excluding the impact of the change in deferred revenue related to online-enabled games, to be $3.1 billion. Excluding the impact of equity-based compensation expense ($0.12 per share), one-time costs related to the Vivendi transaction ($0.07 per share) and the impact of the change in deferred net revenues and cost of sales related to online-enabled games ($0.39 per share), Activision expects stand-alone non-GAAP earnings per diluted share of $1.30.
For the first quarter, Activision expects net revenues of $500.0 million and earnings per diluted share of $0.04 on a stand-alone basis. Excluding the impact of equity-based compensation expense ($0.02 per share) and one-time costs related to the Vivendi transaction ($0.07 per share), the company's stand-alone non-GAAP earnings per diluted share outlook is expected to be $0.13.
Conference Call
Today at 4:30 p.m. EDT, Activision's management will host a conference call and Webcast to discuss its fiscal 2008 year-end results and outlook for fiscal 2009. The company welcomes all members of the financial and media communities, and other interested persons, to visit the "Investor Relations" area of www.activision.com to listen to the conference call via a live Webcast or to listen to the call live by dialing in at 719-325-4752 in the U.S.
Non-GAAP Financial Measures
Activision provides net income (loss) and earnings (loss) per share data both including (in accordance with GAAP) and excluding (non-GAAP) the impact of expenses related to employee stock options, employee stock purchase plans, restricted stock rights and other equity-based compensation and the associated tax benefits, and in the future Activision's non-GAAP results will also exclude the impact of the change in deferred net revenues and costs of sales, and one-time costs related to the Vivendi transaction.
Additionally, following the completion of the Vivendi transaction, Activision will exclude from its non-GAAP results the impact of expenses related to intangible amortization, as well as any one-time restructuring costs and results related to the discontinuation of operations should there be any.
Prior to April 1, 2006, Activision accounted for equity-based compensation under Accounting Principles Board Opinion No. 25, "Accounting for Stock Issued to Employees" ("APB No. 25"). In accordance with APB No. 25, the company historically used the intrinsic value method to account for equity-based compensation. Beginning on April 1, 2006, Activision has accounted for equity-based compensation using the fair value method under Statement of Financial Accounting Standards No. 123 (revised 2004), "Share-Based Payment" ("FAS 123(R)").
As online functionality becomes a more important component of gameplay, in fiscal 2009, the company expects that certain online-enabled games, to be released in fiscal 2009, will contain a more-than-inconsequential separate service deliverable in addition to the product, and its performance obligations for these games extend beyond the sale of the games. Vendor-specific objective evidence ("VSOE") of fair value does not exist for the online services, as the company does not plan to separately charge for this component of online-enabled games.
As a result, for certain key titles to be released in the December quarter of fiscal year 2009 and thereafter, the company will recognize all of the revenues from the sale of certain online-enabled games for certain platforms ratably over an estimated service period, which it currently estimates to be six months beginning the month after shipment. In addition, it will defer the costs of sales of those titles. As a consequence, the company's non-GAAP results will exclude the impact of the change in deferred revenue and costs of sales related to certain online-enabled games for certain of the Microsoft, Sony, Nintendo and PC platforms in order to provide comparable year-over-year performance.
Additionally, in order to provide comparable year-over-year performance, as of June 30, 2008, Activision will exclude from its non-GAAP operating results the impact of one-time costs related to the Vivendi transaction.
Non-GAAP net revenue, non-GAAP net income (loss), non-GAAP earnings (loss) per share, and non-GAAP operating margin, excluding the impact of changes in deferred net revenues and cost of sales, one-time costs related to the Vivendi transaction and expenses related to equity-based compensation, are not determined in accordance with GAAP, and the exclusion of those items has the effect of increasing non-GAAP net revenue, non-GAAP net income, non-GAAP earnings per share and non-GAAP operating margin (and reducing non-GAAP net loss and non-GAAP loss per share) by the same amounts as compared with GAAP net revenue, GAAP net income (loss), GAAP earnings (loss) per share and GAAP operating margin for the period. Activision recognizes that there are limitations associated with the use of these non-GAAP financial measures as they do not reflect net revenue, net income (loss), earnings (loss) per share and operating margin as determined in accordance with GAAP, and may reduce comparability with other companies that calculate similar non-GAAP measures differently.
Management compensates for the limitations resulting from the exclusion of these items by considering the impact of these items separately and by considering Activision's GAAP as well as non-GAAP results and outlook and, in this release, by presenting the most comparable GAAP measures, net revenue, net income (loss), earnings (loss) per share and operating margin directly ahead of non-GAAP net revenue, non-GAAP net income (loss), non-GAAP earnings (loss) per share, and non-GAAP operating margin, and by providing a reconciliation which indicates and describes the adjustments made.
Management believes that the presentation of these non-GAAP financial measures provides investors with additional useful information to measure Activision's financial and operating performance because they allow for a better comparison of results between periods. Management further believes that reflecting the use of non-GAAP measures that eliminate the impact of deferred revenues and costs of sales in its operating results is important to facilitate comparisons to prior periods during which the application of its accounting policies did not result in deferral of significant amounts of revenues and costs of sales related to online-enabled games. Internally, management uses these non-GAAP financial measures in assessing the company's operating results, as well as in planning and forecasting.
These non-GAAP financial measures should be considered in addition to, not as a substitute for or superior to, financial measures determined in accordance with GAAP.
These non-GAAP financial measures are not based on a comprehensive set of accounting rules or principles, and the terms non-GAAP net revenue, net income (loss), non-GAAP earnings (loss) per share, non-GAAP operating margin do not have a standardized meaning. Therefore, other companies may use the same or similarly named measures, but exclude different items, which may not provide investors a comparable view of Activision's performance in relation to other companies.
About Activision
Headquartered in Santa Monica, California, Activision, Inc. is a leading worldwide developer, publisher and distributor of interactive entertainment and leisure products. Founded in 1979, Activision posted net revenues of $2.90 billion for the fiscal year ended March 31, 2008.
Activision maintains operations in the U.S., Canada, the United Kingdom, France, Germany, Ireland, Italy, Sweden, Spain, the Netherlands, Australia, Japan and South Korea. More information about Activision and its products can be found on the company's website, www.activision.com.
Cautionary Note Regarding Forward-looking Statements: Information in this press release that involves Activision's expectations, plans, intentions or strategies regarding the future are forward-looking statements that are not facts and involve a number of risks and uncertainties. In this release, they are identified by references to dates after the date of this release and words such as "outlook", "will," "remains," "to be," "plans," "believes", "may", "expects," "intends," and similar expressions.
Factors that could cause Activision's actual future results to differ materially from those expressed in the forward-looking statements set forth in this release include, but are not limited to, sales of Activision's titles in its fiscal year 2009, shifts in consumer spending trends, the seasonal and cyclical nature of the interactive game market, Activision's ability to predict consumer preferences among competing hardware platforms (including next-generation hardware), declines in software pricing, product returns and price protection, product delays, retail acceptance of Activision's products, adoption rate and availability of new hardware and related software, industry competition, rapid changes in technology and industry standards, protection of proprietary rights, maintenance of relationships with key personnel, customers, vendors and third-party developers, domestic and international economic, financial and political conditions, foreign exchange rates, integration of recent acquisitions and the identification of suitable future acquisition opportunities, the timing and successful completion of the combination of Activision and Vivendi Games, the combined company's success in integrating the operations of Activision and Vivendi Games in a timely manner, or at all, and the combined company's ability to realize the anticipated benefits and synergies of the transaction to the extent, or in the timeframe, anticipated. Other such factors include the further implementation, acceptance and effectiveness of the remedial measures recommended or adopted by the special sub-committee of independent directors established in July 2006 to review Activision's historical stock option granting practices, by the Board and by Activision, the outcome of the SEC's formal investigation, the finalization of the proposed settlement of the derivative litigation filed in July 2006 against certain current and former directors and officers of Activision relating to Activision's stock option granting practices, and the possibility that additional claims and proceedings will be commenced, including additional action by the SEC and/or other regulatory agencies, and other litigation (unrelated to stock option granting practices) and any additional risk factors identified in Activision's most recent annual report on Form 10-K and quarterly reports on Form 10-Q and the preliminary proxy statement most recent filed in connection with the proposed transaction with Vivendi. The forward-looking statements in this release are based upon information available to Activision as of the date of this release, and Activision assumes no obligation to update any such forward-looking statements. Forward-looking statements believed to be true when made may ultimately prove to be incorrect. These statements are not guarantees of the future performance of Activision, Vivendi Games or the combined company and are subject to risks, uncertainties and other factors, some of which are beyond its control and may cause actual results to differ materially from current expectations.
Important Additional Information has been and will be filed with the SEC
This communication is being made, in part, in respect of the proposed business combination involving Activision, Vivendi and Vivendi Games. In connection with the proposed transactions, Activision has filed with the Securities and Exchange Commission (SEC) a preliminary Proxy Statement and other documents regarding the proposed transactions, and plans to file with the SEC a definitive Proxy Statement as well as other documents regarding the proposed transactions. The definitive Proxy Statement will be mailed to stockholders of Activision.
INVESTORS AND SECURITY HOLDERS OF ACTIVISION ARE URGED TO READ THE PRELIMINARY PROXY STATEMENT AND OTHER RELEVANT MATERIAL FILED WITH THE SEC, AND THE DEFINITIVE PROXY STATEMENT AND OTHER DOCUMENTS TO BE FILED WITH THE SEC, CAREFULLY AND IN THEIR ENTIRETY WHEN THEY BECOME AVAILABLE BECAUSE THEY WILL CONTAIN IMPORTANT INFORMATION ABOUT THE PROPOSED TRANSACTIONS.
Investors and security holders may obtain free copies of the preliminary Proxy Statement and other documents filed with the SEC by Activision, and will be able to obtain free copies of the Proxy Statement (when available) and other relevant documents to be filed with the SEC by Activision, through the website maintained by the SEC at http://www.sec.gov.
Free copies of the preliminary Proxy Statement (and the definitive Proxy Statement, when available) and other documents filed with the SEC can also be obtained by directing a request to Activision's Investor Relations department.
Activision and its directors and executive officers and other persons may be deemed to be participants in the solicitation of proxies in respect of the proposed transaction. Information regarding Activision's directors and executive officers is available in its Annual Report on Form 10-K for the year ended March 31, 2007, which was filed with the SEC on June 14, 2007, and its proxy statement for its 2007 annual meeting of stockholders, which was filed with the SEC on July 30, 2007. Other information regarding the participants in the proxy solicitation and a description of their direct and indirect interests, by security holdings or otherwise, are contained in the preliminary Proxy Statement and will be contained in other relevant materials filed with the SEC (and will be contained in the definitive Proxy Statement and other relevant materials to be filed with the SEC when they become available).
THIS DOCUMENT IS FOR INFORMATIONAL PURPOSES ONLY AND IS NOT AN OFFER TO BUY OR THE SOLICITATION OF AN OFFER TO SELL ANY SECURITIES. THE SOLICITATION AND THE OFFER TO BUY SHARES OF ACTIVISION'S COMMON STOCK WILL ONLY BE MADE PURSUANT TO AN OFFER TO PURCHASE AND RELATED MATERIALS THAT ACTIVISION INTENDS TO FILE WITH THE SEC. ONCE FILED, ACTIVISION STOCKHOLDERS SHOULD READ THESE MATERIALS CAREFULLY PRIOR TO MAKING ANY DECISIONS WITH RESPECT TO THE OFFER BECAUSE THEY CONTAIN IMPORTANT INFORMATION, INCLUDING THE TERMS AND CONDITIONS OF THE OFFER. ONCE FILED, ACTIVISION STOCKHOLDERS WILL BE ABLE TO OBTAIN THE OFFER TO PURCHASE AND RELATED MATERIALS WITH RESPECT TO THE OFFER FREE OF CHARGE AT THE SEC'S WEBSITE AT HTTP://WWW.SEC.GOV, OR FROM THE INFORMATION AGENT NAMED IN THE TENDER OFFER MATERIALS.
Cautionary Note Regarding Financial Information Concerning Vivendi and its Subsidiaries: Except as specifically described herein, the information concerning Vivendi, Vivendi Games and Blizzard contained in this press release has been taken from or is based upon information furnished by Vivendi or its representatives. Activision has no knowledge that would indicate that any statements contained herein based on such documents and records are untrue. However, neither Activision nor any of its affiliates assumes any responsibility for the accuracy, currency or completeness of the information furnished by Vivendi concerning Vivendi, Vivendi Games or Blizzard.
ACTIVISION, INC. AND SUBSIDIARIES
CONDENSED CONSOLIDATED STATEMENTS OF OPERATIONS
(In thousands, except earnings (loss) per share data)
------------------------------------ ----------- ---------- ----------
Quarter ended March 31, Year ended March 31,
------------------------------------------------ ---------------------
2008 2007 2008 2007
------------------------------------ ----------- ---------- ----------
(Unaudited) (Unaudited)
----------- ----------- ---------- ----------
Net revenues $602,451 $312,512 $2,898,136 $1,513,012
Costs and expenses:
Cost of sales - product
costs 274,334 181,425 1,240,605 799,587
Cost of sales - software
royalties and
amortization 51,986 26,295 294,279 132,353
Cost of sales -
intellectual property
licenses 23,909 8,287 110,551 46,125
Product development 79,052 44,678 269,535 133,073
Sales and marketing 67,473 40,074 308,143 196,213
General and
administrative 51,164 40,867 195,409 132,514
------------------------------------ ----------- ---------- ----------
Total costs and
expenses 547,918 341,626 2,418,522 1,439,865
------------------------------------ ----------- ---------- ----------
Operating income (loss) 54,533 (29,114) 479,614 73,147
Investment income, net 15,542 10,647 51,254 36,678
------------------------------------ ----------- ---------- ----------
Income (loss) before
income tax provision
(benefit) 70,075 (18,467) 530,868 109,825
Income tax provision
(benefit) 25,912 (4,045) 185,985 24,038
------------------------------------ ----------- ---------- ----------
Net income (loss) $ 44,163 $(14,422) $ 344,883 $ 85,787
==================================== =========== ========== ==========
------------------------------------ ----------- ---------- ----------
Basic earnings (loss) per
share $ 0.15 $ (0.05) $ 1.19 $ 0.31
Weighted average common
shares outstanding 293,764 282,991 288,957 281,114
------------------------------------ ----------- ---------- ----------
------------------------------------ ----------- ---------- ----------
Diluted earnings (loss)
per share $ 0.14 $ (0.05) $ 1.10 $ 0.28
Weighted average common
shares outstanding
assuming dilution 318,784 282,991 314,731 305,339
------------------------------------ ----------- ---------- ----------
ACTIVISION, INC. AND SUBSIDIARIES
CONDENSED CONSOLIDATED BALANCE SHEETS
(In thousands)
------------------------------------------------ ---------- ----------
March 31, March 31,
2008 2007
------------------------------------------------ ---------- ----------
ASSETS
------------------------------------------------ ---------- ----------
Current assets:
Cash, cash equivalents and short-term
investments $1,449,212 $ 954,849
Accounts receivable, net 203,420 148,694
Inventories 146,874 91,231
Software development 96,182 107,779
Intellectual property licenses 18,661 27,784
Deferred income taxes 41,242 51,564
Other current assets 23,804 19,332
------------------------------------------------ ---------- ----------
Total current assets 1,979,395 1,401,233
------------------------------------------------ ---------- ----------
Long-term investments 91,215 -
Software development 13,604 23,143
Intellectual property licenses 64,890 72,490
Property and equipment, net 54,528 46,540
Deferred income taxes 32,825 48,791
Other assets 15,055 6,376
Goodwill 279,161 195,374
------------------------------------------------ ---------- ----------
Total assets $2,530,673 $1,793,947
================================================ ========== ==========
------------------------------------------------ ---------- ----------
LIABILITIES AND SHAREHOLDERS' EQUITY
------------------------------------------------ ---------- ----------
Current liabilities:
Accounts payable $ 129,896 $ 136,517
Accrued expenses and other liabilities 426,175 204,652
------------------------------------------------ ---------- ----------
Total current liabilities 556,071 341,169
------------------------------------------------ ---------- ----------
Other liabilities 26,710 41,246
------------------------------------------------ ---------- ----------
Total liabilities 582,781 382,415
------------------------------------------------ ---------- ----------
Shareholders' equity:
Common stock - -
Additional paid-in capital 1,148,880 963,553
Retained earnings 772,660 427,777
Accumulated other comprehensive income 26,352 20,202
------------------------------------------------ ---------- ----------
Total shareholders' equity 1,947,892 1,411,532
------------------------------------------------ ---------- ----------
Total liabilities and
shareholders' equity $2,530,673 $1,793,947
================================================ ========== ==========
ACTIVISION, INC. AND SUBSIDIARIES
RECONCILIATION OF GAAP NET INCOME TO NON-GAAP NET INCOME
(In thousands, except earnings (loss) per share data)
--------------------- ---------- --------- -------- -------- ---------
Cost of Product Sales General Total
Sales - Develop- and and Costs
Software ment Market- Admini- and
Royalties ing strative Expenses
and
Quarter ended March Amorti-
31, 2008 zation
--------------------- ---------- --------- -------- -------- ---------
GAAP Measurement $51,986 $79,052 $67,473 $51,164 $547,918
Less: Equity-Based
Compensation
Adjustment(1) 1,097 7,466 1,728 7,340 17,631
---------- --------- -------- -------- ---------
Non-GAAP Measurement $50,889 $71,586 $65,745 $43,824 $530,287
--------------------- ========== ========= ======== ======== =========
Basic Diluted
Earnings Earnings
Operating Net (Loss) (Loss)
Income Income per per
Quarter ended March 31, 2008 (Loss) (Loss) Share Share
---------------------------------------- --------- --------- ---------
GAAP Measurement $ 54,533 $ 44,163 $ 0.15 $ 0.14
Less: Equity-Based
Compensation Adjustment(1) (17,631) (10,737) (0.04) (0.03)
--------- --------- --------- ---------
Non-GAAP Measurement $ 72,164 $ 54,900 $ 0.19 $ 0.17
-------------------------------========= ========= ========= =========
Cost of
Sales -
Software
Royalties Sales General
and Product and and Total
Year ended March 31, Amorti- Develop- Market- Admini- Costs and
2008 zation ment ing strative Expenses
------------------------------- --------- -------- -------- ----------
GAAP Measurement $294,279 $269,535 $308,143 $195,409 $2,418,522
Less: Equity-Based
Compensation
Adjustment(1) 10,898 17,610 6,833 18,224 53,565
---------- --------- -------- -------- ----------
Non-GAAP Measurement $283,381 $251,925 $301,310 $177,185 $2,364,957
---------------------========== ========= ======== ======== ==========
Basic Diluted
Earnings Earnings
Operating Net (Loss) (Loss)
Income Income per per
Year ended March 31, 2008 (Loss) (Loss) Share Share
---------------------------------------- --------- --------- ---------
GAAP Measurement $479,614 $344,883 $ 1.19 $ 1.10
Less: Equity-Based
Compensation Adjustment(1) (53,565) (32,621) (0.11) (0.10)
--------- --------- --------- ---------
Non-GAAP Measurement $533,179 $377,504 $ 1.31 $ 1.20
-------------------------------========= ========= ========= =========
(1) Includes expense related to employee stock options, employee stock
purchase plan and restricted stock rights under Statement of
Financial Accounting Standards No. 123 (revised 2004), "Share-Based
Payment." See explanation above regarding the Company's practice on
reporting non-GAAP financial measures. The per share equity-based
compensation adjustment is presented as calculated, and the GAAP and
non-GAAP earnings (loss) per share information is also presented as
calculated. The sum of these measures, as presented, may differ due
to the impact of rounding.
ACTIVISION, INC. AND SUBSIDIARIES
RECONCILIATION OF GAAP NET INCOME TO NON-GAAP NET INCOME
(In thousands, except earnings (loss) per share data)
-------------------------------- --------- -------- -------- ---------
Cost of
Sales -
Software
Royalties Sales General Total
and Product and and Costs
Quarter ended March Amorti- Develop- Market- Admini- and
31, 2007 zation ment ing strative Expenses
-------------------------------- --------- -------- -------- ---------
GAAP Measurement $26,295 $44,678 $40,074 $40,867 $341,626
Less: Equity-Based
Compensation
Adjustment(1) 631 1,664 1,779 3,015 7,089
---------- --------- -------- -------- ---------
Non-GAAP Measurement $25,664 $43,014 $38,295 $37,852 $334,537
----------------------========== ========= ======== ======== =========
Basic Diluted
Earnings Earnings
Operating Net (Loss) (Loss)
Income Income per per
Quarter ended March 31, 2007 (Loss) (Loss) Share Share
---------------------------------------- --------- --------- ---------
GAAP Measurement $(29,114) $(14,422) $(0.05) $(0.05)
Less: Equity-Based
Compensation Adjustment(1) (7,089) (4,317) (0.02) (0.02)
--------- --------- --------- ---------
Non-GAAP Measurement $(22,025) $(10,105) $(0.04) $(0.04)
-------------------------------========= ========= ========= =========
Cost of
Sales -
Software
Royalties Sales General
and Product and and Total
Year ended March 31, Amorti- Develop- Market- Admini- Costs and
2007 zation ment ing strative Expenses
------------------------------- --------- -------- -------- ----------
GAAP Measurement $132,353 $133,073 $196,213 $132,514 $1,439,865
Less: Equity-Based
Compensation
Adjustment(1) 2,503 5,728 5,267 12,024 25,522
---------- --------- -------- -------- ----------
Non-GAAP Measurement $129,850 $127,345 $190,946 $120,490 $1,414,343
---------------------========== ========= ======== ======== ==========
Basic Diluted
Earnings Earnings
Operating Net (Loss) (Loss)
Income Income per per
Year ended March 31, 2007 (Loss) (Loss) Share Share
---------------------------------------- --------- --------- ---------
GAAP Measurement $ 73,147 $ 85,787 $ 0.31 $ 0.28
Less: Equity-Based
Compensation Adjustment(1) (25,522) (15,543) (0.06) (0.05)
--------- --------- --------- ---------
Non-GAAP Measurement $ 98,669 $101,330 $ 0.36 $ 0.33
-------------------------------========= ========= ========= =========
(1) Includes expense related to employee stock options, employee stock
purchase plan and restricted stock rights under Statement of
Financial Accounting Standards No. 123 (revised 2004), "Share-Based
Payment." See explanation above regarding the Company's practice on
reporting non-GAAP financial measures. The per share equity-based
compensation adjustment is presented as calculated, and the GAAP and
non-GAAP earnings (loss) per share information is also presented as
calculated. The sum of these measures, as presented, may differ due
to the impact of rounding.
ACTIVISION, INC. AND SUBSIDIARIES
FINANCIAL INFORMATION
For the Quarter and Year Ended March 31, 2008
(Amounts in thousands)
Percent
Increase
Quarter Ended (Decrease)
----------------------------------- ----------
March 31, 2008 March 31, 2007
% of % of
Amount Total Amount Total
---------------------- ---------- ----------------- ------ ----------
Geographic Revenue Mix
North America $ 366,620 61% $ 116,125 37% 216%
International 235,831 39% 196,387 63% 20%
---------------------- ---------- ----------------- ------ ----------
Total net revenues $ 602,451 100% $ 312,512 100% 93%
---------------------- ---------- ----------------- ------ ----------
---------------------- ---------- ----------------- ------ ----------
Segment/Platform Mix
Publishing:
Console $ 446,595 74% $ 167,400 54% 167%
Hand-held 26,742 4% 32,232 10% -17%
PC 40,198 7% 9,443 3% 326%
---------------------- ---------- ----------------- ------ ----------
Total publishing net
revenues $ 513,535 85% $ 209,075 67% 146%
----------------------- ---------- ----------------- ------ ----------
Distribution:
Console $ 69,656 12% $ 74,022 24% -6%
Hand-held 14,320 2% 23,661 7% -39%
PC 4,940 1% 5,754 2% -14%
---------------------- ---------- ----------------- ------ ----------
Total distribution net
revenues $ 88,916 15% $ 103,437 33% -14%
----------------------- ---------- ----------------- ------ ----------
Total net revenues $ 602,451 100% $ 312,512 100% 93%
---------------------- ---------- ----------------- ------ ----------
Percent
Increase
Year Ended (Decrease)
----------------------------------- ----------
March 31, 2008 March 31, 2007
% of % of
Amount Total Amount Total
---------------------- ---------- ----------------- ------ ----------
Geographic Revenue Mix
North America $1,761,753 61% $ 753,376 50% 134%
International 1,136,383 39% 759,636 50% 50%
---------------------- ---------- ----------------- ------ ----------
Total net revenues $2,898,136 100% $1,513,012 100% 92%
---------------------- ---------- ----------------- ------ ----------
---------------------- ---------- ----------------- ------ ----------
Segment/Platform Mix
Publishing:
Console $2,129,799 73% $ 886,795 59% 140%
Hand-held 219,299 8% 153,357 10% 43%
PC 156,068 5% 78,886 5% 98%
---------------------- ---------- ----------------- ------ ----------
Total publishing net
revenues $2,505,166 86% $1,119,038 74% 124%
----------------------- ---------- ----------------- ------ ----------
Distribution:
Console $ 268,794 9% $ 238,662 16% 13%
Hand-held 94,918 4% 122,293 8% -22%
PC 29,258 1% 33,019 2% -11%
---------------------- ---------- ----------------- ------ ----------
Total distribution net
revenues $ 392,970 14% $ 393,974 26% 0%
----------------------- ---------- ----------------- ------ ----------
Total net revenues $2,898,136 100% $1,513,012 100% 92%
---------------------- ---------- ----------------- ------ ----------
ACTIVISION, INC. AND SUBSIDIARIES
FINANCIAL INFORMATION
For the Quarter and Year Ended March 31, 2008
---------- ---------- --------- ---------
Quarter Quarter Year Year
Ended Ended Ended Ended
March 31, March 31, March 31, March 31,
2008 2007 2008 2007
--------------------------- ---------- ---------- --------- ---------
Publishing Net Revenues
PC 8% 5% 6% 7%
--------------------------- ---------- ---------- --------- ---------
Console 87% 80% 85% 80%
--------------------------- ---------- ---------- --------- ---------
Sony PlayStation 3 18% 12% 13% 5%
Sony PlayStation 2 21% 49% 29% 45%
Microsoft Xbox 360 27% 12% 31% 18%
Nintendo Wii 21% 5% 12% 5%
Other 0% 2% 0% 7%
Hand-held 5% 15% 9% 13%
--------------------------- ---------- ---------- --------- ---------
Sony PlayStation Portable 1% 8% 3% 4%
Nintendo Dual Screen 4% 5% 5% 5%
Nintendo Game Boy Advance 0% 2% 1% 4%
--------------------------- ---------- ---------- --------- ---------
Total publishing net
revenues 100% 100% 100% 100%
---------------------------- ---------- ---------- --------- ---------
SOURCE: Activision, Inc.
Activision, Inc.
Kristin Southey, Vice President, Investor Relations
310-255-2635
ksouthey@activision.com
or
Maryanne Lataif, Vice President, Corporate Communications
310-255-2704
mlataif@activision.com
Copyright Business Wire 2008
well, you can only test support so many times... and, is touching .0012/.0013 now considered Popping Right back up for RVGD?
July 18th 2006 ...yes... 2006
“Revenge and Lingenfelter will produce 1,000 modified cars by October or November of next year, Collorafi said. The company expects to be in operation in mid-August. He said the company is also looking at modifying other vehicles but did not provide specifics.”
“All 1,000 modified GTOs will include the Revenge design enhancement package – everything from a wider body to fog lamps with flowing fender extensions to a lower profile. And 500 cars will also include the Lingenfelter performance package. That will add a magnacharger/supercharger delivering 530 horsepower – up from 400 – as well as a manual transmission short shifter, a high performance brake system and other extras.”
“Revenge expects to employ 40 by December with an annual payroll that will exceed $1 million. About $1.7 million will be invested in the project with annual sales anticipated to be in the neighborhood of $10 million, the company said in a written statement.”
http://www.secinfo.com/d11w8j.v1b.htm
& how many did they make by October or November of that year???? I'll give you one guess...
thanks ClayTrader...
XRM
XRM chart plz?..
1:15am Friday evening... all 3 numbers still busy...
Contacts
Wherify Wireless
John Cunningham, 650-551-5271
(Director of Communications)
jcunningham@wherify.com
Joe Noel, 650-551-5231 (Investor Relations)
jnoel@wherify.com
Phone: (650) 551-5200
email sent last week expressing interest in the company... zilch.. no response...
stick a fork in 'er.. she's done..
i want my money back.... :(..... LOL
..... bastards.... another ASII, watch...
NMCH chart plz.
NMCH
NewMarket China, Inc. Releases CEO Letter to Shareholders Highlighting Share Price Potential in Relation to Fundamental Financial Performance
THURSDAY, MAY 01, 2008 9:25 AM
- Market Wire
NMCH
0.0529 +0.0029
DALLAS, TX, May 01, 2008 (MARKET WIRE via COMTEX) -- NewMarket China, Inc. (NMCH) today released a letter to shareholders from CEO John T. Verges. The letter highlights the Company's meteoric growth to $40 million in 2007 revenue and financial performance over the past five quarters since the Company's reorganization. The letter goes on to discuss how the current share price performance has not yet reflected the Company's fundamental financial performance.
Operational Performance Not Yet Reflected in Otherwise Low Share Price
The letter provides thoughtful internal analysis on share price performance potential. The purpose of the letter is to provide ongoing insight to shareholders and investors in regard to management's ongoing commitment to the Company's vision while current market performance is not necessarily conveying fundamental financial progress. The CEO's intention is to open a dialogue with shareholders and investors on the relationship between operational performance and share price performance.
To receive a copy of the letter in its entirety contact the Company at ir@newmarketchina.com or 214-722-3065.
Company's Operational Overview for Services Provided in Mainland China
NewMarket China provides a wide range of technology services to include hardware and software sales, support and customization within China, with current operations mainly in Shanghai, Ningbo and Hangzhou. In 2007, the Company expanded its software development services outside of China and signed initial contracts in North America.
Rapid Growth From $29.5 Million to $40 Million in Revenue and 2008 Outlook
NewMarket China has experienced rapid growth over the past two years, growing from $29.5 million in revenue in 2006 to $40 million in revenue in 2007, with a net income increase of 83%. The Company has set its 2008 revenue goal at $50 million. NewMarket China plans to achieve this revenue goal through improving fundamental financials, continued organic growth and acquisitions, which the Company is actively seeking in China and North America.
Strategic Plan Update Webcast Scheduled for May 14, 2008 at 4:30 PM EDT
The Company has scheduled a Webcast for 4:30 pm EDT on May 14, 2008 to present a strategic plan update. A link to the Webcast will be available at http://www.investorcalendar.com/IC/CEPage.asp?ID=127668. Also available at this link is an archive to the recent Webcast reviewing 2007 operational and financial results conducted by the Company CEO and CFO.
Corporate Communications and Fact Sheet
If you would like to receive email updates on the company or a corporate fact sheet highlighting the Company's operations, business plan and technology partners, please send an email to ir@newmarketchina.com.
About NewMarket China, Inc. (www.newmarketchina.com)
NewMarket China, Inc. is a technology leader in the rapidly developing Chinese market specializing today in software engineering, high quality software development and digital multimedia outsourcing services delivered to customers globally. At the same time, the firm is a systems integrator and value added reseller of major global hardware brands in the Chinese domestic market.
Headquartered in Dallas with operations in Shanghai and Beijing, NewMarket China bridges the gap between Western and Eastern business cultures to assist Western clients in realizing the advantages of the high quality, low cost technology products and services available from China. NewMarket China also assists Western clients in localizing products and services to realize the tremendous growth potential available by expanding into the Chinese Market.
"SAFE HARBOR STATEMENT" UNDER THE PRIVATE SECURITIES LITIGATION REFORM ACT OF 1995
This press release contains forward-looking statements that involve risks and uncertainties. The statements in this release are forward-looking statements that are made pursuant to safe harbor provision of the Private Securities Litigation Reform Act of 1995. Actual results, events and performance could vary materially from those contemplated by these forward-looking statements. These statements involve known and unknown risks and uncertainties, which may cause NewMarket's actual results in future periods to differ materially from results expressed or implied by forward-looking statements. These risks and uncertainties include, among other things, product demand and market competition. You should independently investigate and fully understand all risks before making investment decisions.
Contact:
NewMarket China, Inc.
Investor Relations
214-722-3065
ir@newmarketchina.com
www.newmarketchina.com
NMCH
NewMarket China, Inc. Releases CEO Letter to Shareholders Highlighting Share Price Potential in Relation to Fundamental Financial Performance
THURSDAY, MAY 01, 2008 9:25 AM
- Market Wire
NMCH
0.0529 +0.0029
DALLAS, TX, May 01, 2008 (MARKET WIRE via COMTEX) -- NewMarket China, Inc. (NMCH) today released a letter to shareholders from CEO John T. Verges. The letter highlights the Company's meteoric growth to $40 million in 2007 revenue and financial performance over the past five quarters since the Company's reorganization. The letter goes on to discuss how the current share price performance has not yet reflected the Company's fundamental financial performance.
Operational Performance Not Yet Reflected in Otherwise Low Share Price
The letter provides thoughtful internal analysis on share price performance potential. The purpose of the letter is to provide ongoing insight to shareholders and investors in regard to management's ongoing commitment to the Company's vision while current market performance is not necessarily conveying fundamental financial progress. The CEO's intention is to open a dialogue with shareholders and investors on the relationship between operational performance and share price performance.
To receive a copy of the letter in its entirety contact the Company at ir@newmarketchina.com or 214-722-3065.
Company's Operational Overview for Services Provided in Mainland China
NewMarket China provides a wide range of technology services to include hardware and software sales, support and customization within China, with current operations mainly in Shanghai, Ningbo and Hangzhou. In 2007, the Company expanded its software development services outside of China and signed initial contracts in North America.
Rapid Growth From $29.5 Million to $40 Million in Revenue and 2008 Outlook
NewMarket China has experienced rapid growth over the past two years, growing from $29.5 million in revenue in 2006 to $40 million in revenue in 2007, with a net income increase of 83%. The Company has set its 2008 revenue goal at $50 million. NewMarket China plans to achieve this revenue goal through improving fundamental financials, continued organic growth and acquisitions, which the Company is actively seeking in China and North America.
Strategic Plan Update Webcast Scheduled for May 14, 2008 at 4:30 PM EDT
The Company has scheduled a Webcast for 4:30 pm EDT on May 14, 2008 to present a strategic plan update. A link to the Webcast will be available at http://www.investorcalendar.com/IC/CEPage.asp?ID=127668. Also available at this link is an archive to the recent Webcast reviewing 2007 operational and financial results conducted by the Company CEO and CFO.
Corporate Communications and Fact Sheet
If you would like to receive email updates on the company or a corporate fact sheet highlighting the Company's operations, business plan and technology partners, please send an email to ir@newmarketchina.com.
About NewMarket China, Inc. (www.newmarketchina.com)
NewMarket China, Inc. is a technology leader in the rapidly developing Chinese market specializing today in software engineering, high quality software development and digital multimedia outsourcing services delivered to customers globally. At the same time, the firm is a systems integrator and value added reseller of major global hardware brands in the Chinese domestic market.
Headquartered in Dallas with operations in Shanghai and Beijing, NewMarket China bridges the gap between Western and Eastern business cultures to assist Western clients in realizing the advantages of the high quality, low cost technology products and services available from China. NewMarket China also assists Western clients in localizing products and services to realize the tremendous growth potential available by expanding into the Chinese Market.
"SAFE HARBOR STATEMENT" UNDER THE PRIVATE SECURITIES LITIGATION REFORM ACT OF 1995
This press release contains forward-looking statements that involve risks and uncertainties. The statements in this release are forward-looking statements that are made pursuant to safe harbor provision of the Private Securities Litigation Reform Act of 1995. Actual results, events and performance could vary materially from those contemplated by these forward-looking statements. These statements involve known and unknown risks and uncertainties, which may cause NewMarket's actual results in future periods to differ materially from results expressed or implied by forward-looking statements. These risks and uncertainties include, among other things, product demand and market competition. You should independently investigate and fully understand all risks before making investment decisions.
Contact:
NewMarket China, Inc.
Investor Relations
214-722-3065
ir@newmarketchina.com
www.newmarketchina.com
On the bid at .02 but not being repped... Anyone wants out... I'll take a few... I have best bid currently showing .017..
nah I didn't sell... just vented a bit of the steam....
has anyone spoken with the company.. all 3 of those numbers I posted before are still busy...
well I sure know how to the pick them....
YET ANOTHER SCAM
.0139 - .0022 in three days...
we have another ASII..
can't believe the stupidity of some of the sell programs...
you morons that are listening who put this together.. get with the program.. you can sell way more stock not being such frikkin tools..
lay off the bid son...
someone let me know when any of these numbers are NOT busy... have been trying now all day now.... always busy, like they've taken them off the hook or something.....
Wherify Wireless
John Cunningham, 650-551-5271
(Director of Communications)
jcunningham@wherify.com
Joe Noel, 650-551-5231 (Investor Relations)
jnoel@wherify.com
Wherify Wireless, Inc.
2000 Bridge Parkway
Suite 201
Redwood Shores, CA 94065
Phone: (650) 551-5200
anyone been in contact with the company?
WFYW (.011) Wherify Wireless Inc
WFYW (.011) Wherify Wireless Inc
WFYW (.011) Wherify Wireless Inc
definately looking good... grabbed a few today as well.. some interest picking up on this one...
4 months later.. NITE still dumping.. A/S increased from 100M to 1B.. (in the sneakiest way possible I might add as it was clearly held off for long after the O/S was 100M and it actually started getting out of hand)... No News.. Some similar faces...
next week right?...
the low floater 2M share o/s was a better pump from three months ago... heck of alot of shares sold by this stellar company since then.... 2 contracts or is it 3 in the pipeline? ah well we will find out soon.. or not... maybe another three months..
i remember....
.03 to .001 in a week, I believe it was... 6 days maybe.. toughest exit ever.. had to load the .002's to dump the .009's at even and still don't know how I pulled it off..
rah rah rah surfkast, all the way to no bid....
WTF right? plz.. tell us whats up...
your promoting a POS and you know it... i saw you here pumping this thing when it was at .03 cents a couple months ago..
Other than the fact that I'm sure I'm not alone in thinking the 504 has been maxed a few times now, it appears these shares are being given away....
"...went ahead and finished off the majority left on the 504 which was about $70K..."
"...That should put the 504 with less than about $20K left to use..."
"...it looks like 70M shares got dumped into the market the last few days..."
so for roughly $50,000 the buyer got roughly 70M shares?
i believe that is roughly .0007... BOOYAH
no wonder.. offing 10M shares at the bid of .0012 on Friday would of almost been delightful... wait, someone did that...
what a cash cow....
can i get a weeeeeeeeeeeeeeeeeeeeeeeeeeeeeeeeeee?
Does anyone know why Revenge didn't just stay in the 55,000 sq ft building it was originally in when they had their open day in August 2007? Looks like there is more than enough room there.... Don't see why they would downgrade to 10,000 sq ft right before a large contract, only to have to raise money to build a bigger building...
"Revenge Designs held an Open Day at their plant in Decatur, Indiana on the 19th August 2007."

from that to this?
“Revenge and Lingenfelter will produce 1,000 modified cars by October or November of next year, Collorafi said. The company expects to be in operation in mid-August. He said the company is also looking at modifying other vehicles but did not provide specifics.”
“All 1,000 modified GTOs will include the Revenge design enhancement package – everything from a wider body to fog lamps with flowing fender extensions to a lower profile. And 500 cars will also include the Lingenfelter performance package. That will add a magnacharger/supercharger delivering 530 horsepower – up from 400 – as well as a manual transmission short shifter, a high performance brake system and other extras.”
“Revenge expects to employ 40 by December with an annual payroll that will exceed $1 million. About $1.7 million will be invested in the project with annual sales anticipated to be in the neighborhood of $10 million, the company said in a written statement.”
http://www.secinfo.com/d11w8j.v1b.htm
well those quotes were from 2006.. we're now in 2008..
+30% increase over 10 day average volume + a positive PR and forward looking events..... = -10%
Go RVGD..
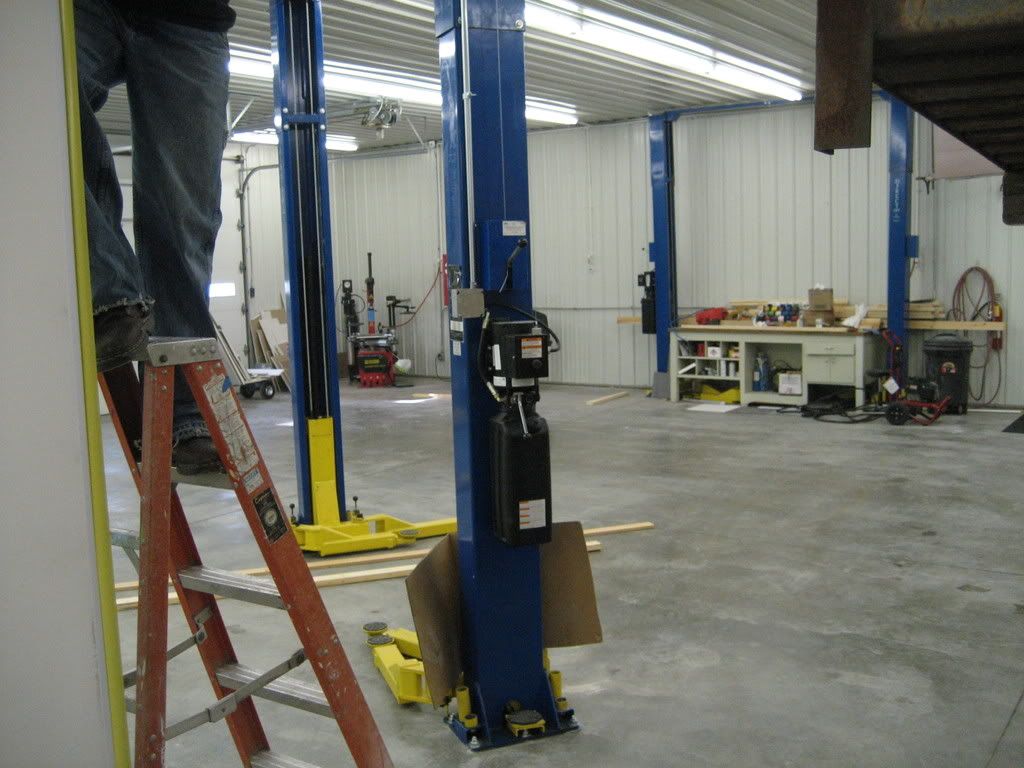
what exactly is it that you need?????
http://www.numarketsolutions.com/4.JPG
http://www.numarketsolutions.com/7.JPG
production assembly... lol...
where are the tools? the workers? they have to pump out, at the very least, one a day, remember?... lol... i see the same cars in there, in the same place as MONTHS ago.... same ridgelines in the same place, nothing done except rims on one (my buddy would hook that up for me in fifteen)... same GTO's................... other than completely crowding out the floor to create the illusion of being busy to the point that nothing could get done even if someone was trying to work on one of those cars, I see basically no changes????... got a completed car yet? if they had to pump out a car a week, let alone a car a day, I'd be worried.... i'm sure this looks like a production assembly plant to most but to me it just looks like the same deal as before with 3 GTM kits which havn't been touched... but what do I know....
i'm a little slow, so somebody please explain how were going to pump 1-2 cars a day out of this shed? you'd have to rearrange the whole warehouse to get a completed car out... lol
go RVGD!!...
"weather permitting" again... lol
10 day forecast from weather.com....
http://www.weather.com/weather/tenday/USIN0152?from=36hr_topnav_undeclared
week of rain in Decatur...
somebody put out another mailer on this thing... seems to be the only way to get the PPS up...
Kudos to those who sent it, dumped like crazy on the volume it brought from .07 to .125 and have continued dumping to where we are now at five cents... we've had about two months of downticking now... think you can give it a rest for a day or two? or at least send another one... TIA
ETRD buyer, did you get the mailer?..... lol
what a dog.. apparantly the company has had no information for its investors in..... I'm sorry, how long has it been now?
****************(sound of crickets)***********************
lol......wow Dez....
ITRO (.0085)...
ITRO... 1 left at .007...
you hang on to that thread, big guy... believe whatever you want..
Collorafi estimated 1,000 cars to be completed the year before aswell...
July 18th 2006 SGLS 8K:
“Revenge and Lingenfelter will produce 1,000 modified cars by October or November of next year, Collorafi said. The company expects to be in operation in mid-August. He said the company is also looking at modifying other vehicles but did not provide specifics.”
“All 1,000 modified GTOs will include the Revenge design enhancement package – everything from a wider body to fog lamps with flowing fender extensions to a lower profile. And 500 cars will also include the Lingenfelter performance package. That will add a magnacharger/supercharger delivering 530 horsepower – up from 400 – as well as a manual transmission short shifter, a high performance brake system and other extras.”
“Revenge expects to employ 40 by December with an annual payroll that will exceed $1 million. About $1.7 million will be invested in the project with annual sales anticipated to be in the neighborhood of $10 million, the company said in a written statement.”
http://www.secinfo.com/d11w8j.v1b.htm
really???? I was waiting for updates on the CONTRACT... show me the updates please....
"Revenge Designs, Inc. Processing Preliminary 4-Year, $80M Production Contract"
I'm not talking about "anticipates"
"The company in its first phase agreements anticipates constructing up to 1,000 high performance vehicles in the first four years"
or production
"a specialty car designer and production assembler, provides a corporate update to its shareholders on its previously announced $80M production"
I'm talking about a CONTRACT
Because I Havn't heard a thing about a contract since.. maybe we have both a 80M contract and 80M production? now wouldn't that be sweet?
and we can pump it all out of our 10,000 sq ft facility, recently downgraded from 55,000..
"I’m out of the office until Monday taking some time off. I’m getting allot of emails showing up on my PDA about the A/S increase. I am not at home and out spending time with my family. Can you post this letter on Ihub so that people will have the information that I have. First off, everyone needs to understand that the pro forma numbers we used were based on 957M shares which we felt was a worst case scenario. I believe we will be able to reduce that number some but I wanted to give investors the worst case possible. I’m going to give the entire share structure as I know it to end any speculation. The transfer agent is not gagged but simply has a policy against giving out information on Pinksheets. I have full access to the transfer agent and will be glad to give shareholders updates bi-monthly. Here is the current share structure."
"That brings the total O/S to about 957M with a 318M float. The A/S was increased to 1.5B to insure there was adequate room for conversion of any shares and to allow for some additional treasury shares for future growth. Please use the 957M figure when doing your fundamental analysis. Tell everyone that nothing has changed and we are still looking at .001/.004 earnings once production starts. Production however may not start for several months so the Company may need to do some bridge loans. Equity may be used to secure these loans but we are not dealing with Carnes anymore so any financing we do will be the best deal we can get. I’m sure those who would like to see the Company fail will be out in full force over the weekend spinning the A/S increase. Do not expect a press release because this is information I have readily given anyone who has bothered to contact me. For those who want answers they need to contact me and not read the latest gossip on the message boards. I am the only one authorized by the Company to give information to investors. If folks have questions they need to ask me.. not some anonymous poster on a message board. Again, I will be out of the office until Monday.. I need days off too."
"The reality is, the company sold its last tranche over a week ago. I just got off the phone with the transfer agent at 1:27 pm CST and the share structure is 950,564,603 shares. This tells me Signature Leisure has received their shares. I have never mislead anyone and stated many months ago that the O/S would grow to approx 977M. Well we are actually 27M less that my previous estimate. If you have issues with the share price I suggest you contact Signature Leisure and ask them to quit aggressively selling the stock. Neither I nor the company can control the market."
"Some shares have been converted from the previously mentioned promissory notes and may be entering the market. I will be updating everyone on the share structure in the next press release. For now, continue to use the 977M O/S figure as this is the total number of shares that could result from conversion. The stock will remain volatile until the last of the conversions are done. Once these conversions are done the stock should be able to breath and trade correctly."
"My original projected estimation was between 957-977M shares. We later revised that to 1.1B-1.2B because the drop in share price had caused the possibility of additional shares needed to complete the total financing"
that said 2006 there chief...
not a problem... dunno why your looking forward to it, though..
http://www.secinfo.com/d11w8j.v1b.htm
This was the response when I asked what happened...
"The Lingenfelter deal was scrapped in favor of the Haroop deal. The Haroop deal has more long term benefit to the company."
WOW! Harrop could provide longer term benefit then 1000 modified GTO's by November of '07!!... Well..... then great!!...
...
...
...
But, wait....... How much have we made from the Harrop deal?
Maybe we should scrap the GTM deal for something else that's of greater benefit for us in the long term???

