 News
News  Market Data
  Discover

Support: 888-992-3836
Copyright © 2023 InvestorsHub Inc.


On The Quest For Knowledge
ospreyeye
![]()
On The Quest For Knowledge
Register for free to join our community of investors and share your ideas. You will also get access to streaming quotes, interactive charts, trades, portfolio, live options flow and more tools.
Register for free to join our community of investors and share your ideas. You will also get access to streaming quotes, interactive charts, trades, portfolio, live options flow and more tools.
On The Quest For Knowledge
$CYTR $MBRX $NEOT $MARA $MATN Charts 7/31/17 -
Ospreyeye Chart Coach Technical Analysis Video -

$CYTR $ZN $XXII Charts 7/30/17 -
Ospreyeye Chart Coach Technical Analysis Video -
$CYTR $ZN $XXII Charts 7/30/17 -
Ospreyeye Chart Coach Technical Analysis Video -
$GBTC $BTCS $BTSC $BITCF $GAHC $MGTI Charts 7/23/17 -
MyChartCoach TA Video -

$GBTC $BTCS $BTSC $BITCF $GAHC $MGTI Charts 7/23/17 -
MyChartCoach TA Video -
that's great to read - yes that would be best IMO -
Thanks for viewing - great to touch base with you again - hope u have been well - going to start posting on this board again - new videos coming out later today - nice to see the marijuana sector has heated back up -
$TOPS $DRYS $GLBS $RLOG $DCIX $SHIP $AMPE $FRZT Charts 7/22/17 -
MyChartCoach TA Video
$TOPS $DRYS $GLBS $RLOG $DCIX $SHIP $AMPE $FRZT Charts 7/22/17 -
MyChartCoachCom TA Video
thanks! - hope you are having a great weekend :)
Thanks buddy - have a great weekend -
$PURA $MCOA $CNBX $CBIS $SGBY $MCIG $SRNA $MYDX $CBDS $MSRT $KAYS $MYHI Charts 7/20/17 -
MyChartCoachCom TA Video -

$WE ARE ON THE $FRZT BOUNCE PLAY -------

THE CHARTS ARE SETTING UP ------
LOOK FOR A BULLISH VOLUME SPIKE & BREAK ABOVE RESISTANCE FOR THE BULL SIGNAL -------
WE ARE LOOKING FOR A CLOSE ABOVE EMA'S 4 & 8 ON THE DAILY CHART ------------
EMA 8 @ 0.0021 IS THE KEY LEVEL TO CLOSE ABOVE TODAY ---------
THE 15 MINUTE CHART HAS TURNED BULLISH TODAY ----------

AS LONG AS MIDDLE BOLLINGER BAND SUPPORT HOLDS ON THE 15 MINUTE CHART $FRZT WILL BE IN PLAY --------
8K OUT YESTERDAY = CATALYST TO BREAK RESISTANCE --------


$WE ARE ON THE $FRZT BOUNCE PLAY -------
THE CHARTS ARE SETTING UP ------
LOOK FOR A BULLISH VOLUME SPIKE & BREAK ABOVE RESISTANCE FOR THE BULL SIGNAL -------
WE ARE LOOKING FOR A CLOSE ABOVE EMA'S 4 & 8 ON THE DAILY CHART ------------
EMA 8 @ 0.0021 IS THE KEY LEVEL TO CLOSE ABOVE TODAY ---------
THE 15 MINUTE CHART HAS TURNED BULLISH TODAY ----------
AS LONG AS MIDDLE BOLLINGER BAND SUPPORT HOLDS ON THE 15 MINUTE CHART $FRZT WILL BE IN PLAY --------
8K OUT YESTERDAY = CATALYST TO BREAK RESISTANCE --------
$PURA $MCOA $CNBX $CBIS $SGBY $MCIG $SRNA $MYDX $CBDS $MSRT $KAYS $MYHI Charts 7/20/17 -
MyChartCoach TA Video -
$PURA $MCOA $CNBX $CBIS $SGBY $MCIG $SRNA $MYDX $CBDS $MSRT $KAYS $MYHI Charts 7/20/17 -
MyChartCoach TA Video -
$ASNA HAS BEEN TURNING THE 50 SMA INTO SUPPORT WHILE FILLING THE GAP –

http://mychartcoach.com/Forums/topic/asna-has-been-turning-the-50-sma-into-support-while-filling-the-gap/
$VNRSQ $ORIG $RLOG $CGI $OPGN $BBEPQ $TRTC $CNBX $IVITF $PAOG $HCEI $FLPC Charts 7/16/17 -
MyChartCoachCom TA Video -

$TRTC Chart - what an Epic 7 day run - congrats to everyone following our charts & TA - the 300 SMA @ 0.309 is the key level to close above & turn into support -

$MCOA Chart - the Marijuana Sector has really been heating up - $MCOA is breaking the 50 SMA @ 0.024 intraday - a close above would be very bullish - the 300 SMA @ 0.034 will be the Key level to break if the 50 day simple moving average holds -

$CNBX Chart - breaking the 200 SMA @ 1.33 intraday - key level to close above & turn into support - Congrats to everyone that caught the YouTube video over the weekend! -

$VGID Chart - this MJ Sector stock is heating up following big volume spikes last week - a close above 0.0022 should signal more upside potential -

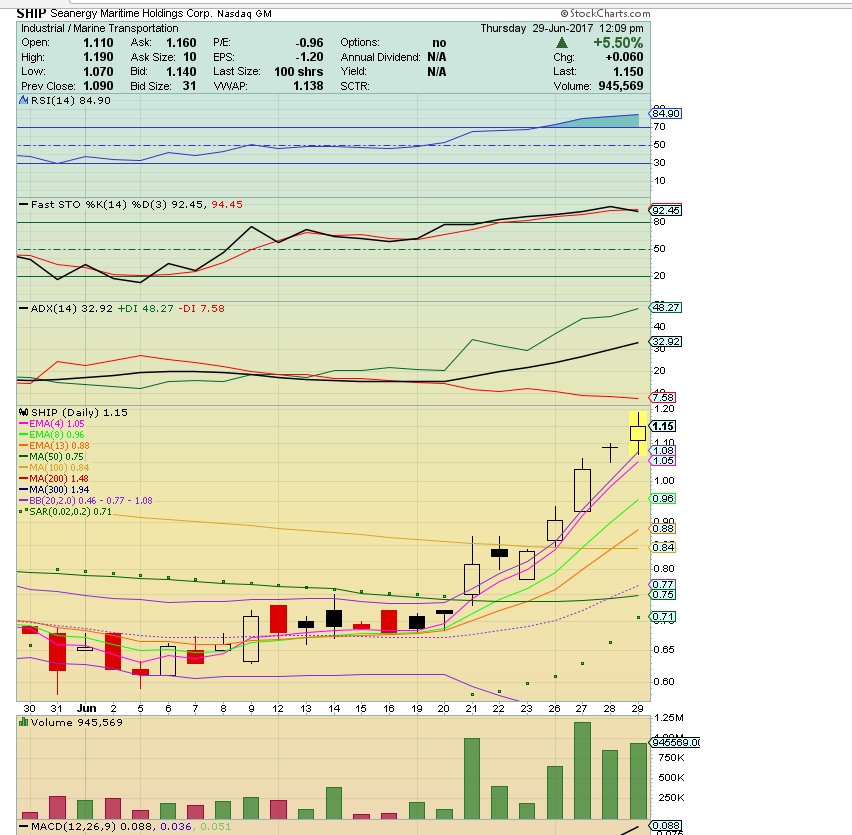
$SHIP Chart - very nice follow through today - the good news yesterday has trumped the doji that formed on the daily chart - strong up trend - candles riding EMA 4 support higher - if support holds the 200 SMA @ 1.48 & bottom of the gap will be the next targets -
$FRZT Chart - Nice Follow Through Today - Congrats - EMA 4 @ 0.0029 is the key level to close above & EMA 8 @ 0.0033 is the key level to break - a close above EMA 4 today on the daily chart would be a bullish change in trend - it has been big resistance - trying to confirm the Bullish Doji Star reversal pattern -

$SHIP - GOOD NEWS - Seanergy Maritime Holdings. Announces Termination
of its "At-The-Market" Equity Offering Program


$FRZT FORMED BULLISH DOJI STAR REVERSAL PATTERN TODAY -
https://www.americanbulls.com/SignalPage.aspx?lang=en&Ticker=FRZT
http://www.candlesticker.com/Pattern.aspx?lang=en&Pattern=2106
the Gap down open today was a clue that a bullish reversal pattern could form - if you watched level 2 end of day you would have seen the Market Makers working it making sure $FRZT closed at 0.0025 today forming a doji & this very strong reversal pattern -
take a look at the volume bars on the daily chart - declining volume pattern w/ very low volume the last 2 days - $FRZT is now set up for a bullish volume spike and break above resistance - all it needs to do is hold support & follow through -
Take Note: Doji's formed after a Gap Down Open during a downtrend signal potential bounce


look for $FRZT to bounce off the 50 day simple moving average @ 0.0017 if that level is tested - $FRZT formed Bullish Engulfing reversal pattern on the 21st - that pattern has not been confirmed - if the 50 SMA fails to hold it will be a red flag signaling more downside risk - since $FRZT has failed to bounce past EMA's 4 & 8 resistance on this pullback it is still due for a technical bounce - there has been a nice Fibonacci retrace off the highs - now we are stalking our prey waiting for the Bounce Play - Patience will Pay Off - it always does - breaking middle Bollinger band support on the daily chart is a big red flag - it will be the key level to break when tested - if it continues to be resistance it will confirm $FRZT has started a new down trend - it needed to bounce off the middle Bollinger Band & hold that level to keep the previous up trend intact - the close below the middle BB on the 20th signaled possible start of new downtrend - the 50 SMA is just below providing support - for $FRZT to head higher it needs to form candles above the 50 SMA & middle BB on the daily chart - if the 50 SMA support level breaks and candles start forming below it will be a clear signal the bears are in charge w/ more downside risk - $FRZT is in the bounce "zone" - it's either going hold support here above the 50 SMA or drop down to the 100 SMA & test 0.0010 & the triple 0's - this is MAKE IT OR BREAK IT ZONE FOR $FRZT -
$FRZT EITHER HOLDS THE 50 DAY SIMPLE MOVING AVERAGE OR HAS A HUGE DROP BACK DOWN TO TRIPLE 0'S - MAKE OR BREAK FOR $FRZT -
$FRZT Chart - Formed a Doji today following the Gap Down Open - set up for a bounce - the low volume the last 2 days signals volume spike should be coming - keep an EYE out for a bounce - needs to get back above the middle Bollinger Band to head higher -

$CBRIQ formed a doji on Fri - signals indecision - looking for candles to work back into the Bands - needs to break bottom of gap resistance ????
$TVIX $UVXY $VXX Technical Analysis Video - Ospreyeye Chart Coach -
$TVIX $UVXY $VXX Technical Analysis Video - Ospreyeye Chart Coach $$$ ??????????
$XTNT $NK $RELV $GSAT $PME $VNRSQ $SGMO $OCUL $CGI $SGYP $WKHS - Top 11 % Gainers On Watch List -

https://stocktwits.com/ospreyeye/stocks
$
$MNKD $WAC Charts 5/10/17 -
MyChartCoachCom Technical Analysis Video -
$MNKD $WAC Charts 5/10/17 -
MyChartCoachCom Technical Analysis Video -
$PULM Charts 2/1/17 - Technical Analysis Video -
$PULM Charts 2/1/17 - Technical Analysis Video -
$CARA Charts 2/1/17 - Technical Analysis Video -
$ECR $$ATW $REXX $BCEI $SGY Charts 1/31/17 -
Technical Analysis Video -
$ECR $$ATW $REXX $BCEI $SGY Charts 1/31/17 -
Technical Analysis Video -
$HMNY $EVOK $DCIX $SALT $NM $DSX $GLBS $SHIP $GSL $SINO $ESEA $TOPS Charts 1/30/17 -
- Technical Analysis Video -

