 News
News  Market Data
  Discover
Support: 888-992-3836
Copyright © 2023 InvestorsHub Inc.


dindindon
![]()
Register for free to join our community of investors and share your ideas. You will also get access to streaming quotes, interactive charts, trades, portfolio, live options flow and more tools.
Register for free to join our community of investors and share your ideas. You will also get access to streaming quotes, interactive charts, trades, portfolio, live options flow and more tools.
06/06/14 CZZ
on 04/02, CZZ traded with 2X volume, marked an intraday high 11.99
This past weeks it tested the 11.99, now bounces off nicely,
Do You own DD
Cosan's Reach And Potential Outweigh The Risks
May. 27, 2014 9:37 AM ET
http://seekingalpha.com/article/2238843-cosans-reach-and-potential-outweigh-the-risks
- Analysts are still underestimating the company.
- As well as Cosan is performing today (05/27) , the company still has not reached its full potential.
- With shares currently trading at 7-times EPS estimates of $1.64, I'm projecting fair value to reach $15 to $16 in the next 12 to 18 months.

Trade war in the Pacific
Trans Pacific Partnership (TPP) is an important Geo-economics chess in the Grand Chessboard, a key strategic maneuver which, when finished, will govern 40 percent of U.S.' imports and exports
Everything you need to know about the Trans Pacific Partnership
By Lydia DePillis
December 11, 2013 at 10:48 am
link
Why almost everyone hates the trade deal Obama’s negotiating in Japan
By Jaime Fuller April 23 at 9:45 am
link
Obama and Japan's Abe fail to reach trade accord
By Don Lee April 24, 2014
link
Trade war in the Pacific:
Trade partnership competition: TPP vs RCEP
Apr 2013 By Mark Thomson
link
Two major trade agreements, the Trans-Pacific Partnership (TPP) and the ASEAN Regional Comprehensive Economic Partnership (RCEP), stand to define the parameters of economic integration in Asia, arguably the world’s most dynamic region. While the TPP and RCEP are frequently described as rival trading blocs led by the United States and China respectively, we should look beyond this easy characterization to explore the complex dynamics among these mega trade agreements.
link
06/05/14 G8 - 1
Sun(lights) out of beach, G7? What (Why) Am I Missing There


Some subtle cracks has begun, discrepeancy observed between Europe nations & US over Russia/China
Tue Jun 3, 2014
(Reuters) - France stepped up its protests to the United States on Tuesday over a possible $10 billion-plus sanctions busting fine for its biggest bank BNP Paribas (BNPP.PA), saying such a move could hurt transatlantic free-trade talks.
http://online.wsj.com/articles/frances-fabius-says-possible-10-billion-bnp-fine-unreasonable-1401783540
http://www.reuters.com/article/2014/06/03/us-bnpparibas-france-idUSKBN0EE0GB20140603
photo sources:
http://www.miercn.com/
http://www.guancha.cn/
06/05/14 SPX knocks out 1931.41
SPX knocks out 1931.41, nearby resistance 1936.11 (see chart dated 04/26), 1944 , ...pick a number in the table.
oh well, "Don't Fight the Fed"
In essence:
it seems only as matter of time, SPX will enter the zone 1970-2050.
Saturday, 02/08/14 12:24:01 PM
Long term outlook:
http://investorshub.advfn.com/boards/read_msg.aspx?message_id=96999787
In the table, You also can find some “popular” numbers such as 1880, 1860, 1944, 2213 .. etc, These are just the wave Fibonacci extensions

Here's What 14 Top Wall Street Strategists Are Predicting For The Stock Market In 2014
Steven Perlberg Jan. 2, 2014, 9:05 AM
For 2014, the average call is for the S&P 500 to hit 1,955, with the median prediction at 1,950.
Read more: http://www.businessinsider.com/strategists-2014-sp-500-targets-2014-1#ixzz2sh5hU0AF
04/26

05/29

05/31/14 02:26:50 PM
When takes a view outside the E-wave box, imho, 1931.41 is the pivot to gauge whether SPX will enter the zone 1970-2050. (Be cautious, this is a subjective assessment)
1931.41 (1.786, 1474.51, 1266.74, 1560.33)
1973.26 (1,618, 1576.09, 768.83, length 807.46)
1975.87 (2.000, 1474.51, 1266.74, 1560.33)
2047.41 (1.382, 1370.58, 666.79, 1074.77)
06/01
length 87.81 (1902.17, 1814.36), base 1862.36

ECB PRESS RELEASE
ECB PRESS RELEASE
https://www.ecb.europa.eu/press/pr/date/2014/html/pr140605.en.html
5 June 2014 - Monetary policy decisions
At today’s meeting the Governing Council of the ECB took the following monetary policy decisions:
The interest rate on the main refinancing operations of the Eurosystem will be decreased by 10 basis points to 0.15%, starting from the operation to be settled on 11 June 2014.
The interest rate on the marginal lending facility will be decreased by 35 basis points to 0.40%, with effect from 11 June 2014.
The interest rate on the deposit facility will be decreased by 10 basis points to -0.10%, with effect from 11 June 2014. A separate press release to be published at 3.30 p.m. CET today will provide details on the implementation of the negative deposit facility rate.
The President of the ECB will comment on the considerations underlying these decisions at a press conference starting at 2.30 p.m. CET today. Further monetary policy measures to enhance the functioning of the monetary policy transmission mechanism will be communicated in a press release to be published at 3.30 p.m. CET today.
Webcast of the press conference 5 June 2014
https://www.ecb.europa.eu/press/tvservices/webcast/html/webcast_140605.en.html
RE conelda: TNH anyone follow this?
TNH is not in my core watch list, for Agri/Feterlizer I have POT SQM ADM DE in the watch list.
i will avoid TNH due to:
 (1) it is a thinly traded MLP, daily volume is lesser than 30K.
      “They” can pull the rug easily.
       this no option for hedge
 (2) price chart looks bad
 (3) buy when price breaking out, not sign yet.
 (4) poor market conditions (according to the following quotes)
 (5) The “opportunity cost” is high, shop around for a better one.
Why This High-Yielding Agriculture MLP Is Worth Your Time
By Bob Ciura | More Articles
June 2, 2014
http://www.fool.com/investing/general/2014/06/02/why-this-high-yielding-agriculture-mlp-is-worth-yo.aspx
in the early stages of a turnaround
Terra Nitrogen: Paying Less For Dividend Income
May. 21, 2014 5:36 AM ET
http://seekingalpha.com/article/2229753-terra-nitrogen-paying-less-for-dividend-income
Our stance strategically on Terra Nitrogen has not changed. There have been headwinds of late, and we expect continued pressure due to both lower sales pricing, and higher input costs, but maintain that our thesis over the longer time frame is maintained.
Terra Nitrogen: Overreaction To Decrease In Dividends Or Not?
Mar. 25, 2014 10:16 AM ET
http://seekingalpha.com/article/2107593-terra-nitrogen-overreaction-to-decrease-in-dividends-or-not
Terra Nitrogen (TNH) has experienced a sharp drop in its share prices. It is already established that we will see an oversupply situation within the next few years, but the reaction of the market to this negative news is perhaps a bit too much.
The oversupply situation will change after around 5-7 years, but the question is whether TNH will survive in a battle of the fittest.

Chinese Yuan devaluation

jumanji0881 Wednesday, 05/28/14 10:03:35 AM
Chinese Currency Tumbles To 19-Month Lows As Bad Debts Hit 5 Year Highs : http://www.zerohedge.com/news/2014-05-27/chinese-currency-tumbles-19-month-lows-bad-debts-hit-5-year-highs
China does not have the luxury of the United States, which can spend excessively because foreign countries continue to buy U.S. government debt (as the dollar is the world reserve currency).
the Chinese government must control its debt, and this includes reducing overindulgence within the real economy. It seems that the punch bowl is empty already and the party is winding down. Now the question is, who will clean up the mess?
U.S. needs law forbidding currency manipulation
Posted on 27 May 2014 by Ellen Croibier.
http://www.tradereform.org/2014/05/u-s-needs-law-forbidding-currency-manipulation/?utm_source=rss&utm_medium=rss&utm_campaign=u-s-needs-law-forbidding-currency-manipulation
Lew’s trip should be an opportunity to demonstrate the U.S. will not tolerate China’s use of currency manipulation to distort trade and exert market dominance over U.S. industries.
The United States plays by the rules, and China does not. It is now time for Congress to pass a bipartisan currency bill that will provide a mechanism for the manufacturing community to remedy the negative effects of currency manipulation.
Lew Urges China to Ease Exchange Rate Controls
By JANE PERLEZMAY 13, 2014
http://www.nytimes.com/2014/05/14/business/lew-urges-china-to-ease-controls-on-exchange-rate.html?_r=0
The Obama administration warned China last month that the Renminbi was too weak, and American lawmakers have threatened to designate China a currency manipulator if the government does not loosen its hold on the currency.
The Renminbi has fallen about 3 percent this year. Analysts say China’s central bank is intervening in the currency markets to engineer a slide in the value of the currency. That would punish speculators and prevent big capital flows from the entering the country.
Illicit trade invoicing fuels China’s currency, housing speculation
Source: Global Financial Integrity (GFI) - Tue, 7 Jan 2014 12:19 PM
Author: Brian LeBlanc
http://www.trust.org/item/20140107121906-9yk6o/
China's central bank governor Zhou Xiaochuan elaborates his "pool" theory as China's foreign exchange reserve.
BEIJING, Dec. 16, 2010 (Xinhua News Agency) --
http://www.istockanalyst.com/article/viewiStockNews/articleid/4749638
Zhou said that a "pool" might be created to hedge against the international hot money flowing into China as a result of the U.S. quantitative easing II (QE2) and the expectation for appreciation of Chinese currency.

Interest Rate Puzzle — Paul-Craig-Roberts and Dave-Kranzler
(Interest Rate Puzzle is beyond my scope)
FYI
Interest-Rate Puzzle — Paul Craig Roberts and Dave Kranzler
June 4, 2014
http://www.paulcraigroberts.org/2014/06/04/interest-rate-puzzle-paul-craig-roberts-dave-kranzler/
Large investors have gained awareness that the U.S. economy is at risk for a negative second quarter, which would officially move the economy into recession. While the Fed is busy propping up the stock market, large institutional investors are moving out of stocks and into the relative “safety” of Treasury bonds.
The question that needs to be asked is, what will the Fed do if 2nd quarter GDP is also negative? As QE did not revive the economy, if the economy heads into an official recession, what policies will the Fed implement in an attempt to revive the economy?
RE 'jumanji
admittedly, the speculations based on margin status, money velocity ... etc .. does not give exact turning time window reliably (what else do?), and the cycle projection is very speculative in nature, use it as a reference,
We have an up trend market, I stick on the long side with mental stops.
ahimsak Re: jumanji0881 Tuesday, 05/27/14 06:56:06 PM
"Don't fight the fed."
Bulls are getting there - Cliff jumping
Cattle Trails - From Wyoming Tales and Trails
http://www.wyomingtalesandtrails.com/cattle4.html
As suggested by McCoy, the slightest thing might set off the stampede.
image: http://www.wyomingtalesandtrails.com/stampedepecos.jpg
Is THIS The End?
By: John Rubino | Mon, Jun 2, 2014
http://www.safehaven.com/article/34029/is-this-the-end
margin debt hit a record in January, turned down in February, and is now falling hard.
chart: http://static.safehaven.com/authors/rubino/34029_a.png
The velocity of money is still plunging
chart: http://static.safehaven.com/authors/rubino/34029_b.png
What we're witnessing, in short, is a truly fascinating attempt by the world's major governments to suspend the laws that have, thus far in human history, governed economics. And the signs of their imminent failure are spreading.
Alan M. Newman: Rationales & Targets
June 02, 2014 at 12:31 PM | written by Alan Newman
http://stockcharts.com/articles/tac/2014/06/alan-m-newman-rationales--targets.html
When total margin debt topped at $416 billion in July 2007, the S&P 500 was at 1455. Despite a decline of 13.8% in margin debt over the next two months, the SPX climbed 4.9% and then hit a new record high in October. Margin had climbed back a bit but did not approach the July high, but nevertheless, that was the top for prices, which collapsed by 50% in little more than 16 months.
The pattern today is quite similar. Total margin debt topped in February at $502 billion and while margin has declined a bit over 5% in the last two months, prices are nominally higher. If the long slide is destined to begin 58 trading sessions after the peak in margin debt as it did in 2007, then the slide will begin this week.
The Next Major Time and Cycle Cluster
By: Ian Thijm | Mon, Jun 2, 2014
http://www.safehaven.com/article/34019/the-next-major-time-and-cycle-cluster
Calendar Days to Trading Days relationship in the market causes CITs.
10/4/11L: +668 CD = 08/02/13H, +668 TD = 06/03/14 +/-1
What's next: We have rallied into the current T&C Cluster, centered on 6/2, suggesting a major swing High forming, which should be followed by a decline into the next Time and Cycle Cluster Low.
chart: http://3.bp.blogspot.com/-sMly_zYBNTI/U4xjbX0DKaI/AAAAAAAA11g/SNCyEsmW3xU/s1600/June+2.gif
MARKET THOUGHTS, threading the needle ..TOP call
Mr. Dev JUNE 16-17th.
http://www.traders-talk.com/mb2/index.php?showtopic=154497
POSSIBLE TOP JUNE 16th /17th or 19th with the work i have so far.
China Sets America’s Mental Trap
Fed has done the extreme efforts on Monetary policy, but the real economy also requires good long term Economic policy. The Washington political gridlock can hardly initiate a good one. Without both horses run in tandem, the economic hang-up may persist indefinitely
China Sets America’s Mental Trap
by Stephen S. Roach
June 01, 2014, Sunday/ 12:53:23
http://www.todayszaman.com/news-349256-china-sets-americas-mental-trap-by-stephen-s-roach-.html
NEW HAVEN – The temptations of extrapolation are hard to resist. The trend exerts a powerful influence on markets, policymakers, households, and businesses. But discerning observers understand the limits of linear thinking, because they know that lines bend, or sometimes even break. That is the case today in assessing two key factors shaping the global economy: the risks associated with America’s policy gambit and the state of the Chinese economy.
The Fed’s mistake was to extrapolate – that is, to believe that shock therapy could not only save the patient but also foster sustained recovery. Two further rounds of QE expanded the Fed’s balance sheet by another $2.1 trillion between late 2009 and today, but yielded little in terms of jump-starting the real economy.
It is often said that a crisis should never be wasted: Politicians, policymakers, and regulators should embrace the moment of deep distress and take on the heavy burden of structural repair. China seems to be doing that; America is not. Codependency points to an unavoidable conclusion: The US is about to become trapped in the perils of linear thinking.
06/01/14 follow up the Ending diagonal
reconcile the projection based on the latest data
this reconciliation implies the SPX will mirror the Ending diagonal scenario,
However, be mindful that the imposing pattern may break prematurely, or, SPX morphs into different pattern.
in essence: all pinpoints to 1931 +/- as an important gauge/pivot.
06/01
length 87.81 (1902.17, 1814.36), base 1862.36
04/26
ELLIOTT WAVE ANALYSIS
http://www.wavetrack.com/
2nd June 2014
The S&P 500 is following the exact script describing an ending contracting-diagonal pattern unfolding as a finalizing 5th wave from the early Feb.’14 low of 1737.92.
The diagonal is composed of five price swings with the third wave in progress from the mid-April low of 1814.36.
To characterize the diagonal, this third wave must unfold into a zig zag pattern – now extending wave ‘A’ of this zig zag by a fib. 61.8% ratio projects upside targets for its completion towards 1929.84 and with last week’s S&P already trading to a new high of 1921.48+/-, it becomes apparent that a terminal high for this third wave is approaching.
The next sequence requires a fourth wave downside correction with measurements towards 1870.00+/- prior to a fifth wave that is ultimately destined to exceed wave 3 by a small margin.
The main theme of the diagonal is that it forewarns of a terminal high well in advance, giving prior warning to a directional trend change. We can estimate the completion within another two weeks, into mid-June.
28th April 2014
The S&P’s advance from its February low represents a finalizing 5th wave that is taking the form of a contracting-diagonal pattern. This limits its upside potential even though fib-price-ratio measurements measure upside targets finalizing towards 1931.33 during the next few weeks.
SPX: Follow Up of The Ending Diagonal Scenario
By: TheWaveTrading | Mon, May 26, 2014
http://www.safehaven.com/article/33936/spx-follow-up-of-the-ending-diagonal-scenario

05/31/14 at a critical moment
Wave perspective - imho, S&P500 index (SPX) comes to a critical juncture.
i did an E-wave chart to illustrate the picture. for easy cross reference, i label P3, P4, P5 in my chart to match with Tony’s Primary wave III, IV, V (Anthony Caldaro, see the following quote).
in essence:
E wave counting is a result of wishful thoughts. Market has her own pulses.
When takes a view outside the E-wave box, imho, 1931.41 is the pivot to gauge whether SPX will enter the zone 1970-2050. (Be cautious, this is a subjective assessment)
P4 = 0.89 * P3
                   P3 to be observed in time window 05/30-06/06,
                   0.89 means 11% off the P3
 P5 = 1970-2050

 1931.41 (1.786, 1474.51, 1266.74, 1560.33)
 1973.26 (1,618, 1576.09, 768.83, length 807.46)
 1975.87 (2.000, 1474.51, 1266.74, 1560.33)
 2047.41 (1.382, 1370.58, 666.79, 1074.77)

weekend update
Anthony Caldaro Posted on May 31, 2014
http://caldaro.wordpress.com/2014/05/31/weekend-update-450/
Primary waves I and II completed in 2011, and Primary wave III has been underway since then.
( note: Primary I (1370.58), Primary II (1074.77) )
Primary III is dividing into five Major waves
Major wave 5 has been underway since February
When Major 5 concludes it should end Primary wave III ( P3 ). Then a potentially steep, multi-month, correction will follow for Primary IV ( P4 ) .
We are expecting Primary IV to last about three months with a market loss of 15+%. Then Primary V ( P5 ) should take the market to new highs to conclude the bull market. Thus far we are maintaining our bull market target range of SPX 1970 to 2070 by Q3/Q4. ( first week of November )

Paul Krugman: Why We’re in a New Gilded Age
May 8, 2014 Issue
http://www.nybooks.com/articles/archives/2014/may/08/thomas-piketty-new-gilded-age/
05/30/14 status
projected intermediate peak (not the TOP)
 DJI   16719.24,   16810.54,     17150.25  so far 16735.51
 SPX   1903.59,  1906-1914,  1931-1932  so far   1924.03


05/30/14 Core watch list (Integrated Oil, Oil-Gas-Refining)
This is a big family, i have a few tickers in my core watch list.
CVX OXY TOT COP LYB MPC PSX ESV
i bought COP, it pays good dividend

time stamp link: http://forexrainbow.com/viewer.php?file=88251134673144463646.jpg

LyondellBasell Industries
https://finance.yahoo.com/q/pr?s=LYB+Profile


RE: ahimsak
Thank You for sharing.
The Fibonacci projection produce multiple points, so far, the index has moved longer than 1.618 @1903.59.
based on the specific set up (see chart), the next one is 1.786@1920.79. But, 1903-1931 is full of Fibonacci points based on different reference. Since we are on the long side, the higher it moves, we are in better shape.

05/29/14 SPX timing window
SPX is entering the (90 degrees from 03/07 +/-) window now.
To keep the speculation simple, i skips other cycles.
05/26/14 01:24:03 PM
the harmonic cycle on 05/30 (chart 2) may take more weight (than "supposed" to be) on the cycle dominance.
04/04 – chart 2
http://forexrainbow.com/images/35002363476333922016.jpg
RE: Rivers -
(1) What's your take on seeing Treasury yields fall as the S&P hits all time highs?
This Old Bull Still Has Legs.
(2) Why are bond yields so low?
This is beyond my scope, Let's see what experts have to say ...
FYI:
Can’t Find Enough 30-Year Treasuries to Buy? Here’s Why
By Susanne Walker May 5, 2014 11:20 AM PT
http://www.bloomberg.com/news/2014-05-04/can-t-find-enough-30-year-treasuries-to-buy-here-s-why.html
Why are bond yields so low?
By Matt Egan @mattmegan5 May 16, 2014: 1:09 PM ET
http://money.cnn.com/2014/05/16/investing/bonds-interest-rates/
TREASURIES-Yields fall to six-month lows, ECB rate cuts expected
Wed May 14, 2014 9:30am EDT
http://www.reuters.com/article/2014/05/14/markets-usa-bonds-idUSL1N0O00NM20140514
SPX: Follow Up Of The Ending Diagonal Scenario
FYI
new material released by The Wave Trading
The Wave Trading
26 MAY 2014
The current up leg from the April 11, which is the last wave of the assumed Ending Diagonal could top either at the trend line that connects the April 22 high with the May 13 high (blue trend line) in the area of 1915 or it could reach the upper trend line of the Ending Diagonal in the area of 1930
http://www.thewavetrading.com/spx-follow-ending-diagonal-scenario/
05/27/14 Ending diagonal
A few technician are calling the Ending diagonal.
For example:
http://www.thewavetrading.com/wp-content/uploads/2014/05/SPX-DAILY-ED.png
http://www.thewavetrading.com/spx-major-top-place/
Let’s review the key aspects for Ending diagonal
ELLIOTT WAVE PRINCIPLE
http://www.ew-forecast.com/theory/
An ending diagonal is a special type of pattern that occurs at times when the preceding move has gone too far too fast, as Elliott put it. A very small percentage of ending diagonals appear in the C wave position of A-B- C formations. In double or triple threes, they appear only as the final "C" wave. In all cases, they are found at the termination points of larger patterns, indicating exhaustion of the larger movement.
• structure is 3-3-3-3-3
• a wedge shape within two converging lines
• wave 4 must trade into a territory of a wave 1
• appears primarily in the fifth wave position, in the C wave position of A-B- C and in double or triple threes as the final "C" wave
(copyright) chart: http://www.ew-forecast.com/content/fck/image/Patterns/ending%20diagonal.gif

05/12
http://investorshub.advfn.com/boards/read_msg.aspx?message_id=101857446
1737.92-->1897.28-->1814.36-->
0.577 1906.31
0.618 1912.84
1729.86-1627.47, length 102.39
base 1737.92, extension 1.618@1903.59, 1.707@1912.70
chart: http://forexrainbow.com/images/85205427314277595081.jpg
RE: ahimsak
i stick with the projection i made :
SPX 1903.59, 1906-1914, 1931-1932
DJI 16719.24 - (16810.54) -17150.25
The best guess is an intermediate peak in between 1906-1914. then, there will be a sizeable pullback, the tentative target is covered in this post, in essence, pullback target = peak * 0.89.
I am on the long side with mental stops, imho, this Old Bull Still Has Legs.
private message
Thank You for those who sent private messages to me, since i did not subscribe the privileged access, I can not reply these messages privately. I put my core watch list in "my stocks" as a "reciprocate"
05/26/14 SPX
SPX marked an intraday high 1902.17 on 05/13, one day late than the projected time window 05/02-05/12 (the best guess was 05/06). While this is certainly a critical moment in cycle but index has not yet given any reversal signal. In fact, SPX deployed an all time high close 1900.53 on 05/23 suggests the harmonic cycle on 05/30 (chart 2) may take more weight (than "supposed" to be) on the cycle dominance.
04/22/14 SPX Timing window
The exact date is hard to perceive (it drifts around), best guess is around 05/06 +/-. time window is 05/02 - 05/12
03/19/14 04:12:04 PM
The projected peak in May (05/12 +/-) is very important for the long term consequence.
03/04 – chart 1

04/04 – chart 2

02/28
Index takes out important pivots 1860.11 (highlighted in green in the wave table), the 1900 zone is becoming ‘reachable’.
wave table:
>>gdl: RE Most-likely-we-do-not-test-the 1550 range
nice summary, and we have shared the same perception.
05/19/14 miscellaneous updates
I speculated the dip will not reach 1560 on the first large pullback, thus the reason I think the best bear case could be 1721-1688.
03/15/14 long term perspective
Now, let’s check what is the minimum high so that its 0.618 pullback with reference to 1343.35 will not be lower than 1560.33? The answer is 1911.36. , very close to the unrealized intermediate term high target 1903.59.
TheWaveTrading link
http://www.thewavetrading.com/spx-major-top-place/
05/19/14 miscellaneous updates
SPX market an all time intraday high on 05/13 @1902.17, it is only 1.42 points to the projected wave 5/V/(3) target 1903.59.
Projected Targets:
 DJI      16719.24,        16810.54,           17150.25          so far 16735.51
 SPX      1903.59,      1906-1914,         1931-1932          so far  1902.17


The WaveTrading
18 MAY, 2014
http://www.thewavetrading.com/wp-content/uploads/2014/05/logo1.png
There are plenty of supports that could deter a meaningful decline (The major ones are 1813.55 which is the last higher low and the rising 200 dma which today stands at 1786)

we can see in the monthly chart that if the 10-month m.a. Is penetrated it could define the beginning of a bear market cycle. Probably price should retest the former breakout layer 1576 – 1553. If this support does not hold than it would lock in the advance from the 2009 low as a complete Elliott Wave pattern (Double Zig Zag) opening the door to a much larger decline

05/16/14 There is no cycle peaking-out confirmation
SPX closed at 1877.90
Too close to make a decisive conclusion.
There is no cycle peaking out confirmation.
Wednesday, 05/14/14 01:32:26 PM
To confirm 05/02-05/12 as a cycle peak (not the TOP), needs to see a lower weekly close, close below 1878.48, the other gauge is the 0.236 retracement out of 1902.17 & 1814.36, thus 1877.71. (Note: this is the minimum requirement)
RE: ahimsak Chicago-Fed-National-Activity-Index (CFNAI)
Thank You
April's data will be released on May 22, 2014
CFNAI for March/14
https://www.chicagofed.org/digital_assets/publications/cfnai/2014/cfnai_april2014.pdf
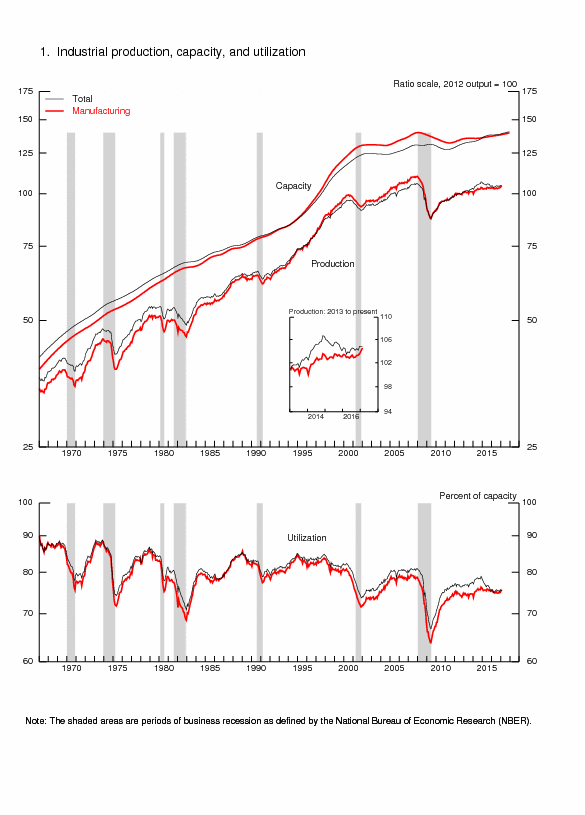
05/16/14 On fundamentals: ECRI-WLI & FED Industrial-Production
(1) U.S. Weekly Leading Index
Public update: May 16 10:30am
https://www.businesscycle.com/
(chart with the data downloaded from ECRI)

(2) Industrial Production and Capacity Utilization
Release Date: May 15, 2014
http://www.federalreserve.gov/RELEASES/G17/current/default.htm
05/14/14 tentative pullback target
use 1902.17 as the reference (** requires confirmation **, refer to the replied post), the tentative pullback target is 1692 (**best** case) that 'transits' via two supportive zones: 1822-1792, 1721-1692-1688
It's lunchtime: Catch of the Day by Thomas Mangelsen shows the split second before a grizzly bear shuts his jaws on a sockeye salmon
photo: http://i.dailymail.co.uk/i/pix/2013/07/16/article-2364780-1AD40389000005DC-74_964x642.jpg
05/14/14 China Real Estate Development and Sales
The data spectrum shows an obvious weakening trend
China Real Estate Development and Sales in April 2014
http://www.stats.gov.cn/english/PressRelease/201405/t20140513_552613.html


Private Investment in Fixed Assets for the First Four Months of 2014
http://www.stats.gov.cn/english/PressRelease/201405/t20140513_552608.html

Total Retail Sales of Consumer Goods in April 2014
http://www.stats.gov.cn/english/PressRelease/201405/t20140513_552615.html

05/14/14 Next week & beyond
S&P index marked an all time intraday high 1902.17, just shy 1.42 points to the unrealized target 1903.59 (chart 2),(the lowest high target).
Targets:
SPX 1903.59, 1906-1914, 1931-1932
DJI 16719.24 - (16810.54) -17150.25
To confirm 05/02-05/12 as a cycle peak (not the TOP), needs to see a lower weekly close, close below 1878.48, the other gauge is the 0.236 retracement out of 1902.17 & 1814.36, thus 1877.71. (Note: this is the minimum requirement)
In the past 18 months or so, most of the top callers got "drowned" (chart 1). Meanwhile, a normal pullback in an uptrend had been interpreted as “The End of bull” by those 'vigilant' speculators. ( chart 3 & refer to the descriptions).
imho: In overall, still the same old 6 boring words: “The wave structure still looks bullish” (chart 4 & refer to the descriptions).
Wednesday, 04/02/14 03:56:05 PM
http://investorshub.advfn.com/boards/read_msg.aspx?message_id=99933537
chart 1

Wednesday, 02/19/14 04:07:18 PM
http://investorshub.advfn.com/boards/read_msg.aspx?message_id=97526821
Ongoing sub wave exceeds its 1.0 wave length target @1840.31. The bullish target is 1903.09 (1.618)
( 1903.59 = 1737.92 + 1.618*(1729.86-1627.47) )
chart 2
Saturday, 03/15/14 06:03:24 PM
http://investorshub.advfn.com/boards/read_msg.aspx?message_id=98870726
Let’s check what is the minimum high so that its 0.618 pullback with reference to 1343.35 will not be lower than 1560.33? The answer is 1911.36. , very close to the unrealized intermediate term high target 1903.59.
chart 3
05/12/14 Review the overall picture
This post is a continuation part for the post dated 04/15/14
For those who trade in a 20 -50 points swing frequently, the following discussion may be immaterial at all; for investors, we better put possible options on the table for a complete review. How to invest/trade into an effective way is not the the topic of this post.
imho: refer to the following chart, there is no way to know 1370.55 is wave A (bearish series, A B C or W X Y) or Wave 1 (bullish series, 1 2 3 4 5), According to the E-wave, bullish counting will have a few more hundred points to go. the Fibonacci extensions give an estimate from 21xx to 22xx.

05/12/14 closing at all time high
new all time high (closing basis)
SPX 1896.62 (intraday 1897.13, prior high 1897.28)
DJI 16695.47 (intraday high 16704.84)
>> Still thinking 1910 for a top?
ahimsak
hard to say, let's check the 'moving sequence'
(1) testing high 1897.28 (04/04 intraday high)
(2) 1903.59
(3) 1906-1914
(4) 1931-1932
1737.92-->1897.28-->1814.36-->
0.577 1906.31
0.618 1912.84
1729.86-1627.47, length 102.39
base 1737.92, extension 1.618@1903.59, 1.707@1912.70
05/12/14 Misc.
Review: The timing period covered 05/02 – 05/12
as outlined in 05/06’s comments, the rally strength is not strong, only DJI marks new high but it is still shy from the lowest High target 16719.24, the preferred number is 16810.54. SPX support has been speculated correctly
allows a few more days margin to see if the peaking force is dampening out completely or the cycle undergoing right translation.
05/06/14
imho: 1886 (1885.53) ties with a time correlated Fibonacci ratio 0.764 (=1 - 0.236), it was the resistance on 05/05. Today's opening weakness hints the rally sentiment is fading. Without taking out 1886 and closing above it, the peaking process is ending. Otherwise, the bullish window will cut off on time till 05/12. allows +/-.
05/02/14 enters time zone 05/02-05/12, center 05/06
04/22
there is a good chance to see SPX & DJI to test their highs
or make new highs in early May,
NDX & RUT may produce a lower high respectively.


>> BofA Sees No US-Recession During-Next-Decade / Goldman's-Q2
FYI
------------------------------
Here Are Goldman's Key Predictions For Q2
http://www.businessinsider.com/goldman-q2-2014-5
Joe Weisenthal May 9, 2014, 6:32 AM
05/09/14 SPX intraday
intraday resistance 1875.44, support 1867.02 (as of 05/08, 50 SMA 1865.72 http://stockcharts.com/h-sc/ui?s=spx )
enter correction mode: 1859.67
open gap: 1844.02-1846.01

05/09/14 GDX review
GDX still in downtrend
GDX
02/28
GDX. a minimum bounce requirement is 0.236/28.50,
http://forexrainbow.com/images/44460034812378509181.jpg
03/19
GDX deployed an intraday high 28.03 on 03/14 then reversed, this action proved 28.5/0.236 is a meaningful pivot.
http://forexrainbow.com/images/07804427275501360951.jpg


