 News
News  Market Data
  Discover
Support: 888-992-3836
Copyright © 2023 InvestorsHub Inc.


Gizmo
![]()
Register for free to join our community of investors and share your ideas. You will also get access to streaming quotes, interactive charts, trades, portfolio, live options flow and more tools.
Register for free to join our community of investors and share your ideas. You will also get access to streaming quotes, interactive charts, trades, portfolio, live options flow and more tools.
Well, the bonds coupons get paid to the fund and they must be paid out. When I've had bond funds in my 401k they paid the interest monthly. If a trade out occured before month end I still got a prorated cut of the interest for that month.
Bonds are great in an uptrend and the losses in a downtrend are offset by the interest payments.
Speculating on Speculation
With so many investors and analysts foreseeing a year-end advance, there's at least an even chance that we've already seen it. Meanwhile, despite hopeful signs from various short-term indicators, there are increasing signs of deterioration in the underlying condition of the economy.
By John P. Hussman, Ph.D.
President, Hussman Investment Trust
http://www.hussman.net/
Rising tops resistance, Rising bottoms support, ever narrowing range.
Until a sustainable break comes profits need to be taken quicker and quicker i.e the ping pong effect.
They do. Rydex pays prorated even for one day in the fund.
Cot chart for US Bond. Commercials inching up longs.
http://www.softwarenorth.net/cot/current/charts/US.png
87.53 support could stop the drop for a partial retracement to at least 91.28 and possibly to the declining tops TL. A 4 to 4 1/2% rally then another leg down to 80/81.
Sentiment is quite bearish.
Darkness before the dawn?
By Mark Hulbert, MarketWatch
Last Update: 12:01 AM ET Nov. 4, 2005
ANNANDALE, Va. (MarketWatch) -- The bond timing newsletters I track at the Hulbert Financial Digest have never been more bearish than they are right now.
And that, according to contrarians, is bullish for bonds.
Consider the latest readings from the Hulbert Bond Newsletter Sentiment Index (HBNSI), which reflects the average exposure to the bond market among a subset of short-term bond timing newsletters. As of Thursday night's close, the HBNSI stood at minus 67.4%.
That means that the average of the timers included in this sentiment index is recommending that two-thirds of the amount subscribers have allocated to the fixed income market should be invested on the short side of the bond market. That's an aggressive bet that the bond market will decline, and that interest rates will rise.
Contrarians believe that the markets rarely accommodate the majority, so this extreme bearishness is bullish.
More at http://www.marketwatch.com/news/story.asp?dist=¶m=archive&siteid=mktw&guid=%7B7F002CAC%...
And from BCA Research http://www.bcaresearch.com/public/story.asp?pre=PRE-20051101.GIF
Government Bond

Charts
Notice the BB width on the Comp weekly? It's gonna push one of those bands. I think we're going to the top band, the question is does the resistance of the rising tops hold again and reverse the trend?
Ndx/Indu. After a period of consolidation the ratio is pushing the upper band and moving towards a new range. The significance of this ratio is that it measures investors appetite for risk.
Bigger picture shows Ndx/Indu at new recovery high.
I gave back 1.80%. Most from the first 25% position from 1579. The second from 1618 doesn't look bad.
May take the poorer position off. Rydex Bond fund looking interesting. Oversold, near big support, and should have a 4 up soon. I would think some money can be made timing bonds if one catches an uptrend for cap. gains and the near 5% dividend regardless.
Re Ndx, I'm of the belief that sometime next year we have a 4 year cycle low due. But, I wouldn't want to suffer 2x a run to 1700+ even on a 25% position.
Chart of Rygbx
And I replied on the wrong board. LOL deleted in time.
I don't know that it's negated yet. As you said printed 453 and change.
Many more importantly however the mark is at 453 points. If this should be exceeded, the favored negative scenario would be neutralized.
Maybe give it a bit more eh?
Deleted
Adding 25% to short for 100/200.
Rydex traders getting bullish fast.
http://www.schaeffersresearch.com/streetools/market_tools/rydex_nu.aspx?click=jumpto
Any indication today was the momentum high? I've forgotten how many days the price high follows momo high...could you refresh me?
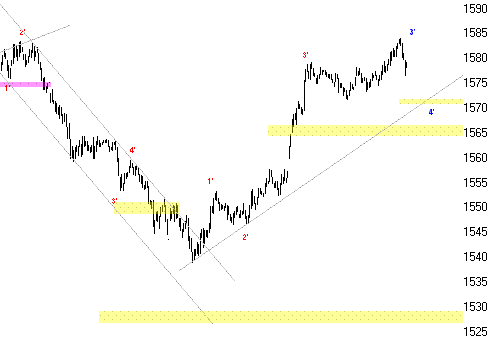
O's count would have this as the 5 up. The 4 ended at 1570. The bottom of the 2 to the top of the 3 was 35 points, if wave 5 is of equal length it would end at 1605. I think his alternate count in blue is the right one. The question is where does the 5 end? My method of calculating the wave length may not be proper. Not sure if I'm adding yet. I want to ask Jim Quince if he has any indication that today was the momentum high.
Btw...if you're not aware O's target is 1610.
My additions

Nasi Weekly.
When the 3/7 crosses up not time to be short. Adx 37 or Stochs may give an earlier warning than the MA crossover. Right now I think it goes to the April level but Ndx price may not.
After a hiatus NYSE members and specialists building shorts.

On cycles and rising wedges.
By Mark Arbeter
During last week, the S&P 500 index seemed like a rubber ball in a three-foot room. Looking back towards the early part of October, the index has been confined to the 1170 to 1200 zone. It has been a real tug of war between the bulls and the bears and at this point, no one is winning.
As far as overhead supply, there is decent chart resistance in the 1190 to 1210 area. There is a whole host of important moving averages that sit right on top of the market, and in our view, are creating a ceiling on the S&P 500. The 200-day exponential moving average lies at 1196, the 200-day simple comes in at 1199, the 150-day exponential average is at 1202, the 50-day exponential is at 1205, and the 80-day exponential moving average lies at 1207.
In addition to the chart resistance and moving average resistance, there is a plethora of trendlines overhead. The trendline drawn off the most recent highs as well as the trendline drawn off the June, August and September lows both lie at 1217. The trendline off the August, 2004, and April, 2005, lows comes in at 1200.
We think that the S&P 500, from a longer-term perspective, has completed a bearish rising wedge formation and the implications of this is a complete retracement back to the lowest part of the formation, which is down at 1060. There have been two major breaks of long-term trendlines drawn off the March, 2003, lows. One of these trendlines touched of the 2003 lows connected up to the lows in August, 2004, while the other trendline was drawn off the April, 2005, low. After the first trendline was broken back in April, 2005, the market tested the underside of the trendline before rolling over. A similar situation could occur with the second trendline providing resistance before the market rolls over again.
Major cycle lows that are projected over the next three to 12 months could also provide pressure on the stock market, in our view. The 39-week cycle low is forecasting a bottom at the end of February or the beginning of March. This cycle has been pretty good at targeting major lows of late, bottoming at near the lows in April, 2005, August, 2004, March, 2003, July, 2002, and September, 2001. The 78-week cycle is also targeting a major low in the first quarter of 2006. In addition, the four-year cycle, which has also been very accurate in predicting major market lows, is due to bottom in the fall of 2006.
The Nasdaq has also bounced around quite a bit of late, confined to a range of 2025 and 2120 for much of October. Like the S&P 500, the Nasdaq faces some decent hurdles overhead in our view. Chart resistance lies between 2100 and 2160. The 150-day exponential moving average comes in at 2095, and both the 50-day and 80-day exponential averages sit at 2110. Trendline resistance, drawn off the most recent peaks in August, September and October, is at 2135. Intermediate-term trendline support comes in at 2040 with chart support between 2000 and 2030.
Sentiment in the options market is all over the place, in our opinion, and so it is a difficult read right now. CBOE put/call ratios are very high, suggesting a high level of fear in the options market. This has often been bullish for the stock market over the years. The one potential negative with the current trend of rising put/call ratios from a longer-term perspective is that the action is typically more indicative of a bear market and not a bull market. During bull markets, put/call ratios tend to trend lower, while during bear markets, put/calls tend to trend higher. Both the OEX put/call ratio and the equity-only put/call ratio are suggesting that the market has further to go on the downside, in our opinion.
The Treasury bond market had a significant week, in our view, and it looks like the trend in interest rates remains firmly higher. The 10-year Treasury yield broke out above what we view is very important trendline support, and the yield appears headed for the next layer of support up in the 4.7% to 4.9% area. The 10-year gapped through long-term trendline support drawn off the May, 2004, and March, 2005, yield highs. This suggests to us that the trend since May, 2004, of lower yield highs and lower yield lows has been reversed and that a new trend of higher yield highs and higher yield lows is emerging.
Short rates also continue their consistent climb higher, suggesting no relief from the Fed in our view. The 1-year treasury has been steadily climbing since March 2004 and is now at its highest level since March 2001. The 1-year has risen from about 1% to over 4% over the last year and a half. We believe the combination of rising short and long-term rates, if they continue, will put a lid on stocks and potentially send the market lower over the next 3 to 12 months.
Arbeter, a chartered market technician, is chief technical strategist for Standard & Poor's
http://www.businessweek.com/investor/content/oct2005/pi20051030_3457_pi045.htm
Dude..what do you mean by IHUB ID? We have an Acct.#, A username and password, and an alias.
Giving out ones Username is probably not a good idea.
I edited the last post and inserted Culmus's explanation. Your on the same page with 1600+ to follow. I believe he is looking for a low of 1528-1530 before the upmove.
He's been short since 10/26. Not that it matters but in the interest of accuracy.
Powerful upmove today. AM and PM pricing were the same at 1579. So no gain/no loss on the day.
Well, I entered a 50/200 Ndx short. Japan up strong, Europe opened strong. I think the Ndx needs to do a better retest of the lows.
Small position reflects my uncertainty.
Thanks for posting stuff that matters to the serious among us.
He's bearish on the BTK too. Looking for 560 and then 524 in the larger timeframe. His accuracy has been good and if right again not good for the Ndx.
Deleted. Replied to wrong message.
Folks on the other board know where that came from, for any that are unaware of the source...
http://www.wallstreet-online.de/ws/news/chartanalyse/main.php?action=open&id=1768363&&m=...
Open updates by the author Mathias Onischka need translated through babelfish.
What's your take post Fed?
I think up. Market should be flush w/cash for a couple weeks. If any rally is sluggish w/high volume it will be telling.
I think the Fri. rally gets sold Mon. after a little latent buying.
Small Specs are getting short which is bullish.
http://www.softwarenorth.net/cot/current/charts/SP.png
UPDATE Elliottwaves SOX - Semiconductor index
In the last analysis of at the beginning of September was discussed a medium-term Top education with 480/490 points, so that it goes in the autumn months clearly downward. The BREAK of 447 should represent the medium-term starting signal, so that the index continues to look downward.
The fact that it actually gave in September a Top with 486 might not have been surprising, since this was announced for months already. Fortunately the BREAK of 447 without larger hesitating succeeded, so that the index downward is now on the way.
To central and long-term scenario does not have to be shaken, there the price history of the past weeks of this even confirmed have-wave-technically the trend of prices since at the end of of 2001 (!) large and complex correction wave is slammed shut. This wave B has the form of a corrective trifishes. The moderate upward motion since March 2004 becomes as locking wave |E| of B counted.
On view of 18-24 months a Abwaertspotenzial until under 200 points results from this Wavecount. The bullische alternative would be a Downmove to 300/305 points, which however nevertheless a Downmove of minus 40 per cent corresponds starting from the Top.
Illustration 1: Weekly Chart SOX
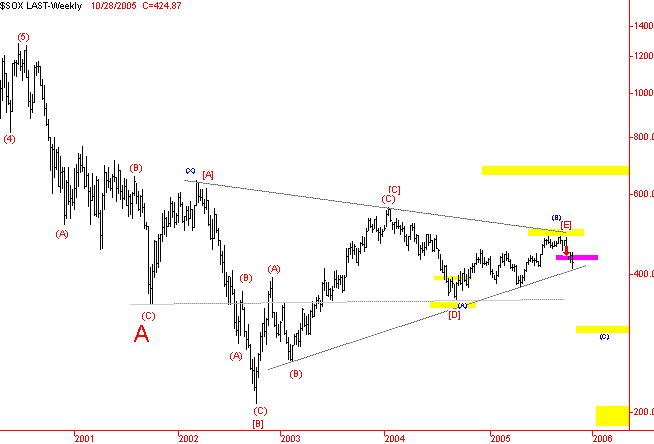
Picture increase
The dynamics on the Short side will strengthen, as soon as the index broke through the lower tri fishing delimitation. Charttechnisch results a broad support zone at 400-418 points, ever after like one designs this trend line. Anyhow the BREAK of this support will accelerate the downtrend. Whether the SOX this support in the first approach significantly breaks through is however rather questionable. Typically this succeeds with tri fishing corrections only in the second approach.
On daily basis is to be counted therefore at the latest at approximately 400 points on a clear reaction. It even speaks some for the fact that this return begins in the coming commercial week. Even the market technology is already over-sold, even if it can expand this situation still loosely two weeks. Wave-technically the Low of Friday fulfills all requirements to a complete first Abwaertsfuenfer.
The Korrekturpotenzial for the next 2-3 weeks lies at approximately 447 points, whereby also a terminator point is possible with scarcely 440. Many more importantly however the mark is at 453 points. If this should be exceeded, the favored negative scenario would be neutralized. Up-to-date there are no references for such a rise however.
Illustration 2: DAILY Chart SOX
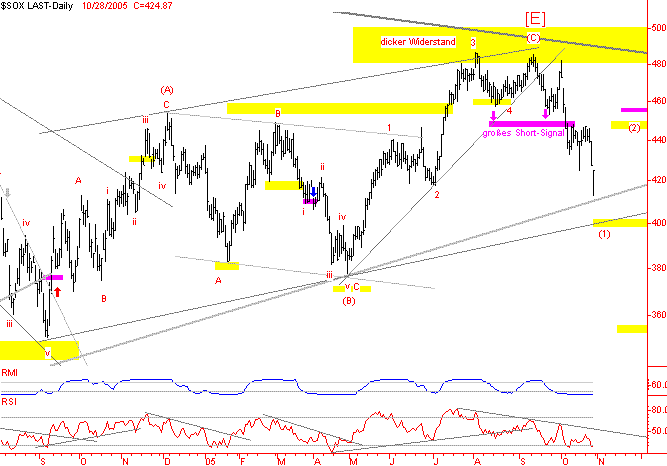
Picture increase
Unterm line will note sideways the SOX in the next weeks on the current level under strong fluctuations. Since it concerns however only a Verschnaufpause, further losses are to be taken into account to year end.
Result:
The trend arrow shows clearly downward, at least which concerns the medium-term trend. To end next yearly is realistic losses until at least 300 points. The SOX reached a first catching zone at short notice, so that there is a Verschnaufpause to 447 in the next weeks first.
Much better than last year and year before? What has changed?
21.15% Ytd. 5.26% Week.
October has been good to me.
May add a short Mon. AM. Good luck.
All out to cash. I agree with that assesment. Possibly a bit more upside Mon. Am. first?
Yep, that's the talk of the town with everybody afraid to buy anything. Getting 180 long at 10:45.
Out to 90% cash, 10% long Healthcare sector.
I'll be taking more short profit. Debating sensabilities here...

