News
News  Market Data
  Discover
Support: 888-992-3836
Copyright © 2023 InvestorsHub Inc.


Register for free to join our community of investors and share your ideas. You will also get access to streaming quotes, interactive charts, trades, portfolio, live options flow and more tools.
thanks > glad I could help > need anything flag me
I thought I was pretty good at think-or-swim programming already, but I just had to say, beyond this being just a cool indicator, this thinkscript alone taught me 2 new things: how to auto-plot trend lines and how to add tooltips / hints to think or swim study inputs. So I wanted to say thanks!
tos memory visited again >
http://investorshub.advfn.com/boards/read_msg.aspx?message_id=125782867
Liked the videos of course
So far so good. I did not really have that much in there.
Batton down the hatches tropical storm thursday in florida
then north to georgia. Tampa Bucs changed game from thursday
to wednesday
Saints ravens game thurday is indoors. In clearwater FL. if
the weather bad the causeway from clearwater to tampa floods
and they close it. South tampa floods like you would not believe.
People get in canoes and travel down the street.
Important save / swap info >
Prior to a TOS program reload
give cache dump a try first, see what happens
and get back to me on that
Thanks
Video says to delete cache files too. I have used collect
garbage
My PC is only 4gb ram so i have to run smooth. If i get performance
problems again should i reload TOS platform
try to dump garbage 1st video *use this during the day"
THINK or SWIM Temp storage (cache)
I was getting performance issues on TOS. Talked to a male IT
TOS clown and he was just plain stupid and lazy. No help
SO anyway I talked to a female IT person. I said does TOS
have a cache or temp area that can be cleaned. Cleaned
no problems yet
Directions
1-right click on TOS icon
2-click properties
3-click open file location
4-then find the USERGUI FOLDER AND DELETE FOLDER
Hi spdpro
Going to send you some really cool looking TOS blended
charts from today or at least this morning to mid day.
You will find them neat I think.
How be ???
My birds are so hungry in the morning that I could almost
hand feed them from the window , but I am not starting that
program.
I stick my hand out to put the seeds but then take my hand away
but they stand there waiting , right by my hand.
They are not park P Bullies who do those hand feeding , head sitting and etc. LOL
OK here > will be back tonight
sp how be ???
TOS 400t with Blue River still one of the best at times.
Just want YOU to know that .
Jimmy still around and some new young friends getting to know
me :o) So funny this on going thing with this Doves on
the window.
Hope all is well.
CH
Thank you excellent charts
great job
I think this is a very good article on seekingalpha. I'm going to cut and paste the whole thing below because you have to sign in to read their stuff. You'll have to sign up (if you haven't already) to see the charts. If you just want to scan the info., it's below.
http://seekingalpha.com/article/3964833-bull-market-last-chance-reduce-risk-exposure#
Also, here are some market sentiment sites that might be useful. I expected a bit of a reversal today but, not the over joyous jump into the stock market pool and not worry about the earnings move we had today. JP Morgan reported that hey, they lost money but, not as much as the analysts expected and so the market rejoiced....holy moly.
Both my RVX and VIX daily charts flipped back down today to support levels. RVX turned up towards the end of the day but, the stock market totally ignored that move and kept up the trend to end of day. Nothing was stopping that move!
https://www.marketedge.com/MarketEdge/DRME/drMarketTimingSentiment.aspx
http://money.cnn.com/data/fear-and-greed/
*******************************************************
The Bull Market Is Over - Last Chance To Reduce Your Risk Exposure
Apr. 12, 2016 6:09 PM ET|13 comments | Includes: ITOT, IVV, IWM, SCHB, SDS, SH, SPY, SSO, TNA, TZA, VOO, VTI, VTSAX
J. Lawrence Manley, Jr., CFA J. Lawrence Manley, Jr., CFA?Follow(33 followers)
Contrarian, value, CFA, registered investment advisor
Send Message|Manley Capital Management, LLC
Summary
Seven years of financial repression induced by the Fed has driven stocks far from their intrinsic value. Equities offer a very poor risk-reward and prudent investors should reduce their risk level.
Foreign markets and the Russell 2000 are in a bear market that began last summer.
Corporate profits are in recession, GAAP EPS have declined by 18.3% from the third quarter of 2014.
Central Bank activism has reached its endgame. Negative interest rates - the central banker's new monetary tool - actually hurts the financial sector, which they are trying to artificially support.
The typical bear market decline is 32.4% over 13 months, we estimate that fair on the S&P 500 is 1265, down 41% from the all-time high set last May.
First Quarter Review
The S&P 500 ended the first quarter up 0.89%, this modest performance greatly understates the historic volatility that occurred. After a weak fourth quarter rally, the markets began 2016 with a sharp decline, as investors feared that deflationary pressures were accelerating and a global recession was imminent. By the middle of February, global financial markets were in turmoil and the S&P 500 and the Russell 2000 had declined by 14.5% and 21.6%, from their respective fourth quarter highs.
As the markets declined and the deflationary fears increased, the central bankers responded (intervened) by pushing monetary policy further into unprecedented territory. First, on January 28th, The Bank of Japan reduced short-term interest rates to below 0%, (a negative interest rate policy). Then, on February 11th, Sweden's central bank reduced short-term interest rates to minus 0.50% from minus 0.35%. Additionally, the European Central Bank (ECB) told investors that they would increase liquidity and the level of financial accommodation at their March 11th meeting. These central bank actions were enough to stop and reverse the market decline by mid-February. The central bank intervention continued in March. The ECB, at their March 10th meeting, provided more accommodation than the market expected: they cut interest rates to minus 0.40%, increased their asset-purchasing policy to 80 billion Euro a month from 60 billion Euro, and they declared that they will purchase investment-grade corporate bonds, in addition to, the sovereign bonds they were already buying. Finally, on March 16th, the Fed announced that due to the global uncertainty, they would be less aggressive in raising interest rates to a normal level (i.e., they plan to increase interest rates twice, instead of their December estimate of four increases in 2016).
From January through mid-February, the markets were driven lower due to weakening fundamentals and recessionary fears; then from mid-February through today, the markets were driven higher (S&P 500 up 14.5%) as central banks intervened with dubious short-term policies (negative interest rates and Quantitative Easing) to drive-up risk assets. In our view, central banks intervened again to drive stocks further from the fundamentals and their intrinsic value. Their attempt to manage price levels, may work in the short-term, but in the long-term these actions: lead to a misallocation of capital, create additional structural imbalances and only delay the market's inevitable regression back to the underlying fundamentals.
We believe that a Liquid Alternative strategy that is diversified and balanced (stocks, bonds, currencies and commodities) is poised to perform well in today's volatile and uncertain investment environment. Also, as value investors, we believe that an asset allocation must be driven by the market's risk-reward, to meet the goal of providing positive absolute returns, with reduced volatility and a low correlation to the risky stock market.
Investment Outlook Summary
*We continue to believe that the stock market offers a very poor long-term risk-reward. More than seven years of easy money due to the Fed's policy of financial repression - 0% interest rates, negative real rates, QE (creating money to buy financial assets), and jawboning the financial markets - drove risk assets far from their intrinsic value. Currently, corporate earnings are in recession and the global economy continues to deteriorate. In our view, we are in a bear market that began in May 2015. While the typical bear market decline is 32.4% over 13 months, we estimate that fair value on the S&P 500 is 1265, down 41% from the all-time high set last May.
*After a 15% decline during the first six weeks of 2016, central bank activism ignited the current 14.5% rally that has driven asset values further from their intrinsic value. After seven years of "unconventional monetary policies", it is clear they have had little positive impact on the economy and, in our view, these policies have actually led to a misallocation of capital and an increase in the long-term economic structural imbalances. One such imbalance, due to the Fed's artificially low rates (financial repression), is the near-record corporate stock buybacks that occurred last year and during the first quarter of 2016. Instead of investing and building for the future, corporate America continues to defer capital expenditures and borrow to buy back their overvalued stock. While repurchasing the shares outstanding improves earnings-per-share growth and boost the stock price in the short-term, the reduction in capital investment leads to slower growth, less productivity and lower profitability in the long-term.
*While market-based indicators - credit spreads, the yield curve, inflation expectations and market breadth - have modestly improved since the February nadir, they do not confirm the dramatic equity rally and continue to indicate that the economy is headed for a significant slowdown or recession. The Atlanta Fed's GDPNow Economic Model confirms this economic weakness and currently forecasts that the first quarter of 2016 will grow only 0.1% (down from an estimated 2.5% in mid-February).
*We expect U.S Treasury Bonds will continue to perform well in such a sluggish economic environment and we expect bonds to effectively hedge our equity exposure in periods of market weakness (i.e., an equity hedge that pays 2% annually). Additionally, 10-year U.S.Treasury bonds, which currently yield 1.75%, offer good relative value when compared to other major economies: Germany (10-year bonds yield 0.10%), Switzerland (10-year bonds yield minus 0.35%) and Japan (10-year bonds yield minus 0.05%).
*Additionally, in the first quarter, economic uncertainty and central bank activism led to gold's best quarter since the third quarter of 1986. As the global economy struggles and the central bankers go further into unchartered territory, we expect gold - as an alternative currency - will perform very well. In the short-term, the market has appreciated a dramatic 14.5% over the past seven weeks and recent market-based divergences indicated to us that stocks are due for a correction and possibly begin the next leg down in this 10-month old bear market.
Asset Allocation: As value investors, the market's long-term risk-reward drives our strategic asset allocation, which remains defensive and positioned to perform well during periods of slowing economic environment and rising market volatility. Our tactical risk management overlay, which is based on volatility, trend and rate-of-change, continues to partially hedge our equity exposure.
Current Asset Allocation:
Large Cap Equity
30.0%
Long-term U.S. Gov. Bonds
17.0%
Small Cap Equity
0.0%
Int-term U.S. Gov. Bonds
15.0%
International Equity
0.0%
Municipal Bonds
11.0%
Emerging Markets
0.0%
Gold/Currency
22.0%
Equity Hedge(small-cap and volatility)
(11.0%)
Commodity
0.0%
RISK ASSETS
19.0%
SAFE ASSETS
65.0%
Equity Market Outlook: In our view, more than seven years of the Fed induced financial repression - 0% interest rates, negative real rates and Quantitative Easing - has greatly distorted the financial markets, driven stock valuations far from their underlying fundamentals and created an extremely poor long-term risk-reward for stocks. Also, despite the recent central bank induced market rally, we believe that stocks are in a bear market that began last summer. Historically, the average bear market decline is 32.4% over 13 months and since we estimate that fair value for the S&P 500 is 1265 (a decline of 41.0%), we expect the S&P 500 to decline by 30% to 40% by the end of 2016.
The recent intervention by the global central bankers has ignited a dramatic 14.5% rally over the past seven weeks, and in our view is another example of central bankers trading a short-term benefit for a negative long-term consequence. By setting interest rates below zero and promising to purchase investment grade corporate debt, central bankers have gone further into unchartered territory in an effort to delay the inevitable. While such aggressive monetary measures will drive risk assets higher in the short-term, they also reduce future growth by creating additional uncertainty, which leads to: less consumption, a misallocation of capital and encourages corporations to buy (share repurchases, mergers and takeovers), not build (capital investment for future growth and profitability).
In our view, central bankers have been "pushing on a string" and the recent advent of negative interest rates indicates a level of desperation, which will ultimately undermine the financial system they are attempting to prop up. Because negative interest rates hurt banks by reducing their profitability, future interest rate reductions will only lead to lower bank profits and less lending.
We believe the global credit cycle is over - spreads are widening while debt downgrades and defaults are rising - and the central bankers' virtuous cycle of weak economic data, increased monetary accommodation, and higher asset prices has reached its endgame. In our view, we are in a bear market and the central bank interventions provide nothing more than counter-trend rallies that only temporarily delay the inevitable regression to the mean.
While many pundits believe that we are not in a bear market because the recent decline in the S&P 500 was only 15% and the index is currently only 4.0% below its May all-time-high, we believe that most stocks are in a bear market and the S&P 500's resilience is temporary and due to investor's "flight to quality" and the near-record amount of corporate share buybacks during the first quarter. Also, we are clearly in an earnings recession - first quarter earnings are expected to decline by 8.5% year-over-year and this will be the fourth quarter in-a-row of declining earnings - it is extremely rare to have an earnings recession without a bear market.
Since small-cap companies are considered lower quality and their stocks prices are more volatile and risky than large companies, investors typically sell their small stocks first to reduce their risk exposure. For this reason, small cap stocks have historically been a good leading indicator of both investors' risk preferences and the stock market. Unfortunately, the Russell 2000 has underperformed the S&P 500 for nearly two years, and while the S&P 500 declined 15% from its May all-time-high, the R2000 fell more than 27%. Given the dramatic weakness and underperformance by small cap stocks, we are confident that we are in a bear market, which will soon negatively affect large cap stocks.
In addition to investors' "flight to quality", massive corporate buybacks may help explain the S&P 500's resilience. It is estimated that companies in the S&P 500 repurchased a near-record $165 billion worth of stock in the first quarter. While share repurchases boost the stock price and help earnings-per-share growth in the short-term, the corresponding reduction in capital investment lowers future profitability and potential growth. Given that stocks are historically expensive and earnings are declining, we expect the recent record buybacks will not seem prudent in hindsight. Also, as earnings decline and the corporate credit market tightens, we expect that companies will be less willing (or unable) to repurchase shares in the future, which will remove a major support for the large cap indices.
Also, it would be very unusual to be in an earnings recession but not a bear market, especially when stocks are overvalued. GAAP earnings-per-share for the S&P 500 peaked in September of 2014 at $105.96 and have declined by 18.3% to $86.53 for the fourth quarter of 2015. While many believe that the current weak earnings are confined to the energy and industrial sectors of the economy, we are concerned that revenue growth and profit margins have each contracted for the last five quarters (S&P 500 operating margins declined to 7.98% from 10.1%). Despite five quarters of contraction, profit margins remain unsustainably high and as they continue to regresses back to a normal level, earnings are poised to disappoint complacent investors and lead to lower stock prices.
Finally, the significant weakness in the global equity markets supports our view that the resilient S&P 500 is masking a bear market. Most major global equity markets peaked last summer, in unison with our equity markets, but suffered more dramatic peak-to-trough declines: China's Shanghai Stock Exchange (-49.4%), Japan's Nikkei (-29.4%), Germany's DAX Composite (-29.6%), UK's FTSE 100 (-23.2%), France's CAC 40 Index (-27.3%). Globalization has led to increased correlations between countries and markets and we believe that the bear market in foreign markets reflects the significant global economic problems and growing deflationary risk, which will continue to negatively impact our economy and financial markets.
Chart 1: Russell 2000 Small Cap Index
The R2000 index, which is comprised of 2000 small-cap companies, has been a solid leading indicator for the market and investor's risk preferences. The R2000 has underperformed the S&P 500 since March of 2014 and has declined 27% from its June 2015 high. Despite the central bank interventions, the R2000 has retraced only 50% of its bear market decline and remains 15% below its all-time-high.
Source:StockCharts.com
Chart 2: Market Capitalization to GDP
Despite the market's recent decline, stocks remain expensive. In a 2001 Fortune Magazine article, Warren Buffett stated that market capitalization relative to GDP "is probably the best single measure of where valuations stand at any given moment." Currently, stock market capitalization is 116% of GDP; this is significantly above the 50-year average of 65%. Based on this valuation measure, stocks would need to decline by 44% to be considered fairly valued.
Source:FRED
Chart 3: S&P 500 and GAAP Earnings
Over the past twelve months, the S&P 500 is essentially flat, while GAAP earnings have declined 15.5% from a year ago and have fallen 18% from the September of 2014 cyclical peak (S&P 500 earnings declined to $86.53 from $105.96). In our view, stocks remain detached from their fundamentals due to central bank activism and complacent investors.
Source: StockCharts.com
Chart 4: Corporate Profits to GDP
It appears that profitability has peaked for this cycle. Currently, corporate profits are 9.0% of GDP, which remains significantly above the historic average of 6.5%. We expect earnings growth will continue to disappoint investors as profitability returns to a normal level.
Source: FRED
Chart 5: Global Equity Markets
Most global equity markets peaked in unison last summer and had severe bear market declines of 23%-to-49% over the following eight months. Despite central bank actions, fundamentals continue to deteriorate and we believe the global markets are poised for another leg down in the bear market.
Source: StockCharts.com
Economic Outlook: While market-based indicators (the yield curve, credit spreads, inflation expectation, market breadth and gold's twelve-month rate-of-change) have modestly improved from the mid-February market lows, they still point to economic weakness and do not confirm the Fed's recent guidance of two (previously four) interest rate increases this year. Additionally, the Atlanta Fed's GDPNow Model is forecasting first quarter GDP growth of 0.10% for the first quarter, which is significantly below previous expectations of 2.5%
It has been our belief that economic growth peaked in late 2014 and now the economy is in the early stages of its down cycle. The previous expansionary cycle was muted because of our excessive debt burden, the increase in the tax and regulatory burden and the Fed's QE program, which reduced productivity by incentivizing corporate America to grow earnings through financial engineering rather than capital investment.
We believe the central bankers' monetary illusion, which stimulates asset prices but not the economy, is coming to an end because: negative interest rates - their new monetary tool - hurt the financial sector that they are trying to support, and QE creates misallocations of capital and wealth inequality (elevated asset values make the rich become richer, while the main street economy receives little benefit).
As we have argued for a long time, solid fiscal policy, not unprecedented monetary policy, is the solution to the repair our economic problems. In our view, it is essential that central bankers "get out of the way" and let the markets work. Once the free markets adjust and clear, they will give investors and corporations valid economic signals and the confidence to make long-term investment decisions that will spur economic growth. Additionally, if simple fiscal measures are enacted, such as, simplify and reduce the tax and regulatory burden, while adopting a rules-based monetary policy, we are confident that the significant pent-up demand (i.e., seven years of underinvestment) would lead to very robust growth - similar to the early-to-mid-1980s.
Chart 6: Atlanta Fed GDPNow GDP Forecast
The S&P 500 has rallied 14.5% over the past seven-weeks, while the economy has continued to deteriorate. During this period, the GDP growth forecast for the first quarter has declined from 2.5% to 0.10%. This forecast confirms the action in market-based indicators and validates our defensive investment posture.
Source: Atlanta Fed
Chart 7: Yield Curve (2-year to 10-year)
A flattening yield curve does not bode well for economic growth. The yield curve has flattened dramatically since its January 2014 high, and has flattened by 30bps over the past year to its lowest level since the 2008 recession.
Source: FRED
Chart 8: High-Yield Credit Spreads
While investment grade spreads have modestly improved since the equity market's February low, high yield spreads remain elevated and continue to indicate a change in investors' risk tolerance, and a reduction in market liquidity, which will provide a difficult environment for equities.
Source:FRED
Chart 9: Nominal GDP
Nominal GDP growth continues to grow at less than 3%. Historically, this is a level that only occurs during recessions and is another indication of the deflationary pressure in the global economy. Solid fiscal policy, not uncharted monetary policy, is the only cure for this dismal growth.
Source:FRED
Short Term View (three months): We expect that the recent central bank induced rally is nearly complete and the markets are poised for the next leg down in the bear market. While the stock market has been very strong, divergences are appearing, which lead us to believe the seven-week-rally is essentially over. Market breadth (advance-decline ratio), foreign markets, commodity prices and the high-yield-debt market have not confirmed the recent equity market's strength. A weekly close below 2000 on the S&P 500 would increase our confidence that the next leg of the bear market has arrived.
Chart 10: S&P 500 and Negative Divergences
While the S&P 500 remains in rally mode, both the market's breadth and the riskier markets (oil, commodities, and high yield) have begun to divergence from the S&P 500. This divergence signals a short-term shift in investors' risk preferences and may presage a stock market correction.
Source: StockCharts.com
Summary: The new year began on a sour note as disappointing fundamentals and deflationary fears led to a sharp equity market decline. By mid-February, central banks intervened and pushed monetary policy to an unprecedented level, in an attempt to mitigate the decline. We believe the central bankers' new policy of negative interest rates is a sign of desperation and that they are out of monetary tools, because future interest rate reductions (further below 0.0%) will only hurt the financial sector they are desperately trying to prop up.
We remain circumspect and believe that stocks offer a very poor long-term risk-reward. Despite the recent central bank induced rally, earnings are in recession and we are confident that we are in a global bear market. Our asset allocation remains defensively postured: underweight equities and overweight "safe asset" (U.S. Treasury bonds, gold and Japanese yen). We are focused on protecting capital, reducing volatility and providing positive absolute returns. Strategically, we will remain defensively postured until equities provide a favorable long-term risk-reward.
Our core philosophy is that the best way to grow wealth is: have a long-term investment horizon, invest in a diversified and economically balanced (stocks, bonds, currencies and commodities) portfolio and avoid major losses. In our view, we are in a bear market, corporate revenues, profit margins and earnings are contracting; yet the equity markets remain overvalued and offer a very poor risk-reward. We believe prudent investors should reduce their exposure to risky assets and be patient until the risk-reward improves and investors are adequately rewarded for assuming equity risk. Historically, liquidity-driven bull markets deflate quickly, and patient investors will be rewarded with great values and significant long-term opportunities.
All information disclosed in this statement is accurate and complete to the best of our knowledge. Past performance is no guarantee of future results, and there is no assurance that the firm or client's investment objectives will be achieved.
Disclosure: I am/we are long SPY, SPLV, MDY, TLT, IEF,VGIT, MUB, GLD, FXE, FXY, TWM, VXX.
I wrote this article myself, and it expresses my own opinions. I am not receiving compensation for it. I have no business relationship with any company whose stock is mentioned in this article.
D > agree with all, messing with stuff here too
studies settings etc on tick charts
I've made a few 3% trades but, that's all the market has been dishing out. It's been a wash rinse repeat pattern for about five days now. We should see the movement down tomorrow to 1087 if the pattern continues. It does look like the opex lines are going to be the magnets until Friday.
I see a divergence on the daily TF chart that hasn't played out yet. I also see a head and shoulder pattern on the daily chart with price sitting on the right shoulder. I keep expecting the market to roll over but, I've been fooled before.
Still working on my charts.
tf > no range worth playing in, even with tna
last 5 days only a 55.00 / 56.75ish box to play in
something has to give hopefully but it's OpEx week
and hold tna OpEx line @ 55.89 > maybe the ratz stick it there
tf line 1095.50
spy line 204.07 / es line 2036.50
Very interesting day. My RVX daily reverse chart didn't roll over as expected but, the VIX daily reverse chart did.
/TF is showing a lot of weakness on the daily chart but, has a little way to go before I would call it completely rolled over. 1073 is my line in the sand for that chart.
I'm still in the bear camp.
>> Monday AM > more epic blabber
8:30am Treasury Sec Lew Speaks
9:25am FOMC Member Dudley Speaks
Tentative Fed Announcement < no idea what's cooking >
scheduled 11:30 AM start
11:30 3-Month Bill Auction 6-Month Bill Auction
13:00 FOMC Member Kaplan Speaks

Obama, Yellen to meet Monday: http://www.marketwatch.com/story/obama-yellen-to-meet-monday-to-talk-economy-2016-04-10
Interesting video on seasonal trends. Based on Barry's research, (1970 - 2003) we should have weakness going into tax day this week as people sell off to pay their taxes. Seasonal trends don't always work but, I think they are a good piece of the puzzle to keep in the back of your mind when swing trading.
Barry's indicators are not built for TOS but, he has some great ideas and instructions on how to analyze the market. Thanks to Spdpro for posting Barry's videos a few years ago! I try to keep up on his periodic "free" videos because I usually learn something and/or grab and idea from him to try to duplicate in my code.
http://emini-watch.com/stock-market-seasonal-trades/5701/
Or it's to talk about letting the Bank of Japan to intervene and push down the yen. Their little negative interest trial run doesn't work with the currency getting strong. So more fed market manipulation. Some say don't fight the fed. I say to the fed stop fighting the markets. Digging the hole deeper. Much further and the correction will be to hell.
Me too but, then it would make it hard for the government to print their funny money when times get rough. I just don't know enough about all the pieces to this puzzle to really comment intelligently.
I wish I knew more about the forex markets. I'll have to research it more. So much to learn and so little time :)
Make sure to have some gold a silver before than.
Not sure. But I know I would rather have a gold backed currency renminbi over a currency backed by the full faith of a government.
end the London Newyork gold fix. Should restore it to its true value.
yep I have a few charts (minus) flipped tza vxx > >
can't remember where I learned that from ? prob
something on tastytrade or some tos vid
seems our "trained" brains are for up patterning
NOTE: minus tza or whatever will Not work on tick settings
so I use it on a 1 or 3 min
Hmmmmm, that is interesting! I wonder what that will do to the global currency markets? Good guess.
This is my guess.
(Updated to include background on banks that may participate in the yuan-denominated fixing)
London 25/02/2016 – China plans to launch its new yuan-denominated gold pricing fix on April 19 this year, sources familiar with the matter said on Thursday.
The launch date has been officially settled and draft trading rules have been sent out to those banks that will be involved in the Shanghai fixing, FastMarkets understands.
The banks that will participate in the planned launch are predominently Chinese but FastMarkets understands that foreign banks could also be involved, according to sources.
It is likely that the 10 banks that are official market makers in the system set up by the SGE in January to facilitate interbank gold trading will participate in the yuan-denominated fixing, one source said.
Most Chinese banks in the list of ‘official’ market makers probably will be involved in the fix, the source noted, alongside one foreign bank.
The 10 ‘official’ market makers are ICBC, Agricultural Bank of China, Bank of China, China Construction Bank, Bank of Communications, China CITIC Bank, China Merchants Bank, Industrial Bank Co, Bank of Ningbo and ANZ (China).
The SGE is looking to bring more foreign banks on broad, a well-informed source said.
The new benchmark will be run through the state-owned Shanghai Gold Exchange (SGE), the world’s largest physical gold exchange.
The SGE declined to comment.
(Editing by Mark Shaw)
- See more at: http://www.bulliondesk.com/gold-news/update-china-plans-to-launch-yuan-denominated-gold-fix-april-19-sources-109581/#sthash.j2Zwhqzy.dpuf
I know! I wonder what that is going to be all about? They have been talking a lot lately hehehe.
Hey, did you know that if you put a "-" minus sign before the ticker in TOS that you can flip your charts upside down? I flipped my VIX and RVX daily charts. I just flipped the TF chart and it's looking interesting too.
heads up on this one >
out of the blue late Friday >
http://www.zerohedge.com/news/2016-04-08/fed-hold-unexpected-meeting-under-expedited-procedures-monday-discuss-rates
It will be interesting to see if that line holds until Friday. My VIX and RVX daily charts flipped on Thursday but, I have not seen the indexes flip yet. VIX can lead so I'm pretty curious. (I've been spending a lot of time with TOS lately.) Price could break and then come back for a retest of the option expiration line on Friday but, right now, I just don't see upside on my index charts. Guess we will see. Should be an interesting week.
Hi D > those (last) OpEx lines looking pretty valuable at the moment
I've been brushing up on my pivot point skills lately and finding them very helpful for scalping during the day. I have figured out some strategies on my own and also posted a link in the iBox for someone that made a living using them. I posted some other links there I think are useful too for using this trading strategy.
TOS has code for pivot points but, I've never liked it. The code below changes the dots to dashed lines which I think is much easier to view on the charts. Most of the time I select the option to only view the points for the day. However, I do turn them all on during off trading hours to view what they are doing in relation to each other.
Happy trading!
#####################
input marketThreshold = 0.00;
input timeFrame = {default DAY, "2 DAYS", "3 DAYS", "4 DAYS", WEEK, MONTH, "OPT EXP"};
input showOnlyToday = no;
rec marketType = {default DISABLED, NEUTRAL, BEARISH, BULLISH};
def PP2 = high(period = timeFrame)[2] + low(period = timeFrame)[2] + close(period = timeFrame)[2];
marketType =
if PP2[-1] > (PP2[-1] + PP2 + PP2[1]) / 3 + marketThreshold then marketType.BULLISH else
if PP2[-1] < (PP2[-1] + PP2 + PP2[1]) / 3 - marketThreshold then marketType.BEARISH else marketType.NEUTRAL;
plot R4;
plot R3;
plot R2;
plot R1;
plot PP;
plot S1;
plot S2;
plot S3;
plot S4;
if showOnlyToday and !IsNaN(close(period = timeFrame)[-1])
then {
R1 = Double.NaN;
R2 = Double.NaN;
R3 = Double.NaN;
R4 = Double.NaN;
PP = Double.NaN;
S1 = Double.NaN;
S2 = Double.NaN;
S3 = Double.NaN;
S4 = Double.NaN;
} else {
PP = (high(period = timeFrame)[1] + low(period = timeFrame)[1] + close(period = timeFrame)[1]) / 3;
R1 = 2 * PP - low(period = timeFrame)[1];
R2 = PP + high(period = timeFrame)[1] - low(period = timeFrame)[1];
R3 = R2 + high(period = timeFrame)[1] - low(period = timeFrame)[1];
R4 = R3 + high(period = timeFrame)[1] - low(period = timeFrame)[1];
S1 = 2 * PP - high(period = timeFrame)[1];
S2 = PP - high(period = timeFrame)[1] + low(period = timeFrame)[1];
S3 = S2 - high(period = timeFrame)[1] + low(period = timeFrame)[1];
S4 = S3 - high(period = timeFrame)[1] + low(period = timeFrame)[1];
}
PP.SetDefaultColor(GetColor(0));
R1.SetDefaultColor(GetColor(2));
R2.SetDefaultColor(GetColor(8));
R3.SetDefaultColor(GetColor(3));
R4.SetDefaultColor(GetColor(5));
S1.SetDefaultColor(GetColor(2));
S2.SetDefaultColor(GetColor(8));
S3.SetDefaultColor(GetColor(3));
S4.SetDefaultColor(GetColor(5));
PP.SetStyle(Curve.firm);
R1.SetStyle(Curve.SHORT_DASH);
R2.SetStyle(Curve.SHORT_DASH);
R3.SetStyle(Curve.SHORT_DASH);
S1.SetStyle(Curve.SHORT_DASH);
S2.SetStyle(Curve.SHORT_DASH);
S3.SetStyle(Curve.SHORT_DASH);
def paintingStrategy = if timeframe == timeframe.WEEK then PaintingStrategy.DASHES else if timeFrame == timeFrame.MONTH or timeFrame == timeFrame."OPT EXP" then PaintingStrategy.DASHES else PaintingStrategy.DASHES;
PP.SetPaintingStrategy(paintingStrategy);
R1.SetPaintingStrategy(paintingStrategy);
R2.SetPaintingStrategy(paintingStrategy);
R3.SetPaintingStrategy(paintingStrategy);
R4.SetPaintingStrategy(paintingStrategy);
S1.SetPaintingStrategy(paintingStrategy);
S2.SetPaintingStrategy(paintingStrategy);
S3.SetPaintingStrategy(paintingStrategy);
S4.SetPaintingStrategy(paintingStrategy);
Thank you so much
I hope the code for the candlesticks in the ThinkorSwim platform will at least get you headed in the right direction. There are some sites online that you can pay to join that might be able to help you. Or, once you get something roughly written, you can email the thinkscript people at TOS. I haven't done that but, that's what they have told me when I inquired about help.
It takes me a lot of time but, eventually I figure out how to write the code to do most of the things I want on my charts. I have posted a lot of code in the intro box that I wrote and/or pieced together from other code I've seen. There is some code Spdpro shared as well there. I haven't written anything like you want. However, when I was coming up the learning curve, I posted a lot of information and links in the iBox. Perhaps you will find something there that is useful to you.
Best of luck and good trading.
(The Show Intro button is in the top right hand corner of this Board on the main page.)
First of all thank you very much
I did not even know about the patterns
i looked at all of them and none of them match
this code
Bar #1 is an up bar.
Bar #2 is a down bar, and the high of Bar #2 is higher than the close of Bar #1.
Bar #3 is a down bar, and the close of Bar #3 is lower than the open of Bar #1.
This code looked like the closest but did not have all 3 components
Guess i need to start studying how to write code
#wizard text: Inputs: length:
#wizard input: length
#wizard text: trend setup:
#wizard input: trendSetup
input length = 20;
input trendSetup = 3;
plot Bearish = Engulfing(length, trendSetup).Bearish[1] and
open > close and
close < close[1];
Bearish.SetPaintingStrategy(PaintingStrategy.BOOLEAN_ARROW_DOWN);
Bearish.SetDefaultColor(GetColor(9));
Bearish.SetLineWeight(2)
Have you checked to see if the candlestick pattern is already coded into TOS? Under "Patterns", "Select Patterns, and then "Candlestick" there are a lot of candlestick patterns that you can choose to be added to the price section of your chart.
Hi New to writing TOS
How could i write a simple code for this :
3BR= 3 bar reversal. It’s a candlestick pattern. At a trading top, it will look like this:
Bar #1 is an up bar.
Bar #2 is a down bar, and the high of Bar #2 is higher than the close of Bar #1.
Bar #3 is a down bar, and the close of Bar #3 is lower than the open of Bar #1.
The inverse occurs at trading bottoms.
Any help would be greatly appreciated
Kevin
hi D > I'd like to get that code from you if possible > thanks
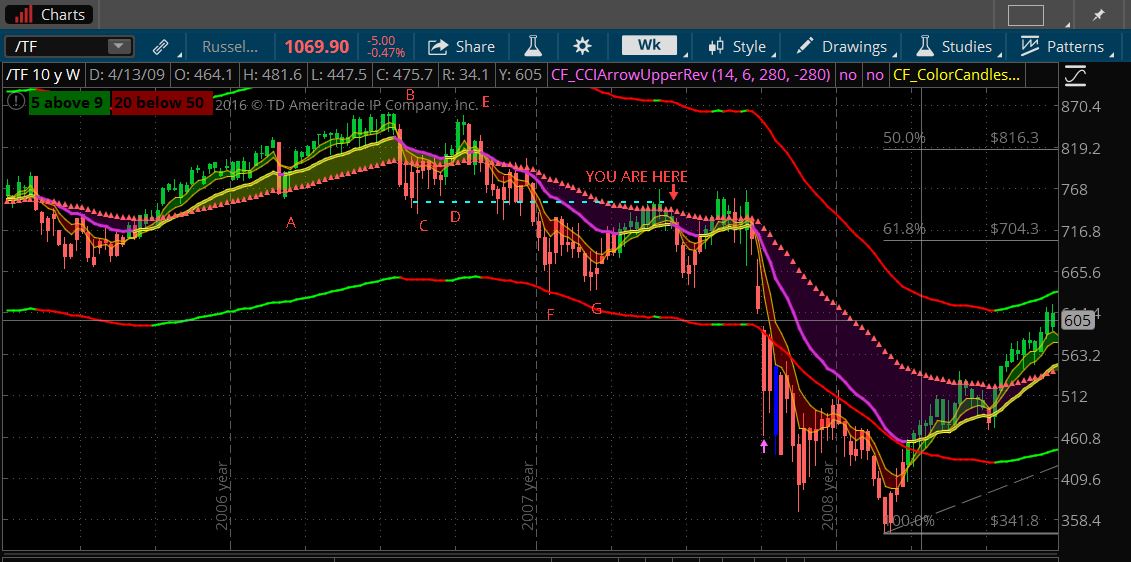
Long view ... 2016 repeating pattern from 2008? If so, just finished a dead cat bounce.

|
Followers
|
44
|
Posters
|
|
|
Posts (Today)
|
0
|
Posts (Total)
|
3636
|
|
Created
|
08/22/10
|
Type
|
Free
|
| Moderator desertcynlite | |||
| Assistants spdpro | |||
This board is for those interested in using technical analysis to trade ETF's and stocks using swing trading and day trading systems. The board is for open minded people who wish to share ideas and observations about just in time action in the stock market. All are welcome to join in the fun! ThinkorSwim is the primary platform used to create charts and as such most of the discussion is around programming and creating charts in ThinkorSwim.
Please keep all posts civil, leaving political discussion and egos checked at the door.
P.S. Please use "OT" prior to any post that does not contain on topic material. However, please keep in mind that in order for this to remain a "free" board according to the rules of Investor's Hub, most posts should remain on topic.
Thank for joining the board!
Resources on the Web:
The Chart Pattern Trader: http://thechartpatterntrader.com/
VIX Blog: http://vixandmore.blogspot.com/
Understanding Decay Part 1: http://caps.fool.com/Blogs/understanding-etfetn-decay/597736
Understanding Decay Part 2: http://caps.fool.com/Blogs/understanding-etf-decay-part/597928
Volatility Indexes: http://hypervolatility.com/volatility-modelling/equity-volatility-indices-vix-vxn-vxd-rvx/
2013 Spreadsheet VIX&SPX: http://investorshub.advfn.com/boards/read_msg.aspx?message_id=91737761
Trading Gaps: http://www.thegapguy.com
Stocktwits.TV: http://www.stocktwits.tv/
Wall Street Journal: http://online.wsj.com/mdc/public/page/marketsdata.html
Dow Theory: http://en.wikipedia.org/wiki/Dow_theory
Ten Best Candlestick Patterns: http://www.swing-trade-stocks.com/candlestick-patterns.html
Bullish/Bearish Candlestick Patterns: http://www.candlesticker.com/Bullish.asp
Bulkowski's Best Chart Patterns: http://thepatternsite.com/BestPatterns.html
Using Prophet Charts to find Patterns: http://www.youtube.com/watch?v=VkpMHF7Ridc
Economic Calendar: http://www.bloomberg.com/markets/economic-calendar/
Tim Knight's Slope of Hope Blog: http://slopeofhope.com/
Corey Rosenbloom's Afraid to Trade Blog: http://blog.afraidtotrade.com/
Condor Options Blog: http://condoroptions.com/
Great Software for IRS Wash Sales: http://www.tradelogsoftware.com/products/tradelog/
Abnormal Returns Blog: http://abnormalreturns.com/
ETF Prophet: http://etfprophet.com/
Buy/Sell Model: http://buysellmodel.com/
Monthly Put/Call Analysis for Opt. Exp.: http://leavittbrothers.com/blog/?cat=103
Option's Calendar: http://www.cmegroup.com/trading/equity-index/files/SP-500-options-calendar.pdf
HeatMap of Market - configurable: http://www.smartmoney.com/map-of-the-market/
Trading Gaps: http://trading-stocks.netfirms.com/gaps1.htm
The "Myth of Max Pain" article: http://investmentxyz.blogspot.com/2006/05/myth-of-max-pain_19.html
Trading Videos:
Tastytrade Market Talk Videos: https://www.tastytrade.com/#/shows/market-talk
Emini Trading: http://emini-watch.com/
#######
Think or Swim Resources:
email: thinkorswimtechsupport@tdameritrade.com; phone: 800-672-2098 (ask for Chicago office.)
Constant Colors: http://team.thinkorswim.com/manual/dark/thinkscript/reference/Constants/Color/index.html
Custom Sounds: http://finance.dir.groups.yahoo.com/group/TOS_thinkscript/message/4780
ReadTheProspectus: http://readtheprospectus.wordpress.com/
Shadowtrader: http://www.shadowtrader.net/weekend_updates2011/111030we_final.html
Free Code: http://freethinkscript.blogspot.com/
More Free Code: http://search.traders.com/search?q=thinkorswim+script&btnG=Search&entqr=0&output=xml_no_dtd&sort=date%3AD%3AL%3Ad1&client=default_frontend&ud=1&oe=UTF-8&ie=UTF-8&proxystylesheet=default_frontend&site=entire_site&filter=0
TOS Ratio Charts: http://investorshub.advfn.com/boards/read_msg.aspx?message_id=72707087
ThinkDesk User's Manual: http://mediaserver.thinkorswim.com/support/thinkDesktop.pdf
Linking Excel and ThinkorSwim: http://readtheprospectus.wordpress.com/2009/09/06/linking-excel-and-think-or-swim-for-streaming-real-time-calculations/
Thinkscript:
Custom Indicator Scripts: http://www.thinkscripter.com/
Paintbars Come to ThinkorSwim: http://readtheprospectus.wordpress.com/2009/09/12/paintbars-finally-come-to-think-or-swim/
Getting Started With Thinkscript Parts 1 & 2:
Part 1: http://www.youtube.com/watch?v=J4y19UdTA9A&feature=related
Part 2: http://www.youtube.com/watch?v=gRB42FsOWRw&feature=related
ThinkScript User's Manual: https://www.thinkorswim.com/tos/thinkScriptHelp.jsp?laf=dark
ThinkorSwim Resource Manual: http://team.thinkorswim.com/manual/dark/index.html
Prodigio: (Prodigio is no longer supported by TDAmeritrade!!!
email: Prodigio@thinkorswim.com; phone: Direct 773-244-7749 or 866-839-1100 ext. 7749;
Forum: http://www.prodigiorts.com/http://www.prodigiorts.net/forums/Getting%20Started
Video Archive: http://www.prodigiorts.net/videoarchive
Introduction to Trading with Prodigio: http://www.youtube.com/watch?v=OtcU6Z0m2po&feature=related
Prodigio Manual: http://rr-corner.squarespace.com/prodigio-manual/
Posts with Custom Code not in TOS (may contain errors...works in progress.)
Spdpro: http://investorshub.advfn.com/boards/read_msg.aspx?message_id=68488237
Fibonacci Pivots: http://investorshub.advfn.com/boards/read_msg.aspx?message_id=72995202
ADX: http://investorshub.advfn.com/boards/read_msg.aspx?message_id=73059624
Standard Pivots: http://investorshub.advfn.com/boards/read_msg.aspx?message_id=72983311
BollingerBand Fill: http://investorshub.advfn.com/boards/read_msg.aspx?message_id=72971915
Spdpro: http://investorshub.advfn.com/boards/read_msg.aspx?message_id=72934360
RVI: http://investorshub.advfn.com/boards/read_msg.aspx?message_id=72375457
RSI with Gradient Line: http://investorshub.advfn.com/boards/read_msg.aspx?message_id=73474308
EMASix: http://investorshub.advfn.com/boards/read_msg.aspx?message_id=74016255
Spdpro update 4/8/12: http://investorshub.advfn.com/boards/read_msg.aspx?message_id=74153484
Volume with 2 Averages: http://investorshub.advfn.com/boards/read_msg.aspx?message_id=74343095
Alert Code: http://investorshub.advfn.com/boards/read_msg.aspx?message_id=91364438
Fractal Code: http://investorshub.advfn.com/boards/read_msg.aspx?message_id=91678788
Volume Zone Oscillator http://investorshub.advfn.com/boards/post_new.aspx?board_id=18585
Using Pivot Points:
Custom Code: http://investorshub.advfn.com/boards/read_msg.aspx?message_id=121798065
https://www.tradingview.com/chart/SPX500/47iWUwzO-Pivots-Indicator-I-Made-A-Living-Trading-This-System-For-2-Yrs/
http://www.pivotpointcalculator.com/
http://tradingmarkets.com/recent/combining_trading_strategies_to_improve_your_odds-640609.html
http://tonylaporta.com/the-intricacies-of-the-pivot-points/
Technical Issues:
Reoccurring Error Messages in popups: http://investorshub.advfn.com/boards/read_msg.aspx?message_id=73711643
Restore to Previous Build: http://investorshub.advfn.com/boards/read_msg.aspx?message_id=73713733
Software Questions/Answers: https://www.thinkorswim.com/tos/displayFaq.tos?categoryKey=SOFTWARE
#######
Volatility:
Quarterly Statistics: http://www.investopedia.com/articles/financial-theory/08/volatility.asp#axzz1wBh8M2L2
Volatility Calculator; just input symbol: http://etfreplay.com/volatility.aspx
Resources for Measuring Economic Growth:
ISM Report: http://www.ism.ws/ismreport/mfgrob.cfm
US GDP Growth Rate: http://www.tradingeconomics.com/united-states/gdp-growth-annual
20 Year Treasury Bond Forecast: http://forecasts.org/interest-rate/20-year-treasury-bond-yield.htm
TED Spread Chart: http://thedismaloptimist.net/index.php/ted-spread-chart.html
H.15 Release http://www.federalreserve.gov/releases/h15/current/default.htm
#######
| Volume | |
| Day Range: | |
| Bid Price | |
| Ask Price | |
| Last Trade Time: |